. 2024 Sep 2;12(9):1007.
doi: 10.3390/vaccines12091007.

Beta Spike-Presenting SARS-CoV-2 Virus-like Particle Vaccine Confers Broad Protection against Other VOCs in Mice

Affiliations

Beta Spike-Presenting SARS-CoV-2 Virus-like Particle Vaccine Confers Broad Protection against Other VOCs in Mice

Irfan Ullah et al. Vaccines (Basel). .

Abstract

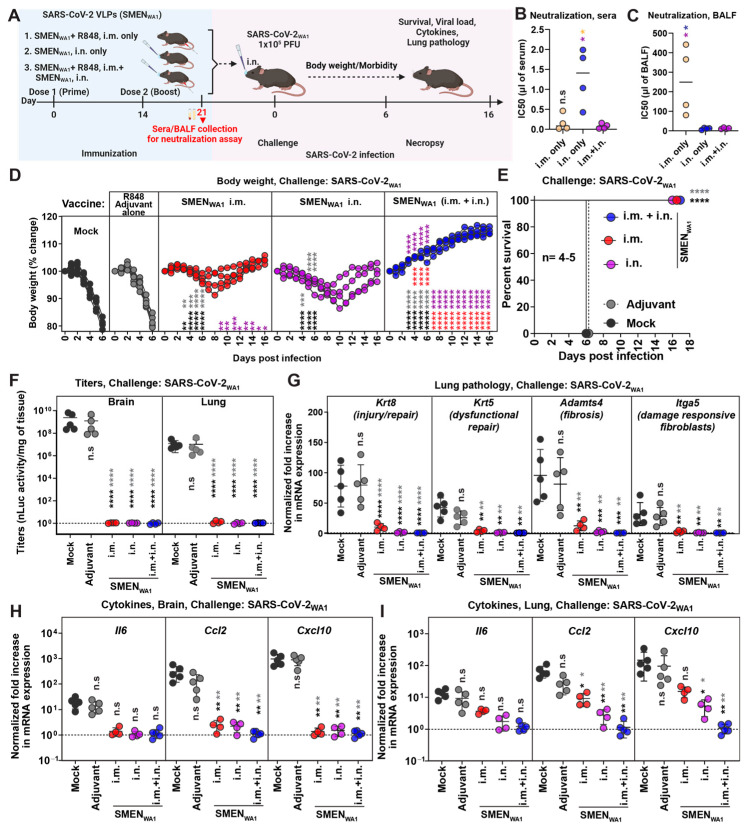
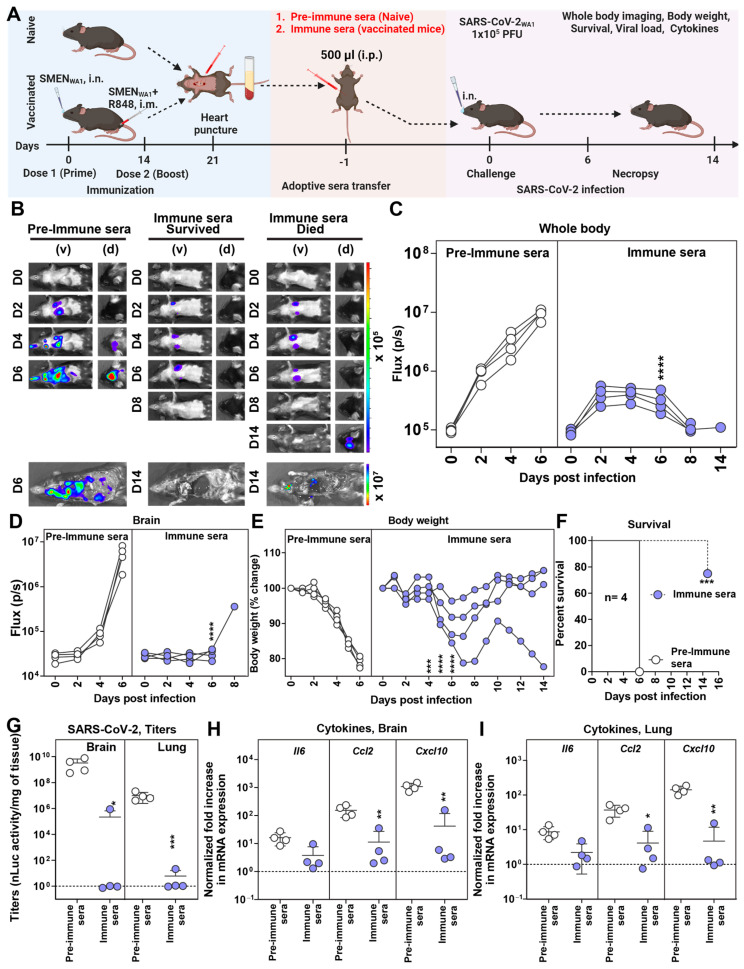
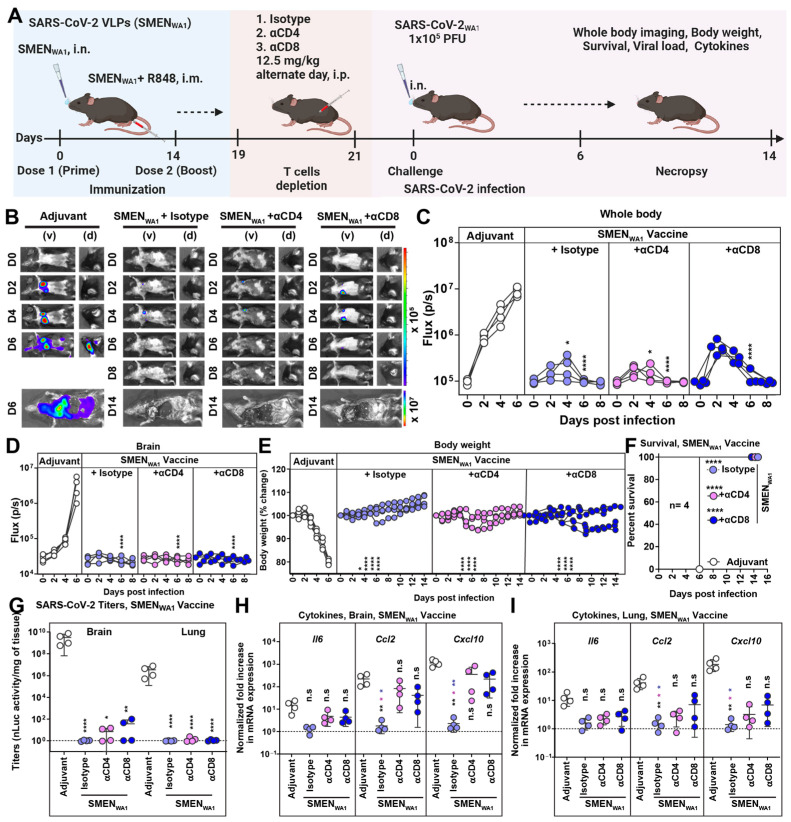
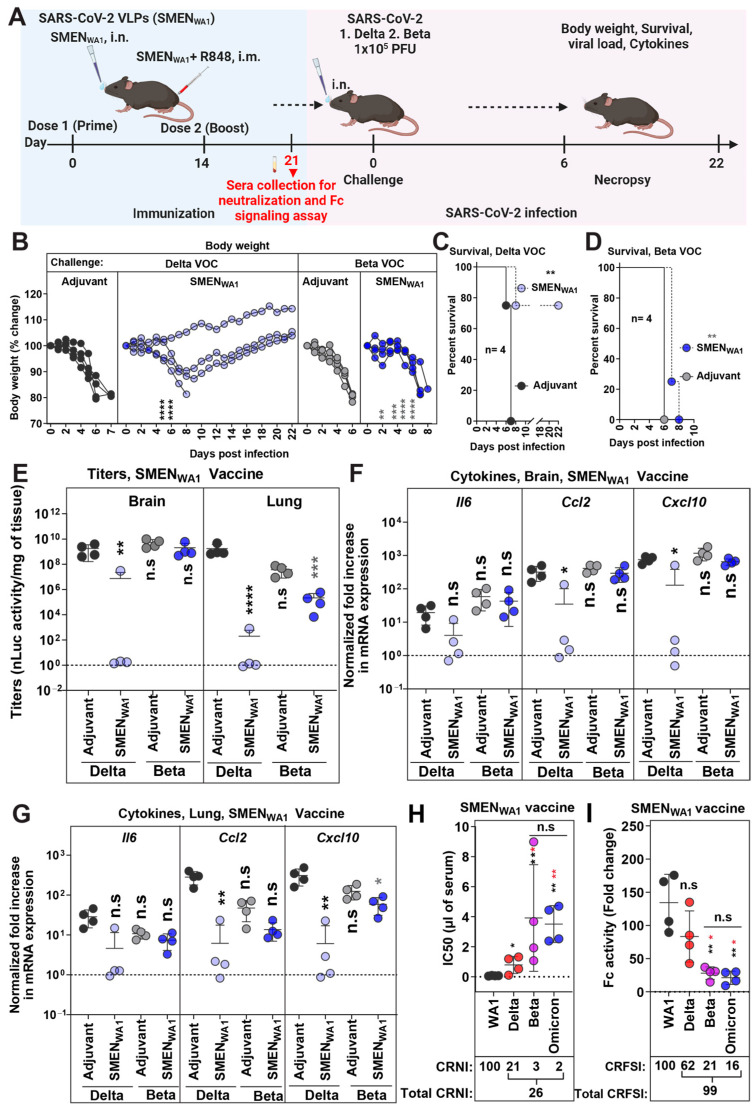
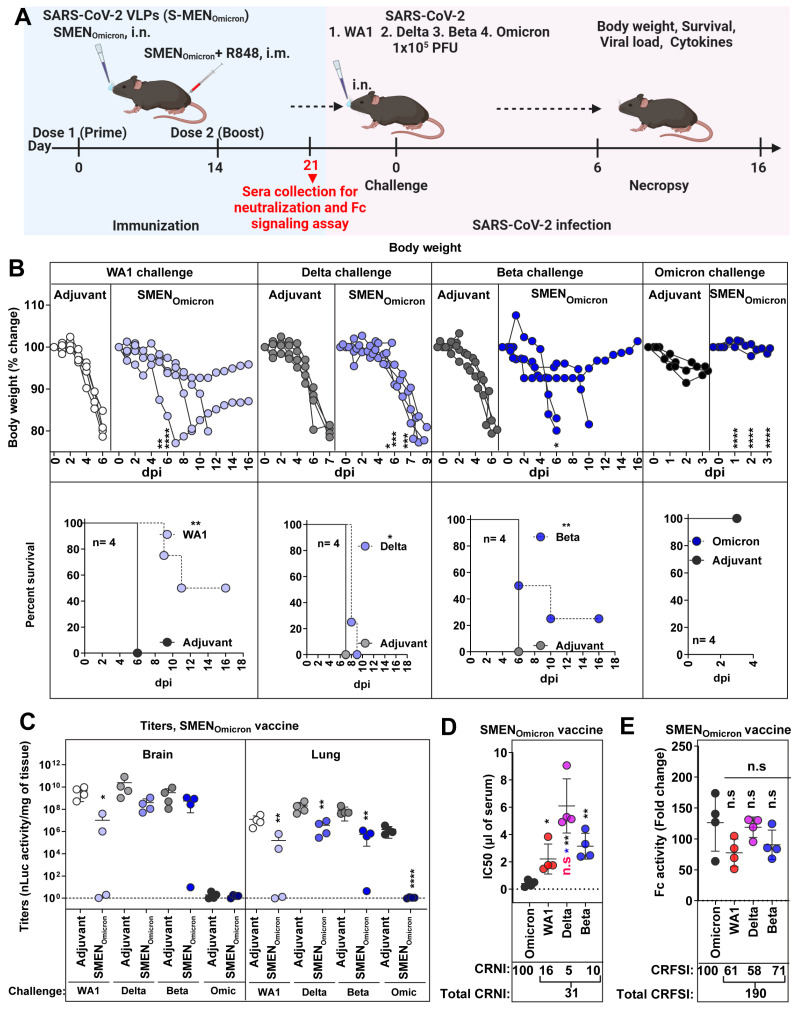
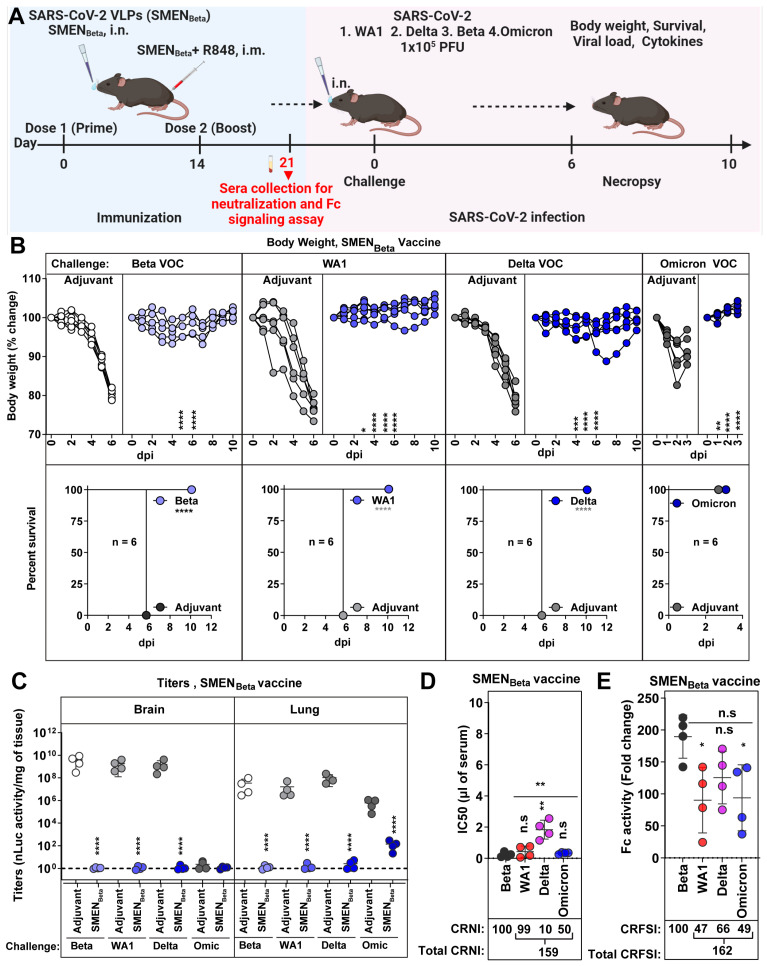
Virus-like particles (VLPs) are non-infectious and serve as promising vaccine platforms because they mimic the membrane-embedded conformations of fusion glycoproteins on native viruses. Here, we employed SARS-CoV-2 VLPs (SMEN) presenting ancestral, Beta, or Omicron spikes to identify the variant spike that elicits potent and cross-protective immune responses in the highly sensitive K18-hACE2 challenge mouse model. A combined intranasal and intramuscular SMEN vaccine regimen generated the most effective immune responses to significantly reduce disease burden. Protection was primarily mediated by antibodies, with minor but distinct contributions from T cells in reducing virus spread and inflammation. Immunization with SMEN carrying ancestral spike resulted in 100, 75, or 0% protection against ancestral, Delta, or Beta variant-induced mortality, respectively. However, SMEN with an Omicron spike provided only limited protection against ancestral (50%), Delta (0%), and Beta (25%) challenges. By contrast, SMEN with Beta spikes offered 100% protection against the variants used in this study. Thus, the Beta variant not only overcame the immunity produced by other variants, but the Beta spike also elicited diverse and effective humoral immune responses. Our findings suggest that leveraging the Beta variant spike protein can enhance SARS-CoV-2 immunity, potentially leading to a more comprehensive vaccine against emerging variants.

Keywords: Beta; Omicron; SARS-CoV-2; cross-VOC protection; intramuscular; intranasal; neutralizing antibodies; vaccine; variants of concern; virus-like particles.


Conflict of interest statement

The authors declare no conflicts of interest. The funders had no role in the design of the study; in the collection, analyses, or interpretation of data; in the writing of the manuscript; or in the decision to publish the results.

Figures

Figure 1
Figure 1
Enhanced Protection Against Lethal SARS-CoV-2 Challenge in K18-hACE2 Mice via Systemic and Mucosal SMEN Vaccine Administration (A) A scheme showing experimental design for comparing protective efficacy of SAR-CoV-2 VLP (SMENWA1) vaccine using various routes. A total of 250 µg of SMEN vaccine was used to immunize K18-hACE2 mice as depicted intramuscularly (i.m.) or i.n. using the prime-boost strategy. A total of 30 μg of vaccigrade TLR7/8 agonist R848 was used as an adjuvant for the i.m. route. Adjuvant and untreated mice served as control groups. A total of 21 days after immunization, sera/ bronchioalveolar lavage fluids (BALF) were harvested (before challenge), or mice challenged i.n. with 1 × 10⁵ PFU of SARS-CoV-2WA1 and indicated parameters were analyzed to assess protection. (B,C) Neutralizing titers (IC50) in the sera and BALF from indicated groups of vaccinated as in (A). (D) The graph illustrates the changes in body weight over time for K18-hACE2 mice following infection. Each line represents an individual animal, with the initial weight set at 100%. (E) The plot displays Kaplan-Meier survival curves for the experiment described in (A). (F) The graph shows the viral load measurements in various organs at the time of necropsy, expressed as nLuc activity per milligram of tissue, using Vero-E6 cells as targets. (G) Fold change in mRNA expression of indicated lung pathology markers, Krt8, Krt5, Adamts4, and Itga5 in the lung tissue after necropsy. (H,I) Changes in specific cytokine mRNA expression levels were measured in mouse brain and lung tissues following specified treatment protocols. These measurements were taken either at the time of death or at 16 dpi for surviving mice. The data were standardized against Gapdh mRNA from the same sample and from uninfected mice after necropsy in the experiments depicted in (GI). Statistical analysis for data in (B,C) employed the nonparametric Mann-Whitney test. For grouped data in (D) and (FI), a two-way ANOVA was conducted, followed by Tukey’s multiple comparison tests to assess significance. Statistical significance for the group comparisons to mock is shown in black, with adjuvant shown in light dark, with SMENWA1 i.m. shown in red, and SMENWA1 i.n. shown in magenta. *, p < 0.05; **, p < 0.01; ***, p < 0.001; ****, p < 0.0001; ns, not significant; Mean values ± SD are depicted.
Figure 2
Figure 2
SMEN Vaccine-Elicited Antibodies Can Protect Naïve Mice from SARS-CoV-2-Induced Mortality (A) Experimental design for testing the contribution of immune sera to conferring protection. Pre-immune sera (500 µL) or sera from vaccinated mice (immune sera) were passively transferred into naïve K18-hACE2 mice one day before challenge with SARS-CoV-2WA1-nLuc (i.n., 1 × 10⁵ PFU). (B) The BLI images show nLuc signals in mice infected with SARS-CoV-2WA1-nLuc in ventral (v) and dorsal (d) view. (C,D) Non-invasive measurement of nLuc signal as flux (photons/sec) over time. (E) The graph illustrates the changes in body weight over time for K18-hACE2 mice following infection. Each line represents an individual animal, with the initial weight set at 100%. (F) The plot displays Kaplan-Meier survival curves for the experiment described in (A). (G) The graph shows the viral load measurements in various organs at the time of necropsy, expressed as nLuc activity per milligram of tissue, using Vero-E6 cells as targets. (H,I) Changes in specific cytokine mRNA expression levels were measured in mouse brain and lung tissues following specified treatment protocols. These measurements were taken either at the time of death or at 16 dpi for surviving mice. The data were standardized against Gapdh mRNA expression from the same sample and from uninfected mice after necropsy in the experiments depicted in (G,I). A statistical analysis was conducted for grouped data in (C–E) and (G–I), and a two-way ANOVA was conducted, followed by Tukey’s multiple comparison tests to assess significance. Statistical significance for the group comparisons to pre-immune sera is shown in black. *, p < 0.05; **, p < 0.01; ***, p < 0.001; ****, p < 0.0001; ns, not significant; Mean values ± SD are depicted.
Figure 3
Figure 3
Minor Yet Distinct Role of CD8+ and CD4+ T Cells in SMENWA1 Vaccine-mediated Protection. (A) Experimental design to test the contribution of CD4+ and CD8+ T cells in SMEN-vaccine meditated protection. K18-hACE2 mice were immunized as shown using the combined regimen with SMENWA1. Adjuvant-treated mice served as control. αCD4 and αCD8alpha mAbs (12.5 mg/kg body weight, i.p.) were used to deplete CD4+ and CD8+ T cells every 48-h starting at 19 days post-vaccination. Isotype mAb treated cohorts served as controls (Isotype). The mice (n = 4 each group) were challenged with 1 × 10⁵ PFU of SARS-CoV-2WA1-nLuc and followed by non-invasive BLI every 2 days from the start of infection till 8 dpi. (B) BLI images show nLuc signals in mice infected with SARS-CoV-2WA1-nLuc in ventral (v) and dorsal (d) view. (C,D) Non-invasive measurement of nLuc signal as flux (photons/sec) over time (E) The graph illustrates the changes in body weight over time for K18-hACE2 mice following infection. Each line represents an individual animal, with the initial weight set at 100%. (F) The plot displays Kaplan-Meier survival curves for the experiment described in (A). (G) The graph shows the viral load measurements in various organs at the time of necropsy, expressed as nLuc activity per milligram of tissue, using Vero-E6 cells as targets. (H,I) Changes in specific cytokine mRNA expression were measured in mouse brain and lung tissues following specified treatment protocols. These measurements were taken either at the time of death or at 16 dpi for surviving mice. The data were standardized against Gapdh mRNA from the same sample and from uninfected mice after necropsy in the experiments depicted in (GI). A statistical analysis was conducted for grouped data in (CE) and (GI), and a two-way ANOVA was conducted, followed by Tukey’s multiple comparison tests to assess significance. Statistical significance for the group’s comparisons to adjuvant are shown in black, with the CD4+ T-cells depleted group shown as magenta and with the CD8+ T-cells depleted group shown as blue. *, p < 0.05; **, p < 0.01; ****, p < 0.0001; ns, not significant; Mean values ± SD are depicted.
Figure 4
Figure 4
SMENWA1 Vaccine is Effective Against Delta and Provides Limited Cross-protection Against Beta VOC. (A) Experimental design for testing cross-protection efficacy of SMENWA1vaccine against Delta and Beta VOCs. The mice were challenged with 1 × 10⁵ PFU of Delta and Beta SARS-CoV-2 nLuc to SMENWA1 vaccinated mice. (B) The graph illustrates the changes in body weight over time for K18-hACE2 mice following infection. Each line represents an individual animal, with the initial weight set at 100%. (C,D) The plot displays Kaplan-Meier survival curves for the experiment described in (A). (E) The graph shows the viral load measurements in various organs at the time of necropsy, expressed as nLuc activity per milligram of tissue, using Vero-E6 cells as targets. (FG) Changes in specific cytokine mRNA expression levels were measured in mouse brain and lung tissues following specified treatment protocols. These measurements were taken either at the time of death or at 16 dpi for surviving mice. The data were standardized against Gapdh mRNA from the same sample and from uninfected mice after necropsy in the experiments depicted in (EG). (H) Plot showing live virus neutralizing IC50 (µL of serum) values in the sera from SMENWA1 vaccinated mice before challenge, (see scheme in (A), n = 4; each dot represents one mouse; 21 days post-vaccination) against WA1, Delta, and Beta, Omicron variants. Cross-reactive neutralization index (CRNI) values shown below the plot were calculated (see Section 2) by setting the homologous WA1 strain to 100. (E) Fold change in FcγR signaling measured using Jurkat NFAT-luciferase (JNL) cells expressing mFcγRIV, co-cultured with Vero E6 cells infected with the indicated SARS-CoV-2 variants and sera (IC50 equivalent) from SMENWA1-vaccinated mice before challenge (21 days post-vaccination). Data were normalized to luciferase activity measured in the absence of sera. To estimate the cross-reactive Fc-signaling index (CRFSI), the Fc-signaling activity measured using Vero E6 cells infected with the homologous WA1 strain was set to 100. A statistical analysis was conducted for grouped data in (B) and (EG), and a two-way ANOVA was conducted, followed by Tukey’s multiple comparison tests to assess significance. Statistical analysis for data in (H,I) employed the nonparametric Mann-Whitney test. Statistical significance for the group comparisons in (BG) to adjuvant-treated mice with Delta VOC-infected mice are shown in black, and adjuvant-treated mice with Beta VOC-infected mice is shown in grey. Statistical significance for the group comparisons in (HI) to WA1 are shown in black, and Delta VOC infected mice are shown in red. *, p < 0.05; **, p < 0.01; ***, p < 0.001; ****, p < 0.0001; ns, not significant; Mean values ± SD are depicted.
Figure 5
Figure 5
SMENOmicron Provides Weak Cross-protection Against Heterologous VOCs. (A) Experimental design for testing cross-protection efficacy of SMENOmicron vaccine against WA1, Delta, Beta, and Omicron VOCs. Indicated groups of mice (control and vaccinated) were challenged with 1 × 10⁵ PFU of SARS-CoV-2 nLuc variants (WA1, Delta, Beta, and Omicron) (B) The graph illustrates the changes in body weight (top panel) over time for K18-hACE2 mice following infection. Each line represents an individual animal, with the initial weight set at 100%, and the plot displays Kaplan-Meier survival curves for the experiment described in (A) is shown in (bottom panel). (C) The graph shows the viral load measurements in various organs at the time of necropsy, expressed as nLuc activity per milligram of tissue, using Vero-E6 cells as targets. (D) Plot showing neutralizing IC50 (µL of serum) values in the sera from SMENOmicron vaccinated mice harvested before challenge (see scheme in (A), n = 4, each dot represents one mouse; 21 days post-vaccination) against Omicron, WA1, Delta and Beta variants. Cross-reactive neutralization index (CRNI) values shown below the plot were calculated (see Section 2) by normalizing the homologous Omicron variant to 100. (E) Fold change in FcγR signaling measured using Jurkat NFAT-luciferase (JNL) cells expressing mFcγRIV, co-cultured with Vero E6 cells infected with the indicated SARS-CoV-2 variants and sera (IC50 equivalent) from SMENOmicron-vaccinated mice harvested before challenge at 21 days post-vaccination. Data were normalized to luciferase activity measured in the absence of sera. To estimate the cross-reactive Fc-signaling index (CRFSI), the Fc-signaling activity measured using Vero E6 cells infected with the homologous Omicron strain was set to 100. A statistical analysis of grouped data in (B,C) using a two-way ANOVA was conducted, followed by Tukey’s multiple comparison tests to assess significance. Statistical analysis for data in (D,E) employed the nonparametric Mann-Whitney test. Statistical significance for the group comparisons to adjuvant with each cohort is shown in black. Statistical significance for the group comparisons in (D,E) to Omicron is shown in black, WA1 is shown in red, and beta is shown in blue. *, p < 0.05; **, p < 0.01; ****, p < 0.0001; ***, p < 0.001; ns, not significant; Mean values ± SD are depicted.
Figure 6
Figure 6
SMENBeta Vaccination Confers Cross-protection Against Ancestral Strain and Heterologous VOCs. (A) Experimental design for testing protection of SMENBeta vaccine against nanoluc expressing Beta, WA1, Delta, and Omicron reporter VOCs. SMENBeta vaccinated K18-hACE2 mice (combined regimen; n = 4) were challenged intranasally with 1 × 10⁵ PFU of indicated SARS-CoV-2 variants and subjected to indicated multiparametric analyses to determine efficacy (B) The graph illustrates the changes in body weight (top panel) over time for K18-hACE2 mice following infection. Each line represents an individual animal, with the initial weight set at 100%, and the plot displays Kaplan-Meier survival curves for the experiment described in (A) is shown in (bottom panel). (C) The graph shows the viral load measurements in various organs at the time of necropsy, expressed as nLuc activity per milligram of tissue, using Vero-E6 cells as targets. (D) Plot showing live virus neutralizing IC50 (µL of serum) values in the sera from SMENBeta vaccinated mice harvested before challenge at 21 days after immunization (see scheme in (A) and Table 1, n = 4) against Beta, WA1, Delta, and Omicron variants. Cross-reactive neutralization index (CRNI) values shown below the plot were calculated (see Section 2) by normalizing the mean IC50 values in the sera harvested before the challenge at 21 days after immunization for the homologous Beta variant to 100. (E) Fold change in live virus FcγR signaling assay measured using Jurkat NFAT-luciferase (JNL) cells expressing mFcγRIV, co-cultured with Vero E6 cells infected with the indicated SARS-CoV-2 variants and sera (IC50 equivalent) from SMENBeta-vaccinated mice harvested before challenge at 21 days post-immunization. Data were normalized to luciferase activity measured in the absence of sera. To estimate the cross-reactive Fc-signaling index (CRFSI), the Fc-signaling activity measured using Vero E6 cells infected with the homologous Beta strain was set to 100. A statistical analysis of grouped data in (B,C) using a two-way ANOVA was conducted, followed by Tukey’s multiple comparison tests to assess significance. Statistical analysis for data in (D,E) employed the nonparametric Mann-Whitney test. Statistical significance for the group comparisons to adjuvant with each cohort is shown in black. Statistical significance for the group comparisons in (D,E) to beta are shown in black. *, p < 0.05; **, p < 0.01; ****, p < 0.0001; ***, p < 0.001; ns, not significant; Mean values ± SD are depicted.

Similar articles

Cited by

References

    1. Shang J., Ye G., Shi K., Wan Y., Luo C., Aihara H., Geng Q., Auerbach A., Li F. Structural basis of receptor recognition by SARS-CoV-2. Nature. 2020;581:221–224. doi: 10.1038/s41586-020-2179-y. - DOI - PMC - PubMed
    1. Jackson C.B., Farzan M., Chen B., Choe H. Mechanisms of SARS-CoV-2 entry into cells. Nat. Rev. Mol. Cell Biol. 2022;23:3–20. doi: 10.1038/s41580-021-00418-x. - DOI - PMC - PubMed
    1. Wrapp D., Wang N., Corbett K.S., Goldsmith J.A., Hsieh C.L., Abiona O., Graham B.S., McLellan J.S. Cryo-EM structure of the 2019-nCoV spike in the prefusion conformation. Science. 2020;367:1260–1263. doi: 10.1126/science.abb2507. - DOI - PMC - PubMed
    1. Walls A.C., Park Y.J., Tortorici M.A., Wall A., McGuire A.T., Veesler D. Structure, Function, and Antigenicity of the SARS-CoV-2 Spike Glycoprotein. Cell. 2020;181:281–292.e6. doi: 10.1016/j.cell.2020.02.058. - DOI - PMC - PubMed
    1. Wang Q., Zhang Y., Wu L., Niu S., Song C., Zhang Z., Lu G., Qiao C., Hu Y., Yuen K.Y., et al. Structural and Functional Basis of SARS-CoV-2 Entry by Using Human ACE2. Cell. 2020;181:894–904.e9. doi: 10.1016/j.cell.2020.03.045. - DOI - PMC - PubMed

LinkOut - more resources