. 2024 Sep 11;12(9):1040.
doi: 10.3390/vaccines12091040.

Changes in Phenotypic and Molecular Features of Naïve and Central Memory T Helper Cell Subsets following SARS-CoV-2 Vaccination

Affiliations

Changes in Phenotypic and Molecular Features of Naïve and Central Memory T Helper Cell Subsets following SARS-CoV-2 Vaccination

Mia Mosavie et al. Vaccines (Basel). .

Abstract

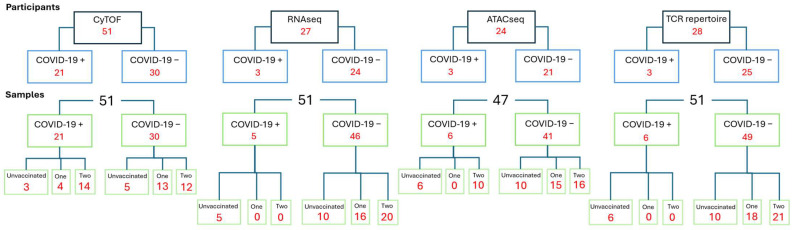
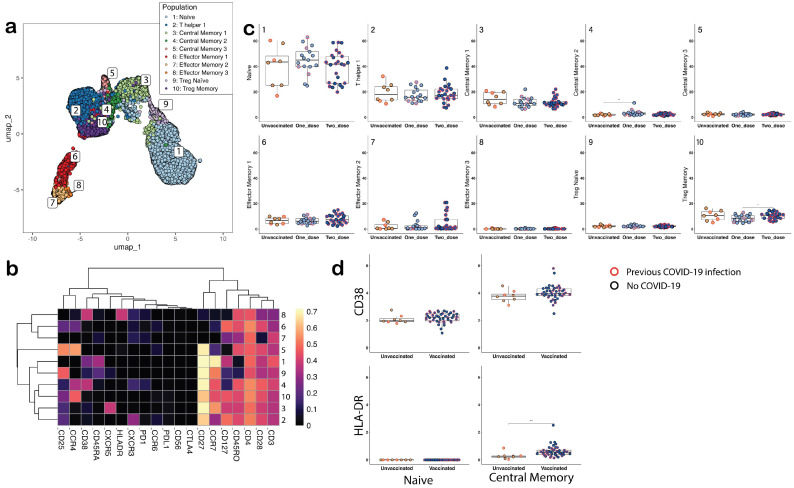
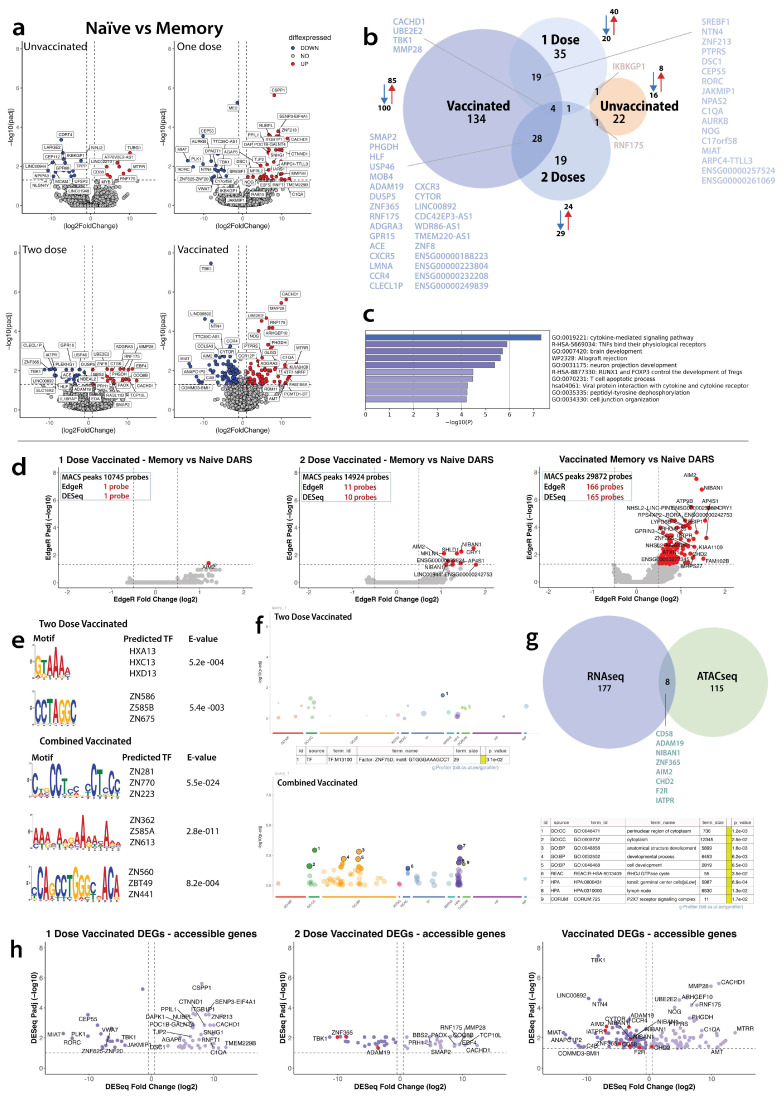
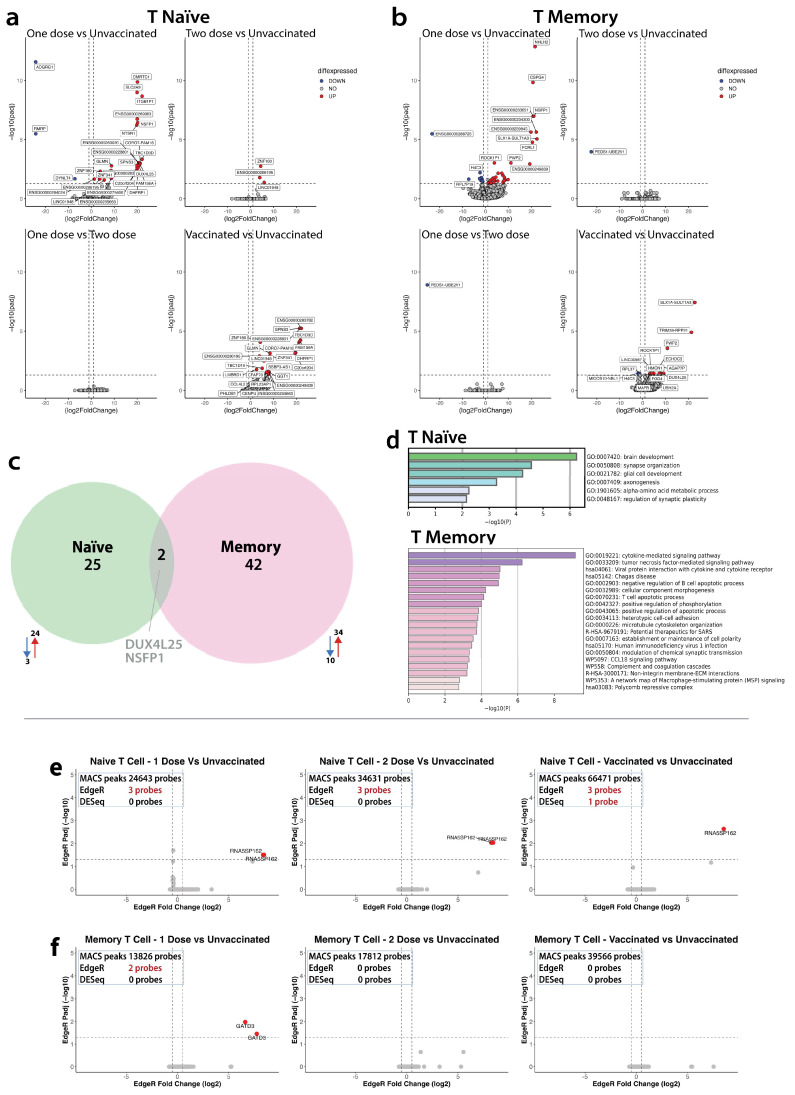
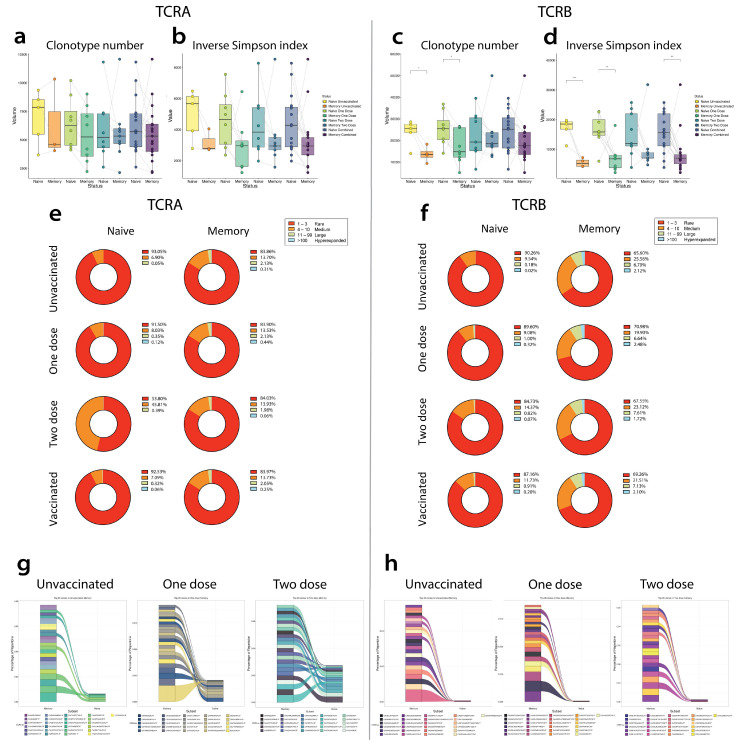
Molecular changes in lymphocytes following SARS-CoV-2 vaccination are incompletely understood. We hypothesized that studying the molecular (transcriptomic, epigenetic, and T cell receptor (TCR) repertoire) changes in CD4+ T cells following SARS-CoV-2 vaccination could inform protective mechanisms and refinement of future vaccines. We tested this hypothesis by reporting alterations in CD4+ T cell subsets and molecular features of CD4+ naïve and CD4+ central memory (CM) subsets between the unvaccinated and vaccinated groups. Compared with the unvaccinated, the vaccinated had higher HLA-DR expression in CD4+ T subsets, a greater number of differentially expressed genes (DEGs) that overlapped with key differentially accessible regions (DARs) along the chromatin linked to inflammasome activation, translation, regulation (of apoptosis, inflammation), and significant changes in clonal architecture beyond SARS-CoV-2 specificity. Several of these differences were more pronounced in the CD4+CM subset. Taken together, our observations imply that the COVID-19 vaccine exerts its protective effects via modulation of acute inflammation to SARS-CoV-2 challenge.

Keywords: CD4+ T helper cell; COVID-19; SARS-CoV-2; T cell receptor; epigenetics; repertoire; transcriptomics; vaccination.


Conflict of interest statement

LE reported receiving grants from the National Institute for Health Research and European Union Horizon 2020. MSH reports receiving a grant from the Chief Scientists Office, Scotland, for time-critical precision medicine in adult critically ill patients (TRAITS Programme—https://traits-trial.ed.ac.uk).

Figures

Figure 1
Figure 1
Flowchart of study. Number of participants in each experiment split by COVID-19 positive, below; number of samples within each experiment split by COVID-19 and by vaccination status.
Figure 2
Figure 2
Identification of immune cell subsets assessed by time of flight mass cytometry (cyTOF) and flow cytometry gating used for sorting naïve and memory subsets. The populations were grouped into unvaccinated, one-dose-vaccinated, and two-dose-vaccinated cohorts to assess changes with vaccination status. (a) UMAP of 10 CD4 T cell populations from individuals that were unvaccinated and vaccinated with the COVID-19 vaccine, clustered based on marker expression: 1: Naïve (CCR7+CD45RA+CD45ROCD38+CD25CCR4), 2: T helper 1 (CCR7lowCD45RACD45RO+CXCR3+CCR6), 3: Central memory 1 (CCR7+CD45RACD45RO+CCR4CD127+CXCR5+), 4: Central memory 2 (CCR7+CD45RACD45RO+CCR4+CD25lowCD38+PD1low), 5: Central memory 3 (CCR7lowCD45RACD45RO+CCR4+CD25+CD127), 6: Effector memory 1 (CCR7CD45RACD45RO+CCR4lowCD25lowCD127+), 7: Effector memory 2 (CCR7CD45RACD45ROlowCD28), 8: Activated Effector memory 3 (CCR7CD45RACD45RO+CD38+HLA-DR+), 9: Treg naive (CCR7+CD45RAlowCD45ROlowCD25+CD127low), 10: Treg memory (CCR7+CD45RACD45RO+CCR4+CD25+CD127+). Bold markers in the central memory and effector memory groups highlight the differences between each group. (b) Heatmap of scaled marker intensity used to define the subpopulations. (c) CD4+ T cell population grouped by vaccination status. (d) Differences in the mean metal intensity (MMI) of proteins involved in activation (HLA-DR and CD38) between unvaccinated and vaccinated individuals in the naïve and central memory CD4+ subpopulations. Individuals that reported a previous COVID-19 infection are highlighted with a red ring in (c,d). Statistical analysis was performed using a t test. *: p ≤ 0.05; **: p ≤ 0.01.
Figure 3
Figure 3
Transcriptomic and epigenetic differences between naïve CD4+ and central memory CD4+ subsets by vaccine status. (a) Volcano plots of differentially expressed genes (DEGs) between memory and naïve CD4 subsets. Donors were separated based on vaccination status and dosage. Upregulated genes (red) are defined as log2 fold change > 1 and adjusted p-value ≤ 0.05, and downregulated (blue) are defined as log2 fold change < −1 and adjusted p-value ≤ 0.05. (b) Venn diagram depicting the overlap of DEGs comparing CD4 naïve with CD4 memory in unvaccinated (orange) and vaccinated (blue) donors. Upregulated genes (red arrow) and down regulated genes (blue arrow) next to the corresponding group. (c) Top 10 enrichment GO terms (identified using Metascape) in the overall vaccinated group. (d) Volcano plots of the differentially accessible regions (DARs) of central memory CD4+ T cells compared with naïve. Each dot depicts a probe present within a region of a gene that has changed its accessibility using the statistical analysis; EdgeR and DESeq2. The red dot shows an increased accessible region (log2 fold change > 1 and adjusted p-value ≤ 0.05), there were no dots showing a decreased accessible region (log2 fold change < 1 and adjusted p-value ≤ 0.05). Central memory CD4+ T cells versus naïve T cells in (left to right) one-dose vaccinated individuals, two-dose vaccinated individuals, and combined-dose vaccinated individuals. (e) Motif analysis on DARs identified using EdgeR in two-dose vaccinated individuals and combined-vaccinated individuals when observing changes in naïve vs. memory T cells. Statistically significant predicted transcription factors have been listed for both groups in question. (f) Enriched gene ontology analysis (identified using gene profileR) of the DARs in the two-dose vaccinated and overall-vaccinated groups. (g) Venn diagram of overall vaccinated DEGs overlapping with the overall vaccinated genes identified in DARs. (h) Volcano plots of differentially expressed genes (DEGs) overlayed with DARs (left to right) in individuals that are vaccinated with one dose, vaccinated with two doses, and a combined both one dose and two doses. Each dot is a unique point along the transcriptome, filtered by an adjusted p-value ≤ 0.05 and labeled by overlapping genes The darker purple dots (left of the volcano plot) show reduced accessibility, the lighter purple dots show an increase accessibility. The red dots show the DEGs identified in (d).
Figure 4
Figure 4
Transcriptomic and epigenetic differences within naïve CD4+ and central memory CD4+ subsets by vaccine status. (a) Volcano plots of DEGs in naïve CD4+ subsets comparing vaccination dosages. Upregulated genes (red) are defined as log2 fold change > 1 and adjusted p-value ≤ 0.05, and downregulated genes (blue) are defined as log2 fold change < −1 and adjusted p-value ≤ 0.05. (b) Volcano plots of DEGs in memory CD4+ subsets comparing vaccination dosages. Upregulated genes (red) are defined as log2 fold change > 1 and adjusted p-value ≤ 0.05, and downregulated genes (blue) are defined as log2 fold change < −1 and adjusted p-value ≤ 0.05. (c) Venn diagram depicting the overlap of DEGs in response to 1 dose of vaccination compared with unvaccinated donors in CD4 naïve (green) and CD4 memory (pink). (d) Enriched GO terms (identified using Metascape) in naïve CD4+ (top, green) and memory CD4+ (bottom, pink) vaccinated donors. (e,f) Volcano plots of the differentially accessible regions (DARs) of central memory CD4+ T cells compared with naïve. Each dot depicts a probe present within a region of a gene that has changed its accessibility using the statistical analysis EdgeR and DESeq2. The red dot shows an increased accessible region (log2 fold change > 1 and adjusted p-value ≤ 0.05), and the blue dot shows a decreased accessible region (log2 fold change < 1 and adjusted p-value ≤ 0.05). (e) Naïve T cells only, (left to right) observing differences in unvaccinated vs. one-dose vaccinated individuals, unvaccinated vs. two-dose individuals, and unvaccinated vs. combined-dose vaccinated individuals. See Supplementary Figure S2. (f) Central memory T cells only, observing the differences in unvaccinated vs. one-dose vaccinated individuals, unvaccinated vs. two-dose individuals, and unvaccinated vs. combined-dose vaccinated individuals.
Figure 5
Figure 5
T cell repertoire changes in naïve and memory subsets. (a) Number of TCRα and (c) TCRβ clonotypes detected in naïve and memory T cells from unvaccinated, one-dose, two-dose, and overall vaccinated patients. (b) Diversity of TCRα and (d) TCRβ in naïve and memory T cells. (e) Average clone size was determined in naïve and memory subsets in unvaccinated, one dose, two doses, and overall vaccine in TCRα and (f) TCRβ chains. Clonal size was grouped by rare (1–3), medium (4–10), large (11–99), and hyperexpanded (>100). (g,h) Alluvian plot of the top 25 clones identified in the memory subset present in the naïve subset in the unvaccinated, one-dose, and two-dose vaccinated groups. See Supplementary Table S1.

Similar articles

References

    1. Barbier A.J., Jiang A.Y., Zhang P., Wooster R., Anderson D.G. The clinical progress of mRNA vaccines and immunotherapies. Nat. Biotechnol. 2022;40:840–854. doi: 10.1038/s41587-022-01294-2. - DOI - PubMed
    1. Chaudhary N., Weissman D., Whitehead K.A. mRNA vaccines for infectious diseases: Principles, delivery and clinical translation. Nat. Rev. Drug Discov. 2021;20:817–838. doi: 10.1038/s41573-021-00283-5. - DOI - PMC - PubMed
    1. Hou X., Zaks T., Langer R., Dong Y. Lipid nanoparticles for mRNA delivery. Nat. Rev. Mater. 2021;6:1078–1094. doi: 10.1038/s41578-021-00358-0. - DOI - PMC - PubMed
    1. Folegatti P.M., Ewer K.J., Aley P.K., Angus B., Becker S., Belij-Rammerstorfer S., Bellamy D., Bibi S., Bittaye M., Clutterbuck E.A., et al. Safety and immunogenicity of the ChAdOx1 nCoV-19 vaccine against SARS-CoV-2: A preliminary report of a phase 1/2, single-blind, randomised controlled trial. Lancet. 2020;396:467–478. doi: 10.1016/S0140-6736(20)31604-4. - DOI - PMC - PubMed
    1. Mascellino M.T., Di Timoteo F., De Angelis M., Oliva A. Overview of the Main Anti-SARS-CoV-2 Vaccines: Mechanism of Action, Efficacy and Safety. Infect. Drug Resist. 2021;14:3459–3476. doi: 10.2147/IDR.S315727. - DOI - PMC - PubMed

LinkOut - more resources