. 2024 Sep 13;12(9):1049.
doi: 10.3390/vaccines12091049.

Evaluating Nanoparticulate Vaccine Formulations for Effective Antigen Presentation and T-Cell Proliferation Using an In Vitro Overlay Assay

Affiliations

Evaluating Nanoparticulate Vaccine Formulations for Effective Antigen Presentation and T-Cell Proliferation Using an In Vitro Overlay Assay

Dedeepya Pasupuleti et al. Vaccines (Basel). .

Abstract

Inducing T lymphocyte (T-cell) activation and proliferation with specificity against a pathogen is crucial in vaccine formulation. Assessing vaccine candidates' ability to induce T-cell proliferation helps optimize formulation for its safety, immunogenicity, and efficacy. Our in-house vaccine candidates use microparticles (MPs) and nanoparticles (NPs) to enhance antigen stability and target delivery to antigen-presenting cells (APCs), providing improved immunogenicity. Typically, vaccine formulations are screened for safety and immunostimulatory effects using in vitro methods, but extensive animal testing is often required to assess immunogenic responses. We identified the need for a rapid, intermediate screening process to select promising candidates before advancing to expensive and time-consuming in vivo evaluations. In this study, an in vitro overlay assay system was demonstrated as an effective high-throughput preclinical testing method to evaluate the immunogenic properties of early-stage vaccine formulations. The overlay assay's effectiveness in testing particulate vaccine candidates for immunogenic responses has been evaluated by optimizing the carboxyfluorescein succinimidyl ester (CFSE) T-cell proliferation assay. DCs were overlaid with T-cells, allowing vaccine-stimulated DCs to present antigens to CFSE-stained T-cells. T-cell proliferation was quantified using flow cytometry on days 0, 1, 2, 4, and 6 upon successful antigen presentation. The assay was tested with nanoparticulate vaccine formulations targeting Neisseria gonorrhoeae (CDC F62, FA19, FA1090), measles, H1N1 flu prototype, canine coronavirus, and Zika, with adjuvants including Alhydrogel® (Alum) and AddaVax™. The assay revealed robust T-cell proliferation in the vaccine treatment groups, with variations between bacterial and viral vaccine candidates. A dose-dependent study indicated immune stimulation varied with antigen dose. These findings highlight the assay's potential to differentiate and quantify effective antigen presentation, providing valuable insights for developing and optimizing vaccine formulations.

Keywords: CFSE; T-cell proliferation; antigen presentation; antigen-presenting cell; cell-to-cell contact; dendritic cell; in vitro vaccine screening; overlay assay.


Conflict of interest statement

The authors declare no conflicts of interest. The funders had no role in the design of this study, in the collection, analysis, or interpretation of data, in the writing of the manuscript, or in the decision to publish the results.

Figures

Figure 1
Figure 1
Live cell imaging of DAPI-stained naïve T-cells interacting with activated dendritic cells. (A): Overview of the culture showing DAPI-stained T-cells (blue) interacting with activated dendritic cells that are stimulated with ICG-coated BSA MPs (green) across the field. Scale bar: 100 µm. (B): Close-up view highlighting a DAPI-stained T-cell engaging with a dendritic cell, indicated by the black arrow. Scale bar: 100 µm. (C): Magnified image displaying multiple T-cells in the process of interacting with dendritic cells. Black arrows indicate T-cells undergoing division. Scale bar: 100 µm. (D): Detailed image of T-cells post-division, as indicated by black arrows, continuing their interaction with dendritic cells. Scale bar: 100 µm.
Figure 2
Figure 2
Representative flow cytometry data of T-lymphocyte profiling. (A). Gating strategy for separating T lymphocytes from the forward scattering vs. side scattering plot. T-cells were gated, capturing 16.5% of the total population of the scatter plot. (B). Singlets are shown on the forward scattering a vs. forward scattering height plot from the T lymphocyte gating. (C). Histograms gated 1, 2, 3, and 4 according to daughter T-cell proliferation over time intervals: 0–1, 1–2, 2–4, and 4–6 days, respectively. Gates were established in accordance with the proliferation pattern of bacterial and viral-based vaccine candidates. Gates were left unchanged for the corresponding blank MP/NP groups.
Figure 3
Figure 3
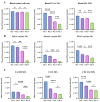
Quantitative comparisons of CFSE (FITC-A filter) expressions due to T-cells proliferated as days passed. CFSE is expressed by the proliferating T-cells in response to antigen presentation by the DCs upon stimulation by various treatment groups. (A). Comparison of all blank groups involved in the experiment, including blank CFSE-stained T-cells only, blank BSA MPs, and blank PLGA NPs. (B). comparison of all viral antigen-based vaccine candidates. (C). comparison of all bacterial antigen-based vaccine candidates. All treatments are at 200 µg per well dose. Data are expressed as mean ± SEM, ordinary one-way ANOVA test, post-hoc Tukey’s multiple comparison test. ns, non-significant, * p ≤ 0.05, ** p ≤ 0.01, *** p ≤ 0.001, **** p ≤ 0.0001.
Figure 4
Figure 4
Dose-dependent study results quantifying T-cell proliferation against various concentrations of vaccine candidates. (A). T-cell proliferation analysis measured on days 1, 2, 4, and 6 when treated with vaccine candidate against N. gonorrhoeae strain FA1090 at concentrations of 200 µg, 160 µg, 120 µg, 80 µg, and 40 µg vaccine MPs per well. (B). T-cell proliferation analysis was measured on days 1, 2, 4, and 6 when treated with a vaccine candidate against the measles virus at concentrations of 200 µg, 160 µg, 120 µg, 80 µg, and 40 µg vaccine NPs per well. (C,D). T-cell proliferation trends quantified in response to H1N1 virus particle vaccine candidate and N. gonorrhoeae strain CDC F62 bacterial particle vaccine candidates on day 6. Both were tested at concentrations of 200 µg, 160 µg, 120 µg, 80 µg, and 40 µg per well on day 6. Data are expressed as mean ± SEM, one-way ANOVA, post hoc Tukey’s multiple comparisons test; ns, non-significant, * p ≤ 0.05, ** p ≤ 0.01, *** p ≤ 0.001, **** p ≤ 0.0001.

Similar articles

References

    1. Turner S.J., Bennett T.J., La Gruta N.L. CD8 + T-Cell Memory: The Why, the When, and the How. Cold Spring Harb. Perspect. Biol. 2021;13:a038661. doi: 10.1101/cshperspect.a038661. - DOI - PMC - PubMed
    1. Koh C.-H., Lee S., Kwak M., Kim B.-S., Chung Y. CD8 T-Cell Subsets: Heterogeneity, Functions, and Therapeutic Potential. Exp. Mol. Med. 2023;55:2287–2299. doi: 10.1038/s12276-023-01105-x. - DOI - PMC - PubMed
    1. Soerens A.G., Künzli M., Quarnstrom C.F., Scott M.C., Swanson L., Locquiao J., Ghoneim H.E., Zehn D., Youngblood B., Vezys V., et al. Functional T Cells Are Capable of Supernumerary Cell Division and Longevity. Nature. 2023;614:762–766. doi: 10.1038/s41586-022-05626-9. - DOI - PMC - PubMed
    1. Ura T., Takeuchi M., Kawagoe T., Mizuki N., Okuda K., Shimada M. Current Vaccine Platforms in Enhancing T-Cell Response. Vaccines. 2022;10:1367. doi: 10.3390/vaccines10081367. - DOI - PMC - PubMed
    1. Dhawan M., Rabaan A.A., Fawarah M.M.A., Almuthree S.A., Alsubki R.A., Alfaraj A.H., Mashraqi M.M., Alshamrani S.A., Abduljabbar W.A., Alwashmi A.S.S., et al. Updated Insights into the T Cell-Mediated Immune Response against SARS-CoV-2: A Step towards Efficient and Reliable Vaccines. Vaccines. 2023;11:101. doi: 10.3390/vaccines11010101. - DOI - PMC - PubMed

LinkOut - more resources