. 2024 Sep 18;12(9):1068.
doi: 10.3390/vaccines12091068.

Adjuvant Use of the Invariant-Natural-Killer-T-Cell Agonist α-Galactosylceramide Leads to Vaccine-Associated Enhanced Respiratory Disease in Influenza-Vaccinated Pigs

Affiliations

Adjuvant Use of the Invariant-Natural-Killer-T-Cell Agonist α-Galactosylceramide Leads to Vaccine-Associated Enhanced Respiratory Disease in Influenza-Vaccinated Pigs

Bianca L Artiaga et al. Vaccines (Basel). .

Abstract

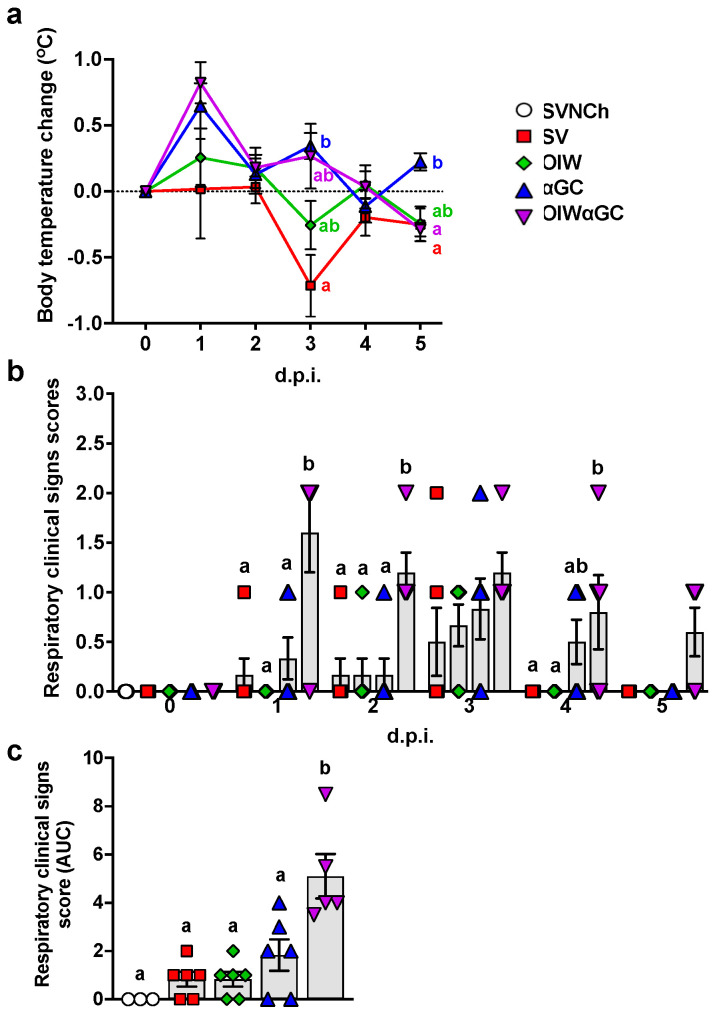
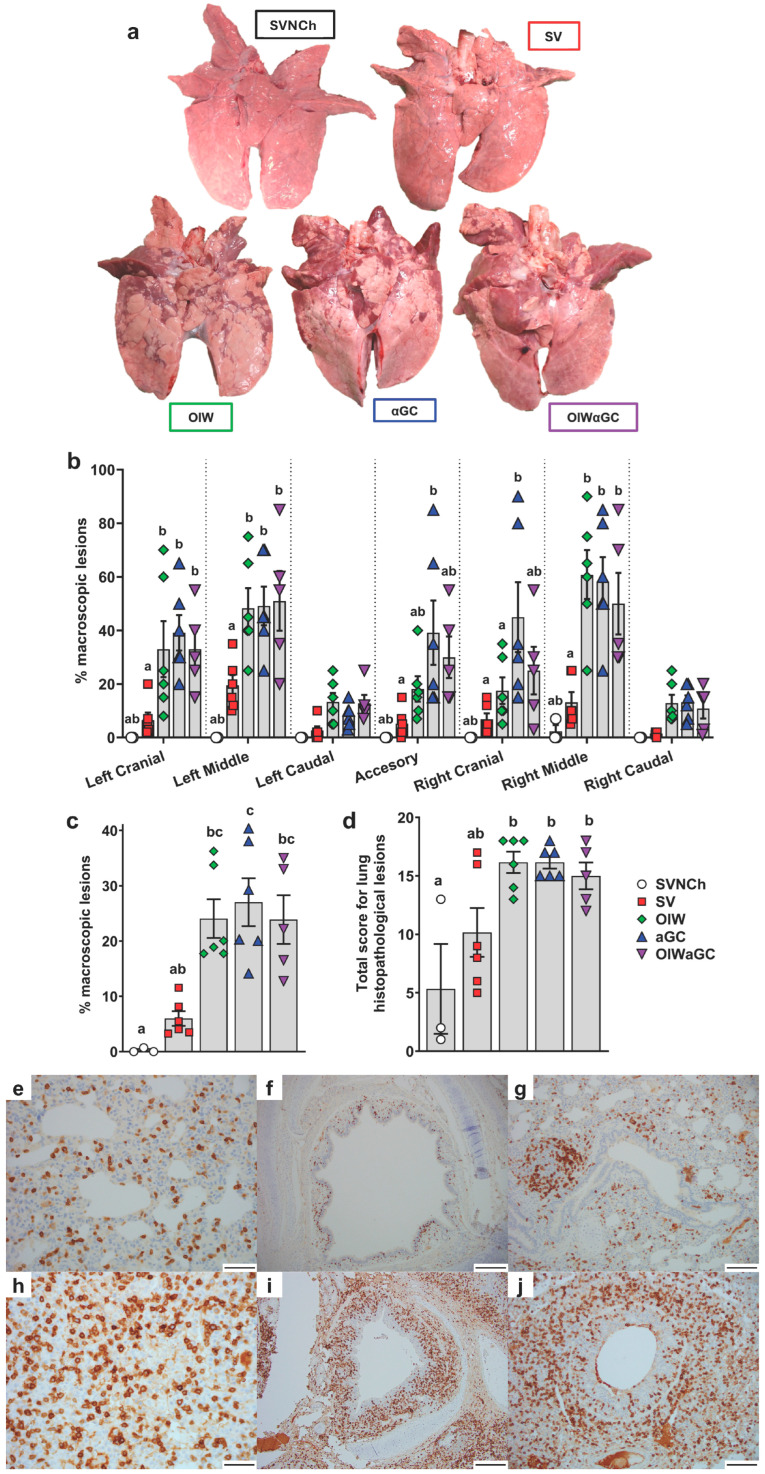
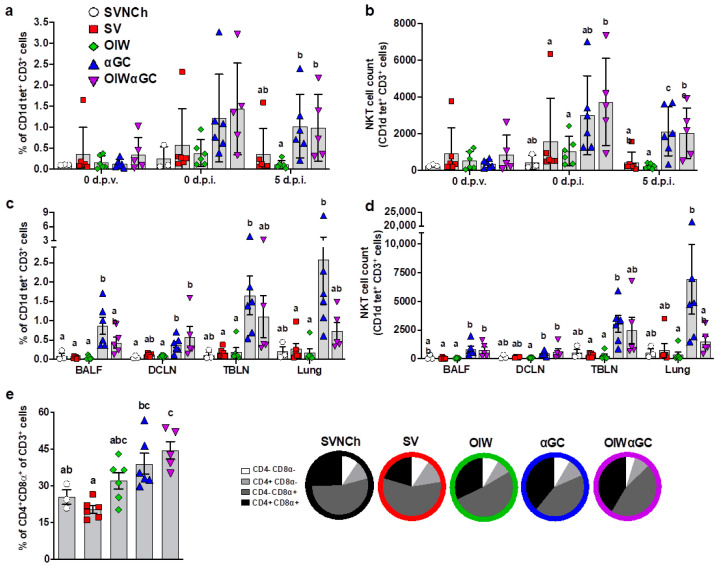
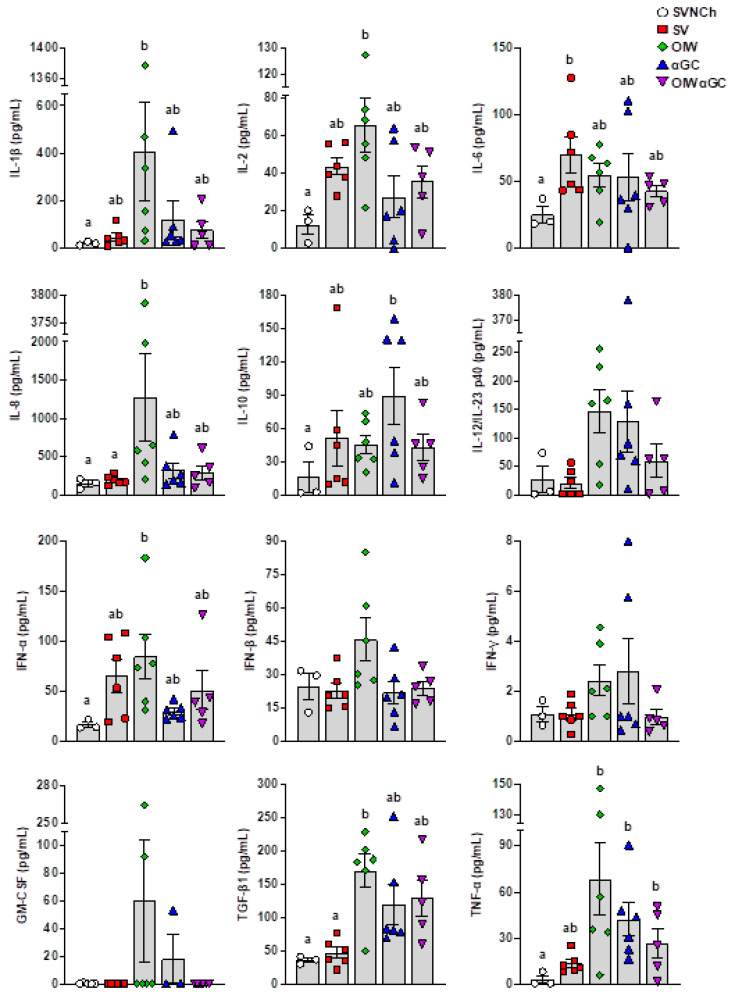
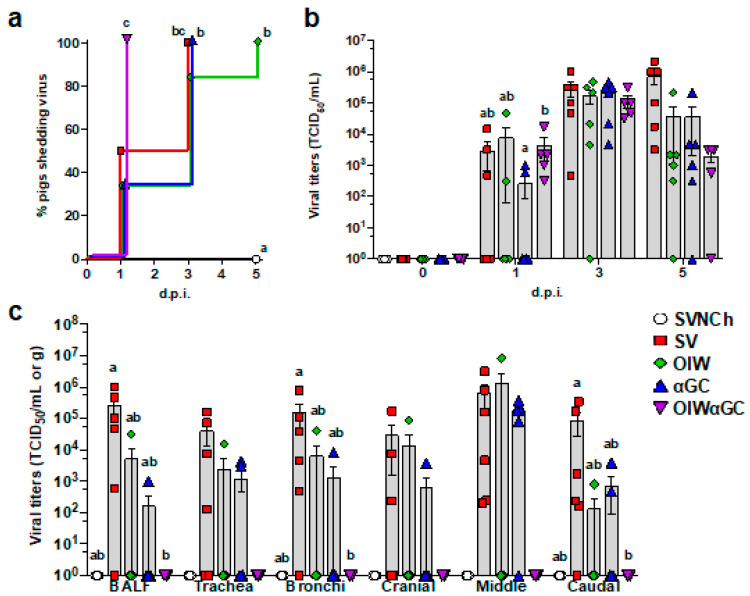
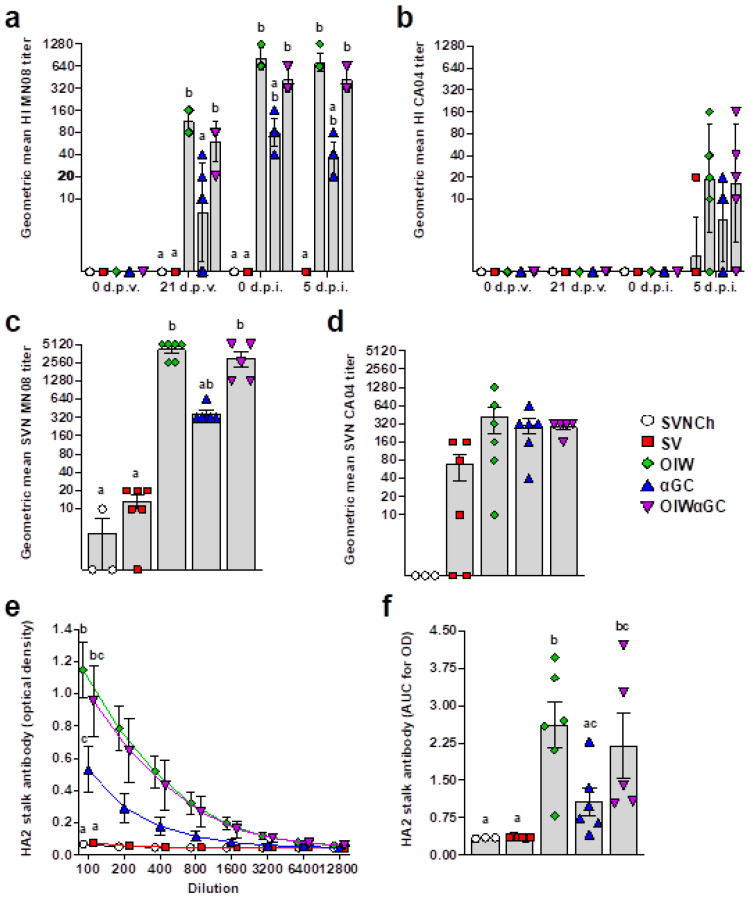
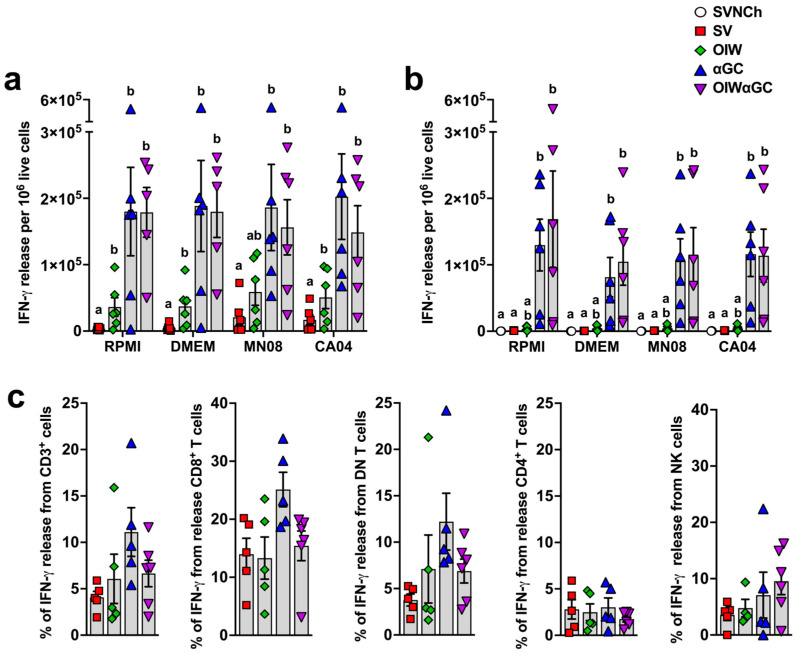
Invariant natural killer T (iNKT) cells are glycolipid-reactive T cells with potent immunoregulatory properties. iNKT cells activated with the marine-sponge-derived glycolipid, α-galactosylceramide (αGC), provide a universal source of T-cell help that has shown considerable promise for a wide array of therapeutic applications. This includes harnessing iNKT-cell-mediated immune responses to adjuvant whole inactivated influenza virus (WIV) vaccines. An important concern with WIV vaccines is that under certain circumstances, they are capable of triggering vaccine-associated enhanced respiratory disease (VAERD). This immunopathological phenomenon can arise after immunization with an oil-in-water (OIW) adjuvanted WIV vaccine, followed by infection with a hemagglutinin and neuraminidase mismatched challenge virus. This elicits antibodies (Abs) that bind immunodominant epitopes in the HA2 region of the heterologous virus, which purportedly causes enhanced virus fusion activity to the host cell and increased infection. Here, we show that αGC can induce severe VAERD in pigs. However, instead of stimulating high concentrations of HA2 Abs, αGC elicits high concentrations of interferon (IFN)-γ-secreting cells both in the lungs and systemically. Additionally, we found that VAERD mediated by iNKT cells results in distinct cytokine profiles and altered adaptation of the challenge virus following infection compared to an OIW adjuvant. Overall, these results provide a cautionary note about considering the formulation of WIV vaccines with iNKT-cell agonists as a potential strategy to modulate antigen-specific immunity.

Keywords: adjuvants; influenza A virus; natural killer T cell; swine; vaccine; vaccine-associated enhanced respiratory disease; α-galactosylceramide.


Conflict of interest statement

The JR laboratory received support from Tonix Pharmaceuticals, Genus plc, Xing Technologies, and Zoetis, outside of the reported work. JR is an inventor on patents and patent applications on the use of antivirals and vaccines for the treatment and prevention of viral infections, owned by Kansas State University. The Icahn School of Medicine at Mount Sinai has filed patent applications relating to SARS-CoV-2 serological assays, NDV-based SARS-CoV-2 vaccines, influenza virus vaccines, and influenza virus therapeutics, which list FK as co-inventor. Mount Sinai has spun out a company, Kantaro, to market serological tests for SARS-CoV-2 and another company, CastleVax, to develop SARS-CoV-2 vaccines. FK is co-founder and scientific advisory board member of CastleVax. FK has consulted for Merck, Curevac, Seqirus, and Pfizer and is currently consulting for 3rd Rock Ventures, GSK, Gritstone, and Avimex. The Krammer laboratory is collaborating with Dynavax on influenza vaccine development. The other authors declare no competing interests.

Figures

Figure 1
Figure 1
Clinical signs post-infection. (a) Change in body temperature during the challenge period based on body temperature at 0 d.p.i. (b,c) Respiratory clinical scores observed during the challenge period. Pigs were scored each day after infection according to the Materials and Methods (b). Area under the curve (AUC) calculated based on respiratory clinical scores over the entire challenge period (c). Differences between treatment groups were determined by Tukey’s (a,c) or Dunn’s (b) multiple-comparisons tests. A statistically significant difference between two groups is indicated by different letters. Data are presented as the mean ± SEM. Symbols represent treatment groups (a) or individual pigs (b,c). SVNCh—sham vaccinated and not challenged, SV—sham vaccinated and challenged with CA04, αGC—vaccinated with MN08 mixed with 100 μg/kg of αGC and challenged with CA04, OIW—vaccinated with MN08 and the oil-in-water adjuvant Emulsigen-D and challenged with CA04, OIWαGC—vaccinated with a combination of OIW and αGC and challenged with CA04.
Figure 2
Figure 2
Macroscopic and microscopic lung lesion scores and CD3+ T-cell localization at 5 d.p.i. (a) Representative pictures of macroscopic lesions per group. (b,c) Macroscopic lesions assessed in (b) individual lung lobes and (c) total lungs according to the relative volume of each lobe. (d) Histopathology scores assessed by H&E staining according to the Materials and Methods. Differences between treatments were analyzed by Tukey’s (b,d) or Dunn’s (c) multiple-comparisons test. A statistically significant difference between two groups is indicated by different letters. Data are presented as the mean ± SEM. Symbols represent individual pigs. (ej) Histopathology assessed by CD3 staining by IHC. (eg) Images from SVNCh pigs of transverse sections of CD3-stained alveoli at 40× magnification (e), bronchus at 10x (f), and bronchiole with bronchus-associated lymphoid tissue at 20× (g). (hj) Images from OIW pigs of transverse sections of CD3-stained alveoli at 40× with high-density intra-epithelial CD3+ T cells (h), bronchus at 10× with markedly thickened walls containing high-density aggregates of CD3+ T cells (i), and bronchiole at 20× showing high-density CD3+ cells in the bronchiolar wall within hyperplastic cuboidal bronchiolar epithelial cells (j). Scale bars indicate 50 μm (e,h), 200 μm (f,i), and 100 μm (g,j). SVNCh—sham vaccinated and not challenged, SV—sham vaccinated and challenged with CA04, αGC—vaccinated with MN08 mixed with 100 μg/kg of αGC and challenged with CA04, OIW—vaccinated with MN08 and the oil-in-water adjuvant Emulsigen-D and challenged with CA04, OIWαGC—vaccinated with a combination of OIW and αGC and challenged with CA04.
Figure 3
Figure 3
Immune cell characterization. (a,b) iNKT cells as a proportion of peripheral blood CD3+ lymphocytes (a) and the total number of iNKT cells in 106 live cells at 0 d.p.v. and 0 and 5 d.p.i. (b). (c,d) iNKT cells in BALF, DCLN, TBLN, and lung tissue at 5 d.p.i. as a proportion of CD3+ lymphocytes (c) and the total number of iNKT cells (d). (e) Double-positive CD4+CD8α+ T cells as a proportion of total CD3+ cells in lung tissue at 5 d.p.i. Differences between treatment groups were determined by Tukey’s (a,b,e) or Dunn’s (c,d) multiple-comparisons test. A statistically significant difference between two groups is indicated by different letters. Data are presented as the mean ± SEM. Symbols represent individual pigs. SVNCh—sham vaccinated and not challenged, SV—sham vaccinated and challenged with CA04, αGC—vaccinated with MN08 mixed with 100 μg/kg of αGC and challenged with CA04, OIW—vaccinated with MN08 and the oil-in-water adjuvant Emulsigen-D and challenged with CA04, OIWαGC—vaccinated with a combination of OIW and αGC and challenged with CA04.
Figure 4
Figure 4
Cytokine concentrations in bronchiolar lavage fluid collected at 5 d.p.i. Differences between treatment groups were determined by Tukey’s multiple-comparisons test. A statistically significant difference between two groups is indicated by different letters. Data are presented as the mean ± SEM. Symbols represent individual pigs. SVNCh—sham vaccinated and not challenged, SV—sham vaccinated and challenged with CA04, αGC—vaccinated with MN08 mixed with 100 μg/kg of αGC and challenged with CA04, OIW—vaccinated with MN08 and the oil-in-water adjuvant Emulsigen-D and challenged with CA04, OIWαGC—vaccinated with a combination of OIW and αGC and challenged with CA04.
Figure 5
Figure 5
Viral titers in nasal swabs and respiratory tissues. (a) Percentage of pigs that have become positive for virus shedding in nasal swabs collected at 0, 1, 3, and 5 d.p.i. (b) Virus titers in nasal swabs after challenge. (c) Virus titers in BALF and homogenized respiratory tissues at 5 d.p.i. Data are presented as TCID50/mL for nasal swabs and BALF and TCID50/g for respiratory tissues. Differences between treatments were analyzed by the Mantel–Cox log-rank test (a), Tukey’s multiple-comparisons test (b), or Dunn’s multiple-comparisons test (c). A statistically significant difference between two groups is indicated by different letters. Data are presented as the mean ± SEM. Symbols represent treatment groups (a) or individual pigs (b,c). SVNCh—sham vaccinated and not challenged, SV—sham vaccinated and challenged with CA04, αGC—vaccinated with MN08 mixed with 100 μg/kg of αGC and challenged with CA04, OIW—vaccinated with MN08 and the oil-in-water adjuvant Emulsigen-D and challenged with CA04, OIWαGC—vaccinated with combination of OIW and αGC and challenged with CA04.
Figure 6
Figure 6
Virus-specific Ab titers. (a,b) Geometric mean of hemagglutination inhibition titers against H1N2 MN08 (a) and H1N1 CA04 (b). (c,d) Serum virus neutralization Ab titers against H1N2 MN08 (c) and H1N1 CA04 (d). (e,f) Ab titers against HA2 stalk of H1 influenza strains detected by ELISA at 5 d.p.i., represented as optical density by serum dilution (e) and area under the curve for optical density by dilution (f). Differences between treatments were analyzed using Tukey’s (a,f) or Dunn’s (be) multiple-comparisons test. A statistically significant difference between two groups is indicated by different letters. Data are presented as the geometric mean (ad) or mean ± SEM (e,f). Symbols represent individual pigs (ad,f) or treatment groups (e). SVNCh—sham vaccinated and not challenged, SV—sham vaccinated and challenged with CA04, αGC—vaccinated with MN08 mixed with 100 μg/kg of αGC and challenged with CA04, OIW—vaccinated with MN08 and the oil-in-water adjuvant Emulsigen-D and challenged with CA04, OIWαGC—vaccinated with a combination of OIW and αGC and challenged with CA04.
Figure 7
Figure 7
Cellular responses measured by IFN-γ production. (a,b) IFN-γ production by PBMC (a) or by lung leukocytes collected at 5 d.p.i. (b) after 48 h incubation with RPMI, DMEM, or 0.1 MOI of MN08 or CA04. Results represent IFN-γ release per 1 × 10⁵ live cells after subtracting unstimulated wells. (c) Proportion of T cells and NK cells positive for IFN-γ in TBLN. TBLN from 5 d.p.i. where incubated for 5 h with or without phorbol myristate acetate (PMA) and ionomycin, membrane labeled with Abs against CD3, CD4, and CD8α, fixed and permeabilized, and intracellularly stained for IFN-γ. Data are presented as the mean ± SEM. Symbols represent individual pigs. SVNCh—sham vaccinated and not challenged, SV—sham vaccinated and challenged with CA04, αGC—vaccinated with MN08 mixed with 100 μg/kg of αGC and challenged with CA04, OIW—vaccinated with MN08 and the oil-in-water adjuvant Emulsigen-D and challenged with CA04, OIWαGC—vaccinated with a combination of OIW and αGC and challenged with CA04.
Figure 8
Figure 8
Nonsynonymous single-nucleotide variances detected in nasal swab samples collected at 5 d.p.i. (a) Total count of nonsynonymous SNVs per animal; (b) nonsynonymous SNVs located within epitopes of all CA04 proteins or (c) within HA and NA epitopes specifically. Differences between treatments were analyzed by Tukey’s multiple-comparisons test. Data are presented as the mean ± SEM. Symbols represent individual pigs. SVNCh—sham vaccinated and not challenged, SV—sham vaccinated and challenged with CA04, αGC—vaccinated with MN08 mixed with 100 μg/kg of αGC and challenged with CA04, OIW—vaccinated with MN08 and the oil-in-water adjuvant Emulsigen-D and challenged with CA04, OIWαGC—vaccinated with a combination of OIW and αGC and challenged with CA04.

Similar articles

References

    1. Taylor A., Foo S.S., Bruzzone R., Vu Dinh L., King N.J., Mahalingam S. Fc receptors in antibody-dependent enhancement of viral infections. Immunol. Rev. 2015;268:340–364. doi: 10.1111/imr.12367. - DOI - PMC - PubMed
    1. Takada A., Kawaoka Y. Antibody-dependent enhancement of viral infection: Molecular mechanisms and in vivo implications. Rev. Med. Virol. 2003;13:387–398. doi: 10.1002/rmv.405. - DOI - PubMed
    1. Smatti M.K., Al Thani A.A., Yassine H.M. Viral-Induced Enhanced Disease Illness. Front. Microbiol. 2018;9:2991. doi: 10.3389/fmicb.2018.02991. - DOI - PMC - PubMed
    1. Kobinger G.P., Meunier I., Patel A., Pillet S., Gren J., Stebner S., Leung A., Neufeld J.L., Kobasa D., von Messling V. Assessment of the efficacy of commercially available and candidate vaccines against a pandemic H1N1 2009 virus. J. Infect. Dis. 2010;201:1000–1006. doi: 10.1086/651171. - DOI - PMC - PubMed
    1. Vincent A.L., Lager K.M., Janke B.H., Gramer M.R., Richt J.A. Failure of protection and enhanced pneumonia with a US H1N2 swine influenza virus in pigs vaccinated with an inactivated classical swine H1N1 vaccine. Vet. Microbiol. 2008;126:310–323. doi: 10.1016/j.vetmic.2007.07.011. - DOI - PubMed

LinkOut - more resources