. 2024 Nov;44(11):1350-1373.
doi: 10.1002/cac2.12609. Epub 2024 Sep 28.

Yap methylation-induced FGL1 expression suppresses anti-tumor immunity and promotes tumor progression in KRAS-driven lung adenocarcinoma

Affiliations

Yap methylation-induced FGL1 expression suppresses anti-tumor immunity and promotes tumor progression in KRAS-driven lung adenocarcinoma

Ji Jiang et al. Cancer Commun (Lond). 2024 Nov.

Abstract

Background: Despite significant strides in lung cancer immunotherapy, the response rates for Kirsten rat sarcoma viral oncogene homolog (KRAS)-driven lung adenocarcinoma (LUAD) patients remain limited. Fibrinogen-like protein 1 (FGL1) is a newly identified immune checkpoint target, and the study of related resistance mechanisms is crucial for improving the treatment outcomes of LUAD patients. This study aimed to elucidate the potential mechanism by which FGL1 regulates the tumor microenvironment in KRAS-mutated cancer.

Methods: The expression levels of FGL1 and SET1 histone methyltransferase (SET1A) in lung cancer were assessed using public databases and clinical samples. Lentiviruses were constructed for transduction to overexpress or silence FGL1 in lung cancer cells and mouse models. The effects of FGL1 and Yes-associated protein (Yap) on the immunoreactivity of cytotoxic T cells in tumor tissues were evaluated using immunofluorescence staining and flow cytometry. Chromatin immunoprecipitation and dual luciferase reporter assays were used to study the SET1A-directed transcriptional program.

Results: Upregulation of FGL1 expression in KRAS-mutated cancer was inversely correlated with the infiltration of CD8+ T cells. Mechanistically, KRAS activated extracellular signal-regulated kinase 1/2 (ERK1/2), which subsequently phosphorylated SET1A and increased its stability and nuclear localization. SET1A-mediated methylation of Yap led to Yap sequestration in the nucleus, thereby promoting Yap-induced transcription of FGL1 and immune evasion in KRAS-driven LUAD. Notably, dual blockade of programmed cell death-1 (PD-1) and FGL1 further increased the therapeutic efficacy of anti-PD-1 immunotherapy in LUAD patients.

Conclusion: FGL1 could be used as a diagnostic biomarker of KRAS-mutated lung cancer, and targeting the Yap-FGL1 axis could increase the efficacy of anti-PD-1 immunotherapy.

Keywords: FGL1; KRAS‐driven; SET1A; Yap; immune evasion; lung adenocarcinoma; methylation.


Conflict of interest statement

The authors declare no competing interest.

Figures

FIGURE 1
FIGURE 1
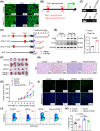
Elevated expression of FGL1 accelerates the progression of KRAS‐driven cancer. (A) Volcano plot illustrates significantly upregulated (red) or downregulated (blue) transcripts in Kras G12D mutant mouse lung cancer models compared to WT mice from RNA‐seq data. Thresholds set at P value < 0.01 (dotted line at ‐log10 (P value = 2) and fold change > 2 (dotted line at log2 fold change = ±1). (B) mRNA expression variation of FGL1 from RNA‐seq of lung tissues in SPC‐c‐raf transgenic mice. Unlesion: transgenic but no lesion, Lesion: transgenic proliferative lesion with dysplasia. (C) RT‐qPCR quantification of FGL1, PD‐1, and CD112 in Kras LSL‐G12D lung cancer mouse models (n = 5 mice per group). (D) IHC detection of FGL1 in Kras LSL‐G12D lung cancer samples (n = 5 mice per group). (E) Western blotting assay was used to detect FGL1, PD‐1, and CD112 in Kras LSL‐G12D lung cancer tissues versus controls (n = 3 mice per group). (F) Western blotting analysis of FGL1, p‐ERK1/2, and ERK1/2 post‐KRAS G12V overexpression in NCI‐H1299 cells (n = 3 wells per group). (G) HE staining coupled with IHC to assess FGL1 expression in human lung cancer tissues and adjacent normal tissues (n = 5 patients per group). (H) The heat map shows the mRNA expression of FGL1 in KRAS‐mutated LUAD cancer tissue samples (n = 16) and KRAS non‐mutant LUAD cancer tissue samples (n = 29). KRAS+: KRAS‐mutated LUAD cancer tissue samples, KRAS‐: KRAS non‐mutant LUAD cancer tissue samples. (I) The survival rate graph with the blue curve indicates patients with low FGL1 expression patients and the red curve indicates patients with high FGL1 expression. The disease‐free survival from TCGA lung cancer was obtained from the GEPIA database. (J) Imaging demonstrated lung cancer progression post‐FGL1 silencing by adeno‐associated virus in Kras LSL‐G12DSftpc‐Cre models. (K) Survival rate comparison of mice post‐lung cancer in AAV‐shControl vs. AAV‐shFGL1 (n = 9 mice per group). (L) IHC comparison of FGL1 and ki67 expressions in AAV‐shControl and AAV‐shFGL1 mice (n = 5 mice per group). (M) Co‐culture of KRAS G12V‐overexpressing NCI‐H1299 cells with CD8+ T cells revealed KRAS G12V overexpression suppressed apoptosis per FCM (n = 5 wells per group). Bar graphs represent mean ± SD. The symbol *** indicates P < 0.001. Abbreviations: DMSO, dimethyl sulfoxide; ERK1/2, extracellular regulated kinase 1/2; FCM, Flow cytometry; FGL1, fibrinogen‐like protein 1; HE, Hematoxylin and eosin; IF, Immunofluorescence staining; IHC, immunohistochemistry; KRAS, Kirsten rat sarcoma viral oncogene homolog; oe, overexpression; PD‐1, programmed cell death‐1; RT‐qPCR, Quantitative Real‐Time quantitative PCR; SD: Standard Deviation; sh, Short hairpin.
FIGURE 2
FIGURE 2
FGL1 attenuates CD8+ T cell‐mediated antitumor immunity. (A) Western blotting assessment of FGL1 expression post‐FGL1 silencing in LLC cells (n = 3 wells per group). (B) Depiction of a subcutaneous transplant tumor model using LLC cells, highlighting significant tumor growth inhibition post‐FGL1 silencing (n = 7 mice per group). (C) Tumor volume comparison between FGL1‐silenced and control groups. (D) IHC reveals the influence of FGL1 silencing on ki67 expression within tumors (n = 5 mice per group). (E) IF illustrates CD8+ T‐cell (green) distribution in tumors post‐FGL1 silencing (n = 5 mice per group). (F) FCM indicates increased proportions of CD8+ T cells expressing IFN‐γ, TNF‐α and Perforin in tumor tissues after FGL1 silencing (n = 5 mice per group). (G) Statistical evaluation of CD8+ T‐cell expression levels of IFN‐γ, TNF‐α, and Perforin in tumor tissues post‐FGL1 silencing (n = 5 mice per group). (H‐I) Examination of the influence of stable FGL1 silencing on a mouse lung metastasis model via tail vein injection of LLC cells. (J) Following FGL1 overexpression and silencing in A549 cells co‐cultured with PBMCs, Western blotting measures GZMB and Perforin expression shifts (n = 3 independent experiments). (K‐L) A549 cells, post FGL1 modulation, when co‐cultured with CD8+ T cells, showed apoptotic rate variations, analyzed via FCM (n = 5 wells per group). Bar graphs represent mean ± SD. The symbol *** indicates P < 0.001. Abbreviations: DAPI, 4',6‐diamidino‐2‐phenylindole; FCM, Flow cytometry; FGL1, fibrinogen‐like; IF, Immunofluorescence staining; IHC, immunohistochemistry; oe, overexpression; PBMCs, peripheral blood mononuclear cells; SD, Standard Deviation; sh, Short hairpin.
FIGURE 3
FIGURE 3
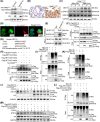
Yap‐mediated transcriptional regulation of FGL1 promotes the progression of lung adenocarcinoma. (A) IF revealed enhanced nuclear retention of Yap (green) in Kras LSL‐G12D lung cancer tissues. (B‐C) ChIP assays confirmed Yap's binding to FGL1's promoter region. (D) Luciferase reporter assays established Yap's regulatory influence on FGL1 transcriptional activity. (E) Western blotting identified FGL1 expression changes following Yap overexpression in LLC cells (n = 3 wells per group). (F) Depiction of the subcutaneous tumor transplant model using LLC cells, highlighting the counteracting effects of FGL1 silencing on Yap‐overexpression‐driven tumor growth (n = 5 mice per group). (G) Comparison of tumor volumes among Yap‐oe, shFGL1, and Yap‐oe + shFGL1 groups. (H) IHC analysis indicated that Yap overexpression's enhancement of ki67 expression in tumors is mitigated by FGL1 silencing (n = 5 mice per group). (I) IF demonstrated that FGL1 silencing reversed the Yap‐overexpression‐induced reduction of CD8+ T cells in tumor tissues (n = 5 mice per group). (J‐K) A549 cells (overexpressing Yap, silenced for FGL1, or both) co‐cultured with CD8+ cells. FCM revealed that FGL1 silencing reverses Yap overexpression's inhibitory impact on A549 cell apoptosis (n = 5 cells per group). Data presented as mean ± SD; ** denotes P < 0.01, *** indicates P < 0.001. Abbreviations: ChIP, Chromatin immunoprecipitation; DAPI, 4',6‐diamidino‐2‐phenylindole; FCM, Flow cytometry; FGL1, fibrinogen‐like; IF, Immunofluorescence staining; IHC, immunohistochemistry; oe, overexpression; SD: Standard Deviation; sh, Short hairpin; TBE, binding sites; Yap, Yes‐associated protein.
FIGURE 4
FIGURE 4
KRAS augments Yap methylation and modulates its transcriptional activity. (A) Western blotting assessed Yap K342me, Yap, p‐Yap, p‐Lats1, Lats1, p‐Mst1, and Mst1 expression variations in Kras LSL‐G12D mouse lung cancer samples (n = 3 mice per group). (B) IHC demonstrated elevated Yap K342me expression in Kras LSL‐G12D lung cancer tissues (n = 5 mice per group). (C) Following transfection of HA‐KRAS (WT) and HA‐KRAS G12V into NCI‐H1299 cells, expression alterations of Yap K342me, p‐Yap, Yap, p‐ERK1/2 and ERK1/2 were detected via Western blotting (n = 3 independent trials). (D) Post different concentrations of U0126 administration in A549 cells, Western blotting identified changes in FGL1, Yap K342me, Yap, p‐ERK1/2, and ERK1/2 expression relative to the DMSO control (n = 3 wells per group). (E) IHC revealed the distribution of Yap K342me in human lung cancer specimens (n = 5 patients per group). (F) Western blotting showed reduced FGL1 levels in Kras LSL‐G12D lung cancer tissues following lung‐specific Yap knockout (n = 3 mice per group). (G) Lung‐specific Yap knockout diminished FGL1 (green) distribution in Kras LSL‐G12D mouse lung cancer tissues (n = 5 mice per group). (H) Lung‐specific Yap knockout's impact on Kras LSL‐G12D mouse lung cancer progression was visualized with HE staining. (I) Survival rates of lung‐specific Yap knockout mice with lung cancer were examined (n = 9 mice per group). (J) Lung‐specific Yap knockout increased CD8+ T cells (green) distribution in Kras LSL‐G12D mouse lung cancer tissues (n = 5 mice per group). (K) FCM revealed an increased percentage of CD8+ T cells expressing IFN‐γ, TNF‐α, and Perforin in lung cancer tissues post‐lung‐specific Yap knockout (n = 5 mice per group). (L) Post‐Yap deletion, changes in ki67 levels in mouse lung cancer tissues were observed using IHC (n = 5 mice per group). (M) Yap‐knockout lung cancer cells co‐cultured with CD8+ T cells exhibited enhanced apoptosis of lung cancer cells, as determined by FCM (n = 5 wells per group).Data are presented as mean ± SD. The symbol *** indicates P < 0.001. Abbreviations: DAPI, 4',6‐diamidino‐2‐phenylindole; ERK1/2, extracellular regulated kinase 1/2; FCM, Flow cytometry; FGL1, fibrinogen‐like; HE, Hematoxylin and eosin; IHC, immunohistochemistry; KRAS, Kirsten rat sarcoma viral oncogene homolog; SD, Standard Deviation; WT, wild‐type; Yap, Yes‐associated protein.
FIGURE 5
FIGURE 5
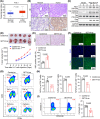
KRAS‐ERK1/2 phosphorylates and stabilizes SET1A. (A) In NCI‐H1299 cells, Western blotting revealed that SET1A silencing neutralized the rise in Yap K342me prompted by KRAS G12V overexpression (n = 3 independent experiments). (B) SET1A distribution in Kras LSL‐G12D mouse lung cancer tissues were assessed by IHC. (C) Western blotting analyzed the expression variations of SET1A, ERK1/2, and p‐ERK1/2 in lung cancer tissues of Kras LSL‐G12D mice (n = 3 mice per group). (D) Enhanced nuclear retention of SET1A (green) was observed in NCI‐H1299 cells overexpressing KRAS G12V (red). (E) co‐IP assays revealed SET1A's interaction with ERK1/2. (F) Phos‐tag assays in NCI‐H1299 cells indicated that KRAS G12V overexpression fosters SET1A phosphorylation, an effect attenuated by U0126. (G) Site sequence details for SET1A gene mutations. (H) Transfection of SET1A plasmids mutated at T916A, S1153A, and T1185A sites into NCI‐H1299 cells, coupled with phos‐tag assays, demonstrated that only T1185A site mutation negates KRAS G12V overexpression's promotion of SET1A phosphorylation. (I) KRAS G12V overexpression reduced SET1A ubiquitination in NCI‐H1299 cells, as determined by ubiquitination assays. (J) Using CHX‐based protein stability assays, KRAS G12V overexpression was identified to bolster SET1A protein stability. (K) Ubiquitination assays in A549 cells showed that U0126 augments SET1A ubiquitination. (L) In NCI‐H1299 cells, T1185A site mutations neutralized KRAS G12V overexpression's suppressive impact on SET1A ubiquitination, as determined by ubiquitination assays. (M) CHX‐based protein stability assays revealed that SET1A mutations at the T1185A site offset the protein stability enhancement by KRAS G12V overexpression. Bar graphs depict mean ± SD. Abbreviations: CHX, cycloheximide; co‐IP, co‐immunoprecipitation; DAPI, 4',6‐diamidino‐2‐phenylindole; ERK1/2, extracellular regulated kinase 1/2; HA, hemagglutinin; IHC, immunohistochemistry; IP, immunoprecipitation; KRAS, Kirsten rat sarcoma viral oncogene homolog; SD, Standard Deviation; SET1A: phosphorylated SET1 histone methyltransferase; Ub, ubiquitin.
FIGURE 6
FIGURE 6
The anti‐cancer effect of SET1A in vivo. (A) The mRNA expression shifts of SET1A in 515 lung cancer patients and 59 healthy individuals were scrutinized using the UALCAN database. (B) HE and IHC methods were employed to observe SET1A distribution in human lung cancer samples. (C) Western blotting post‐SET1A overexpression in LLC cells indicated changes in FGL1, Yap K342me, and Yap expression levels (n = 3 wells per group). (D) A representative plot from the subcutaneous tumor transplantation model using LLC cells revealed enhanced tumor growth with SET1A overexpression (n = 5 mice per group). (E) IHC demonstrated that SET1A overexpression augmented ki67 expression in tumors (n = 5 mice per group). (F) IF indicated increased FGL1 (green) expression in tumors post SET1A overexpression. (G‐H) FCM data illustrated a decline in the percentage of CD8+ T cells expressing IFN‐γ, TNF‐α, and Perforin in tumor tissues with SET1A overexpression (n = 5 mice per group). (I) When co‐culturing LLC cells overexpressing SET1A with CD8+ T cells, FCM revealed SET1A overexpression reduced apoptosis in LLC cells (n = 5 wells per group). Results are presented as mean ± SD. The symbol *** indicates P < 0.001. Abbreviations: DAPI, 4',6‐diamidino‐2‐phenylindole; FCM, Flow cytometry; FGL1, fibrinogen‐like; HE, Hematoxylin and eosin; IF, Immunofluorescence staining; IHC, immunohistochemistry; oe, overexpression; SD, Standard Deviation; SET1A, SET1 histone methyltransferase; Yap, Yes‐associated protein.
FIGURE 7
FIGURE 7
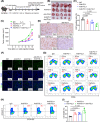
Combined immunotherapy with anti‐PD‐1 and anti‐FGL1 antibodies inhibits LUAD progression. (A) Flowchart detailing the treatment regimen for LLC transplant tumors using PD‐1 mAbs and FGL1 mAbs. (B‐C) Representative images from the subcutaneous LLC transplant tumor model illustrate that the combination therapy with PD‐1 mAbs and FGL1 mAbs more effectively suppresses tumor growth compared to monotherapy (n = 5 mice per group). (D‐E) IHC analysis reveals a more pronounced inhibition of ki67 expression in tumors treated with the combination of PD‐1 mAbs and FGL1 mAbs, relative to monotherapy (n = 5 mice per group). (F) Tumors treated with both PD‐1 mAbs and FGL1 mAbs display enhanced CD8+ T cell infiltration compared to single‐agent treatment (n = 5 mice per group). (G) FCM results demonstrate that the combination therapy elevates the proportion of tumor‐infiltrating CD8+ T cells expressing IFN‐γ, TNF‐α, and Perforin more than monotherapy (n = 5 mice per group). (H‐I) Co‐culturing LLC cells with CD8+ T cells in vitro and subsequent FCM analysis show that combined PD‐1 mAbs and FGL1 mAbs treatment more effectively induces LLC cell apoptosis than single‐agent treatment (n = 5 wells per group). Results are shown as mean ± SD. The symbol * indicates P < 0.05, ** indicates P < 0.01, and *** indicates P < 0.001. Abbreviations: DAPI, 4',6‐diamidino‐2‐phenylindole; FCM, Flow cytometry; FGL1, fibrinogen‐like; IF, Immunofluorescence staining; IHC, immunohistochemistry; LUAD, lung adenocarcinoma; PD‐1, programmed cell death‐1; SD, Standard Deviation.
FIGURE 8
FIGURE 8
The graphic abstract of the current study. KRAS mutations promote immune escape in lung cancer through SET1A‐mediated Yap activation and FGL1 overexpression. Abbreviations: ERK, extracellular regulated kinase; FGL1, fibrinogen‐like protein 1; KRAS, Kirsten rat sarcoma viral oncogene homolog; KRASmut , KRAS mutation; LAG‐3, Lymphocyte‐activation gene 3; PD‐1, programmed cell death‐1; SET1A: phosphorylated SET1 histone methyltransferase; Yap, Yes‐associated protein.

Similar articles

Cited by

References

    1. Prior IA, Lewis PD, Mattos C. A comprehensive survey of Ras mutations in cancer. Cancer Res. 2012;72(10):2457–2467. - PMC - PubMed
    1. Simanshu DK, Nissley DV, McCormick F. RAS Proteins and Their Regulators in Human Disease. Cell. 2017;170(1):17–33. - PMC - PubMed
    1. Dunnett‐Kane V, Nicola P, Blackhall F, Lindsay CJC. Mechanisms of resistance to KRASG12C inhibitors. Cancers (Basel). 2021;13(1):151. - PMC - PubMed
    1. Macaya I, Roman M, Welch C, Entrialgo‐Cadierno R, Salmon M, Santos A, et al. Signature‐driven repurposing of Midostaurin for combination with MEK1/2 and KRASG12C inhibitors in lung cancer. Nat Commun. 2023;14(1):6332. - PMC - PubMed
    1. Hui E, Cheung J, Zhu J, Su X, Taylor MJ, Wallweber HA, et al. T cell costimulatory receptor CD28 is a primary target for PD‐1‐mediated inhibition. Science. 2017;355(6332):1428–1433. - PMC - PubMed

MeSH terms

Substances