

Molecular Biomarkers for In Vitro Thrombogenicity Assessment of Medical Device Materials
- PMID: 39340365
- PMCID: PMC11661467
- DOI: 10.1002/jbm.b.35491
Molecular Biomarkers for In Vitro Thrombogenicity Assessment of Medical Device Materials
Abstract
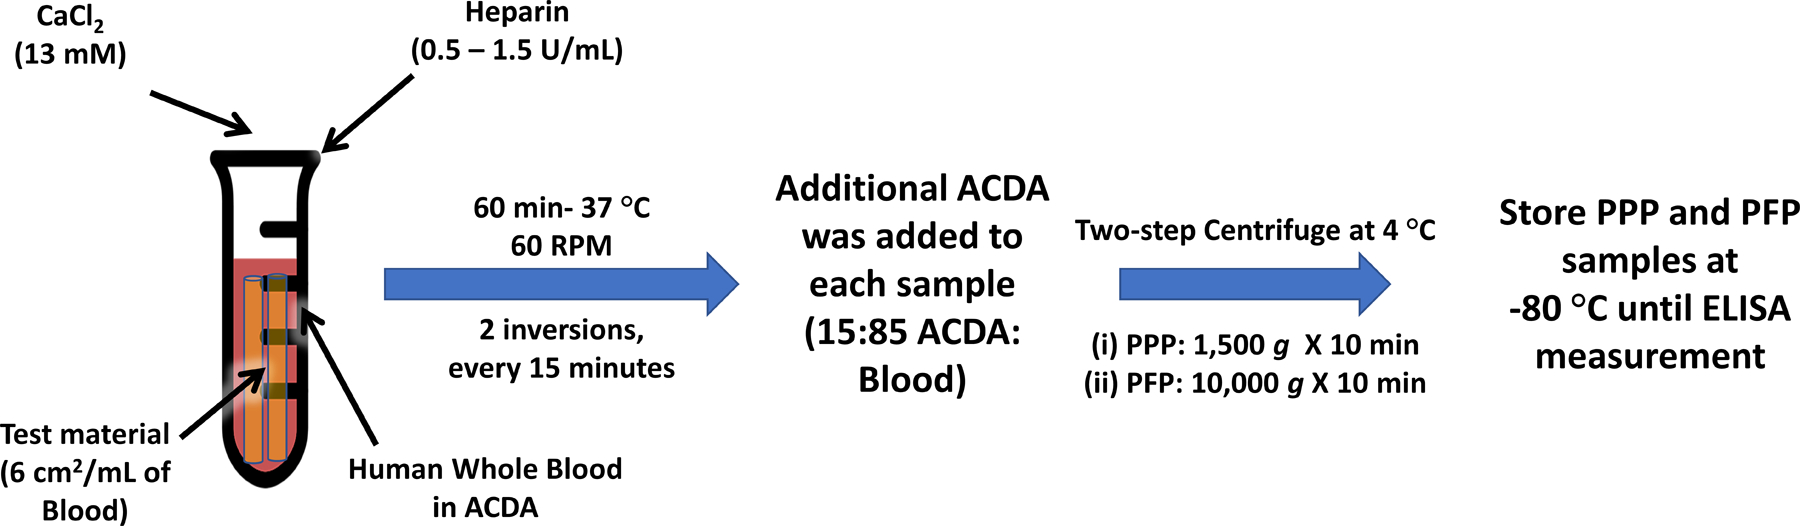
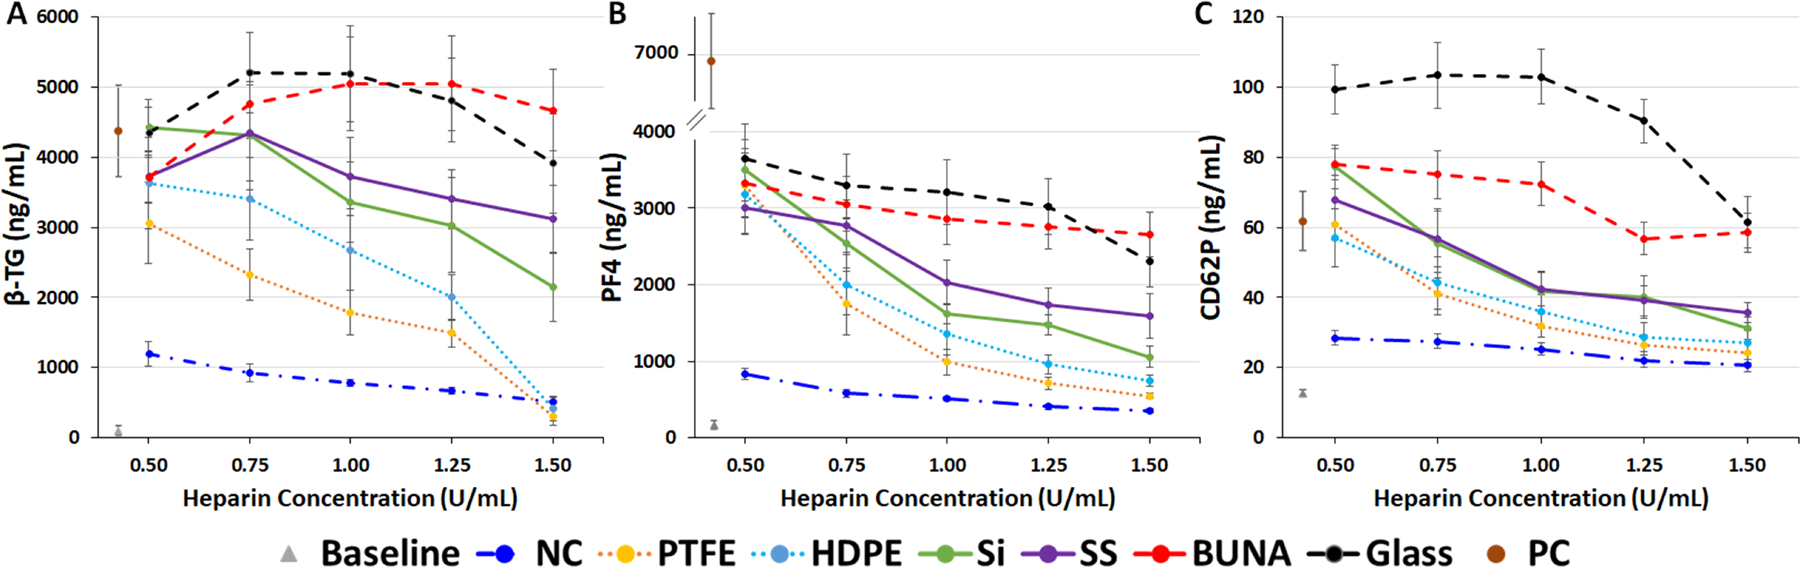
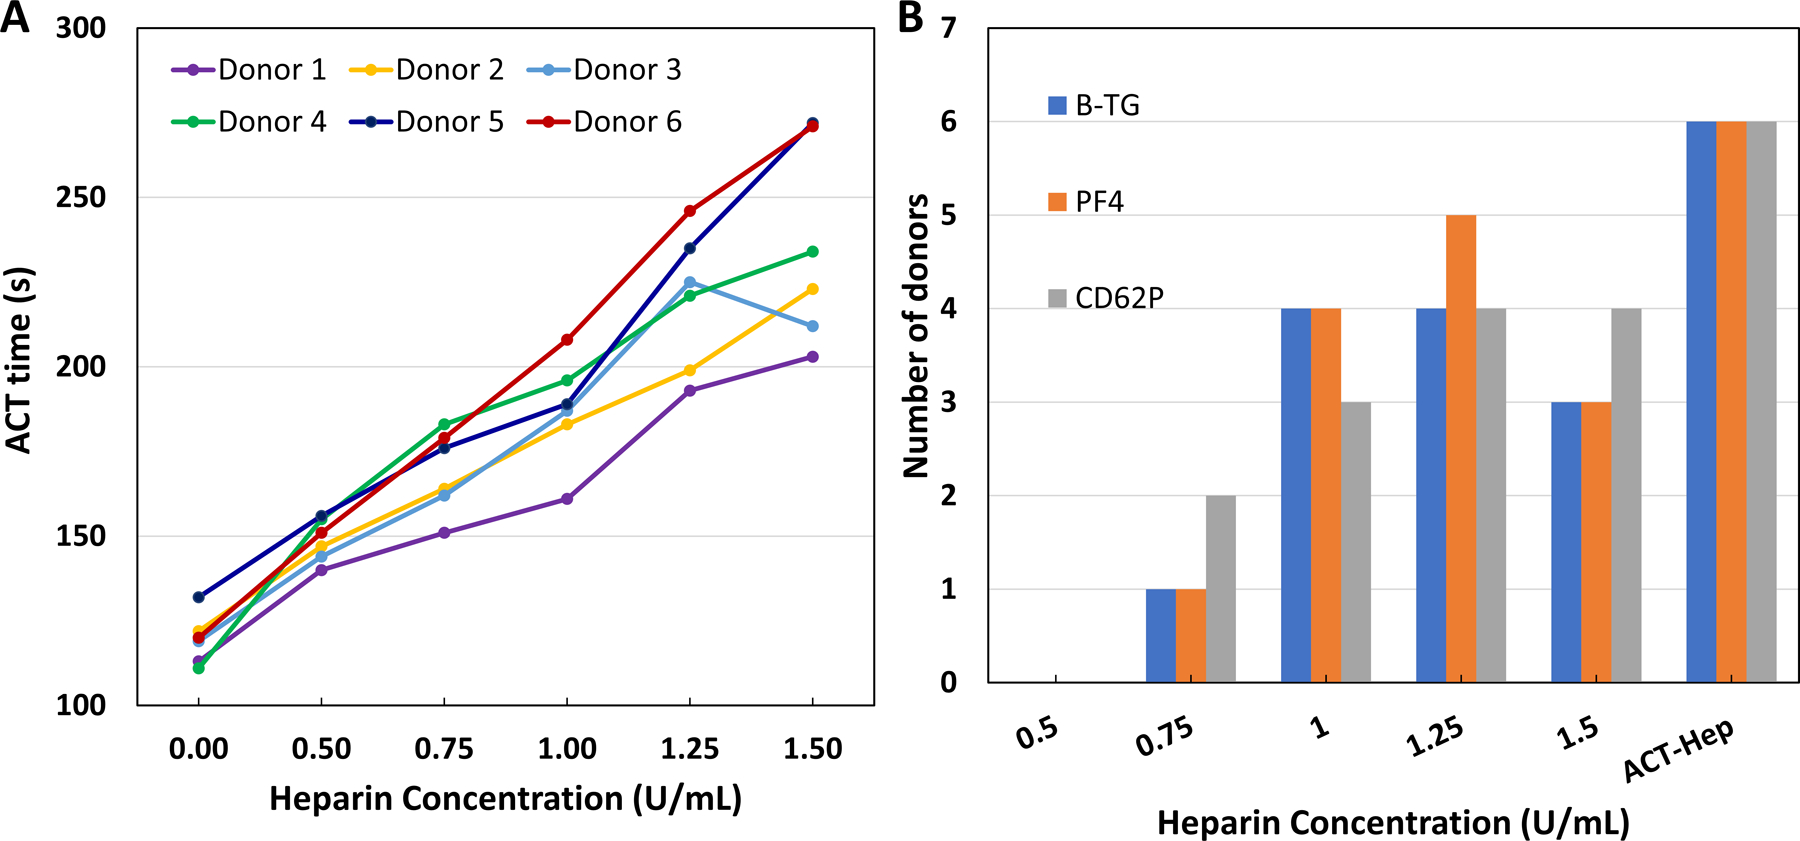
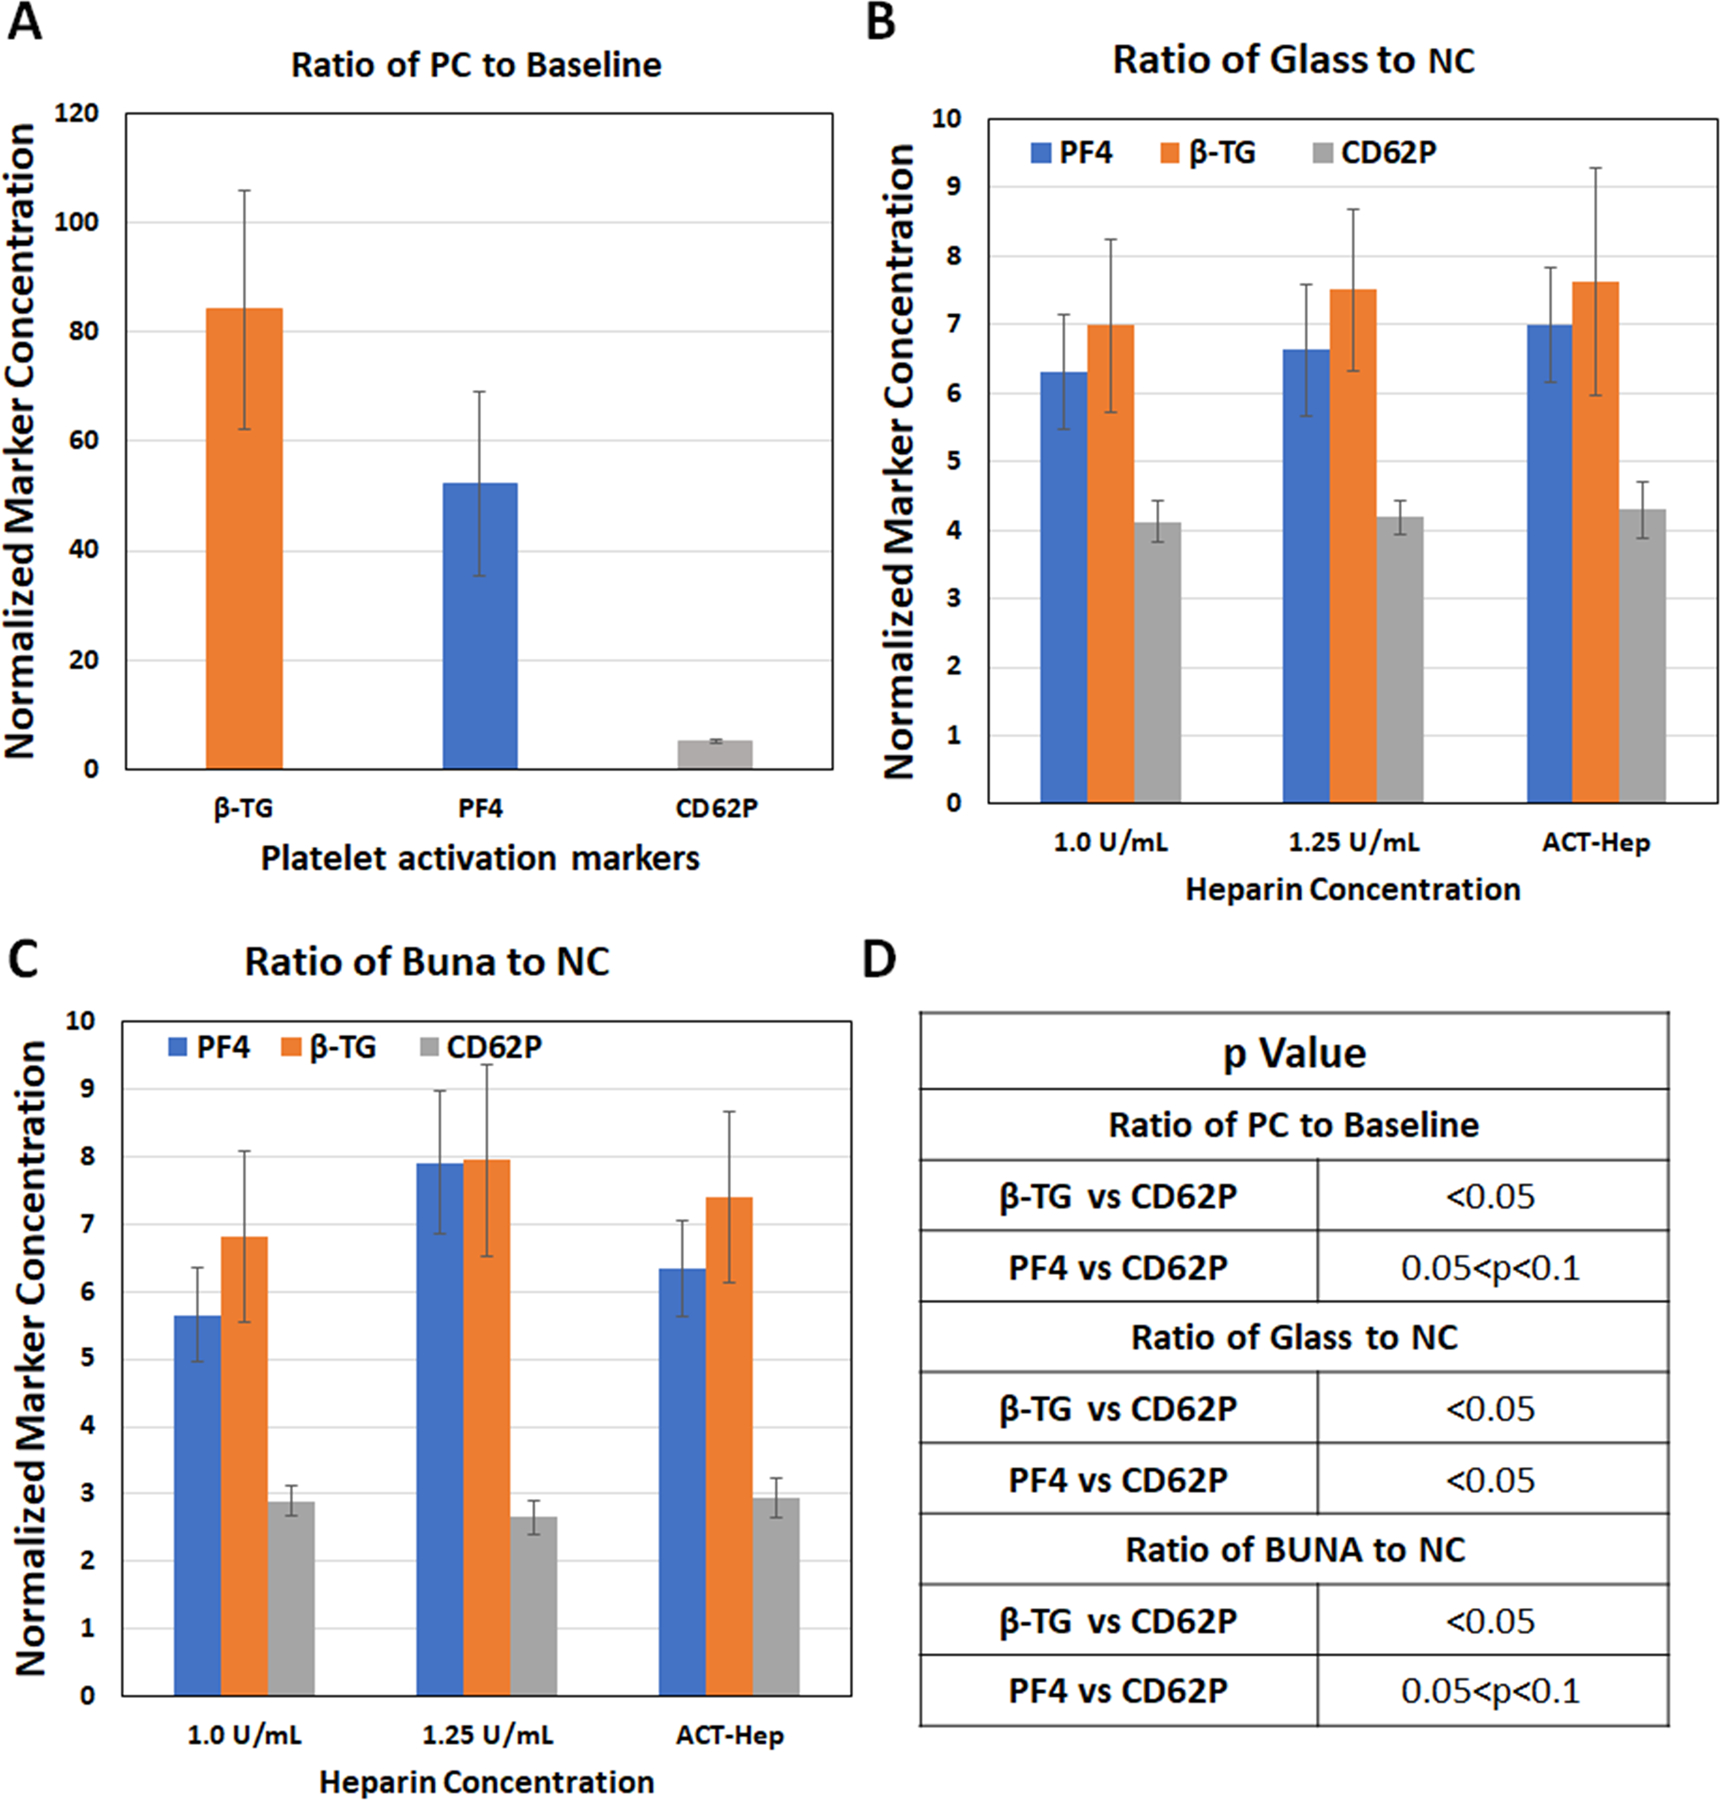
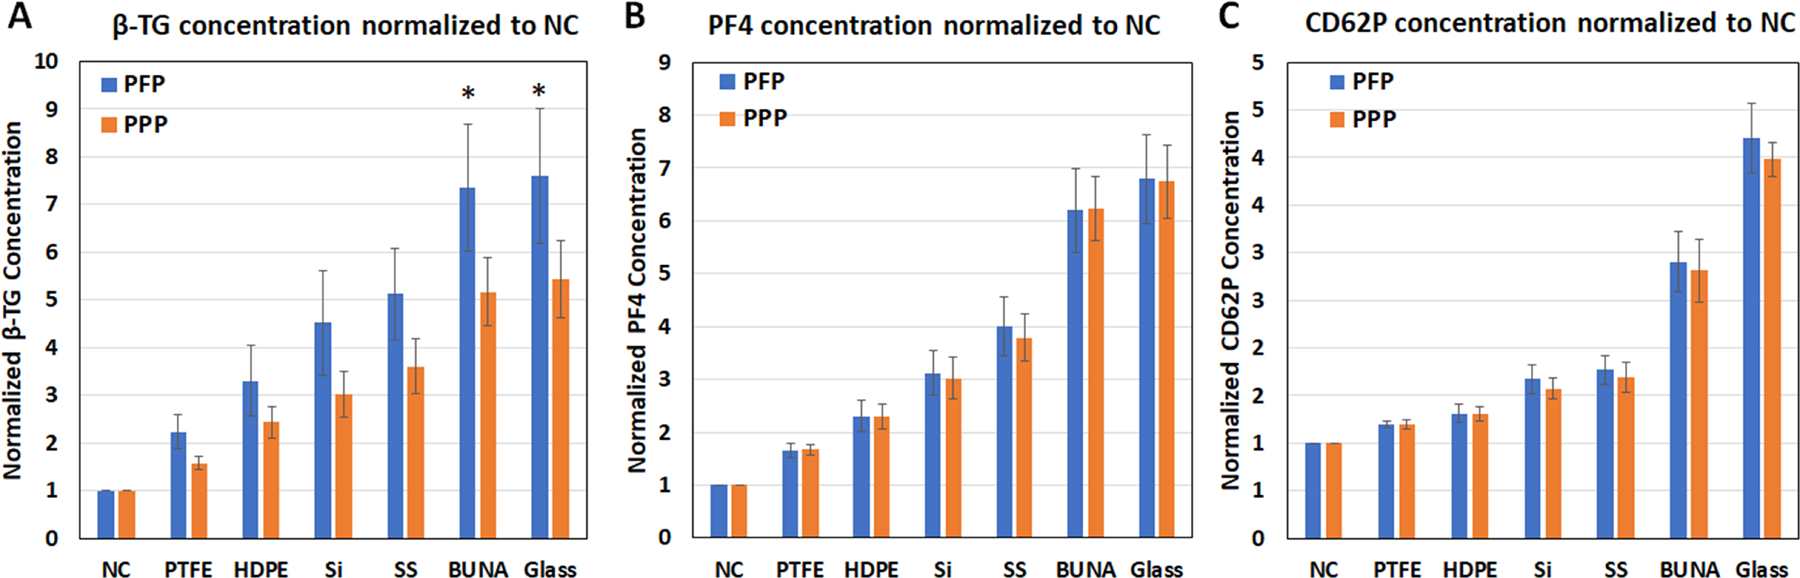
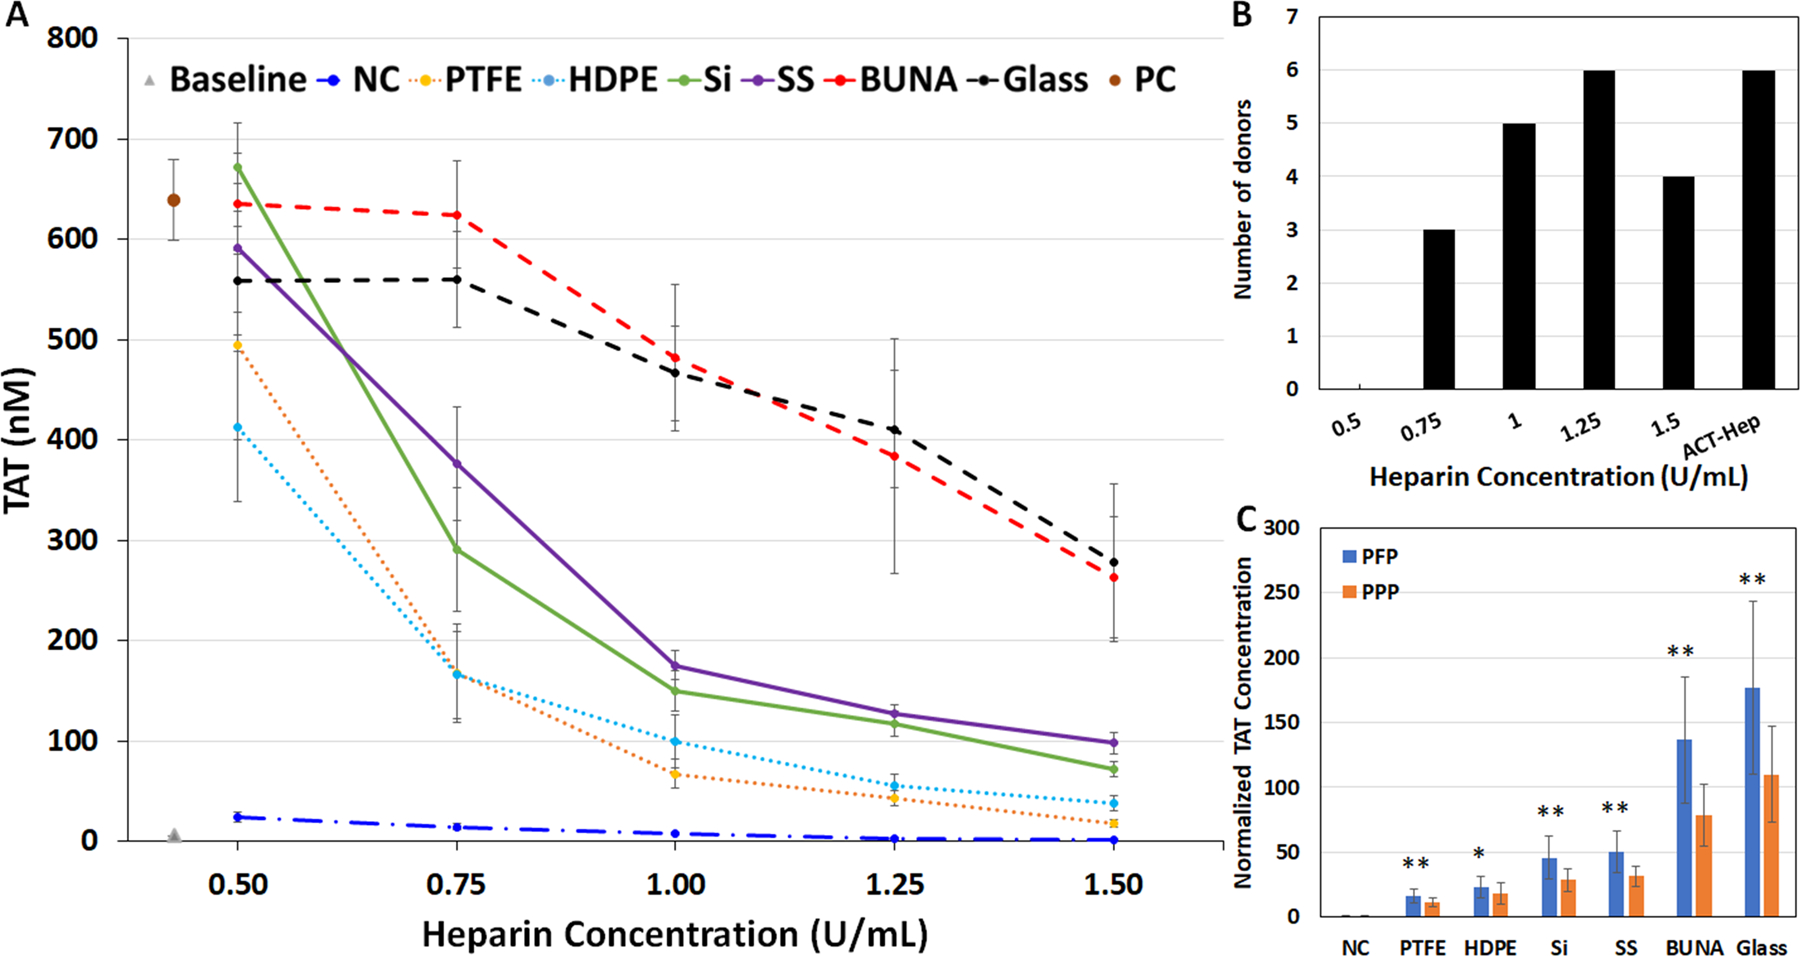
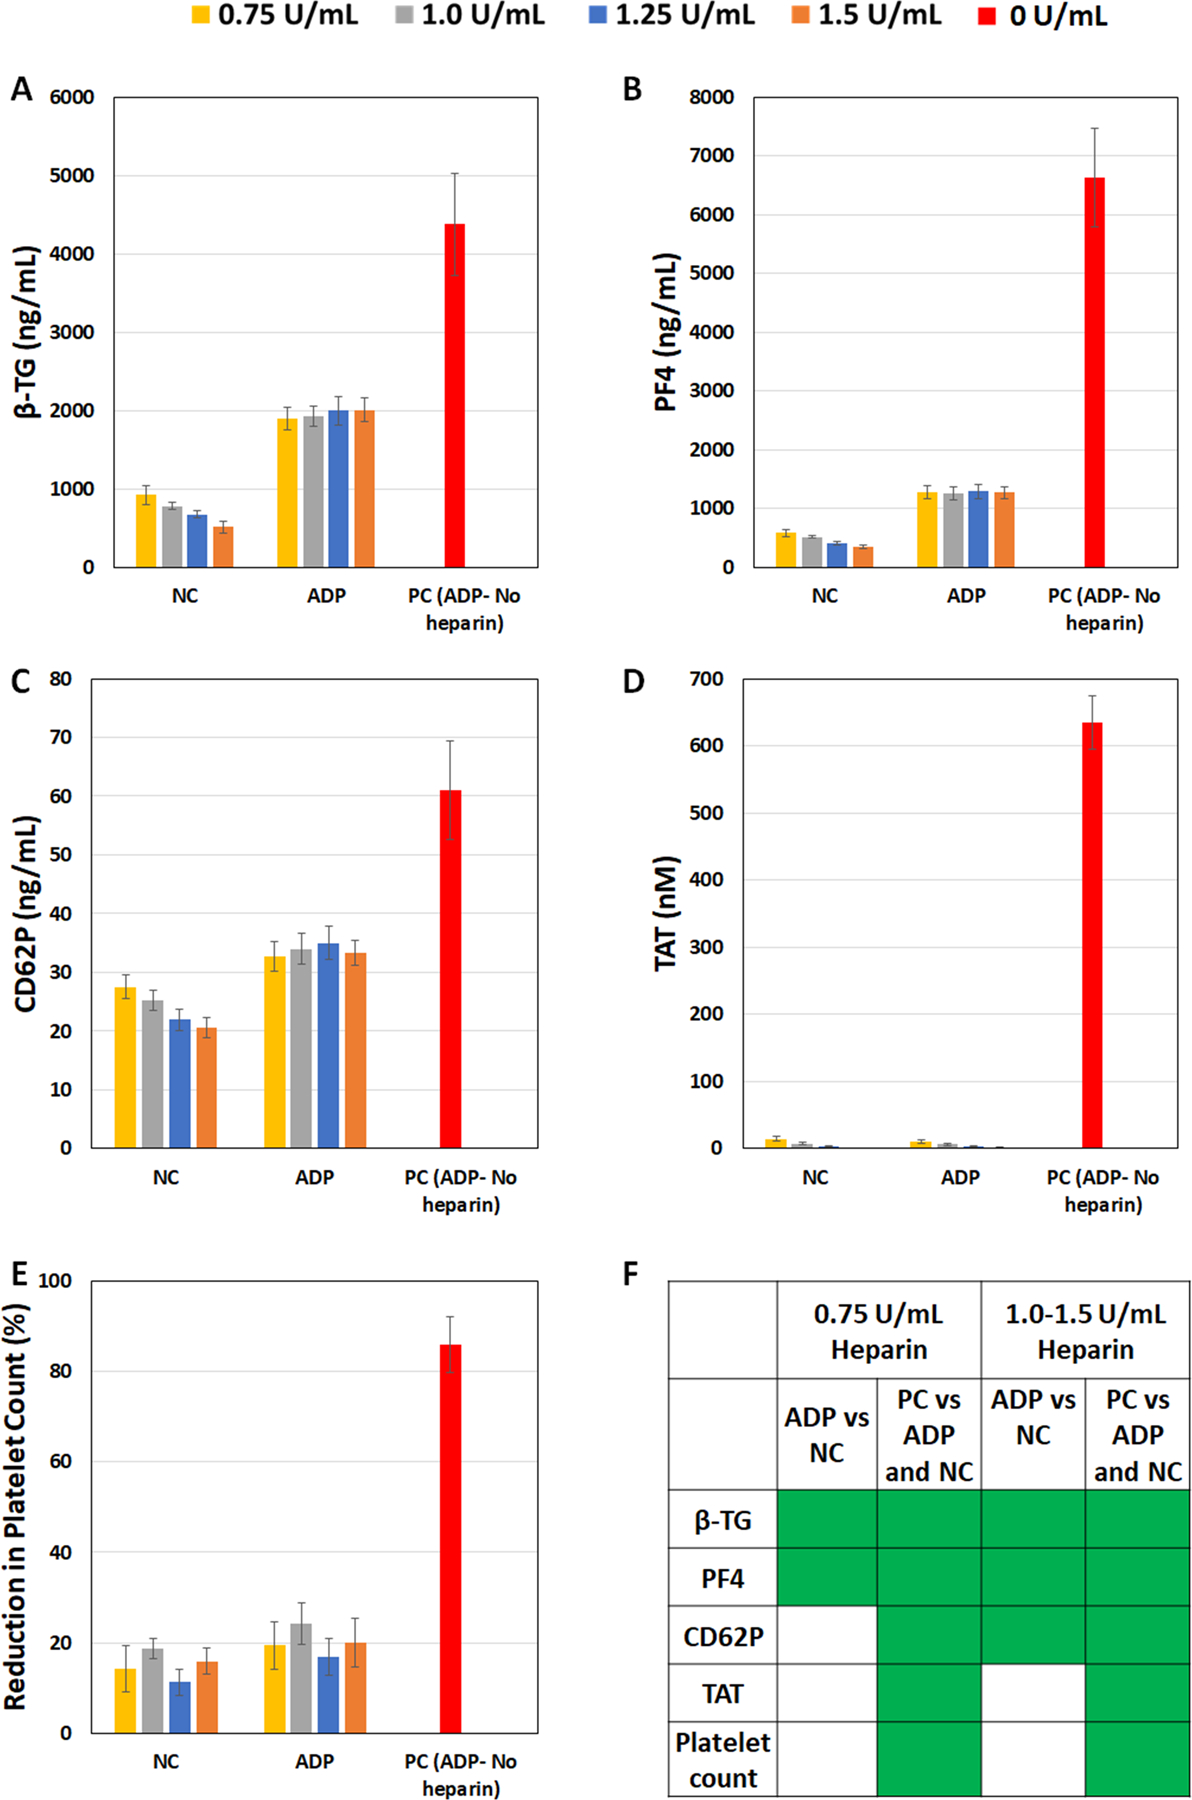
To develop standardized in vitro thrombogenicity test methods for evaluating medical device materials, three platelet activation biomarkers, beta-thromboglobulin (β-TG), platelet factor 4 (PF4), soluble p-selectin (CD62P), and a plasma coagulation marker, thrombin-antithrombin complex (TAT), were investigated. Whole blood, drawn from six healthy human volunteers into Anticoagulant Citrate Dextrose Solution A was recalcified and heparinized over a concentration range of 0.5-1.5 U/mL. The blood was incubated with test materials with different thrombogenic potentials for 60 min at 37°C, using a 6 cm2/mL material surface area to blood volume ratio. After incubation, the blood platelet count was measured before centrifuging the blood to prepare platelet-poor plasma (PPP) and platelet-free plasma (PFP) for enzyme-linked immunosorbent assay analysis of the biomarkers. The results show that all four markers effectively differentiated the materials with different thrombogenic potentials at heparin concentrations from 1.0 to 1.5 U/mL. When a donor-specific heparin concentration (determined by activated clotting time) was used, the markers were able to differentiate materials consistently for blood from all the donors. Additionally, using PFP instead of PPP further improved the test method's ability to differentiate the thrombogenic materials from the negative control for β-TG and TAT. Moreover, the platelet activation markers were able to detect reversible platelet activation induced by adenosine diphosphate (ADP). In summary, all three platelet activation markers (β-TG, PF4, and CD62P) can distinguish thrombogenic potentials of different materials and detect ADP-induced reversible platelet activation. Test consistency and sensitivity can be enhanced by using a donor-specific heparin concentration and PFP. The same test conditions are applicable to the measurement of coagulation marker TAT.
Keywords: biomaterials; coagulation; hemocompatibility; molecular markers; platelet activation; thrombogenicity.
Published 2024. This article is a U.S. Government work and is in the public domain in the USA.
Figures
Similar articles
-
Alternative Anticoagulant Strategy to Improve the Test Sensitivity of ASTM F2888-19 Standard for Platelet and Leukocyte Count Assay.J Biomed Mater Res B Appl Biomater. 2024 Dec;112(12):e35514. doi: 10.1002/jbm.b.35514. J Biomed Mater Res B Appl Biomater. 2024. PMID: 39578236 Free PMC article.
-
Blood biomarkers for the non-invasive diagnosis of endometriosis.Cochrane Database Syst Rev. 2016 May 1;2016(5):CD012179. doi: 10.1002/14651858.CD012179. Cochrane Database Syst Rev. 2016. PMID: 27132058 Free PMC article.
-
Can a Liquid Biopsy Detect Circulating Tumor DNA With Low-passage Whole-genome Sequencing in Patients With a Sarcoma? A Pilot Evaluation.Clin Orthop Relat Res. 2025 Jan 1;483(1):39-48. doi: 10.1097/CORR.0000000000003161. Epub 2024 Jun 21. Clin Orthop Relat Res. 2025. PMID: 38905450
-
Soluble P-selectin, but not circulating cell-free DNA, is a potential diagnostic biomarker in heparin-induced thrombocytopenia.J Thromb Haemost. 2025 Jul;23(7):2242-2254. doi: 10.1016/j.jtha.2025.04.006. Epub 2025 Apr 17. J Thromb Haemost. 2025. PMID: 40252846
-
Platelet-rich therapies for musculoskeletal soft tissue injuries.Cochrane Database Syst Rev. 2014 Apr 29;2014(4):CD010071. doi: 10.1002/14651858.CD010071.pub3. Cochrane Database Syst Rev. 2014. PMID: 24782334 Free PMC article.
Cited by
-
Alternative Anticoagulant Strategy to Improve the Test Sensitivity of ASTM F2888-19 Standard for Platelet and Leukocyte Count Assay.J Biomed Mater Res B Appl Biomater. 2024 Dec;112(12):e35514. doi: 10.1002/jbm.b.35514. J Biomed Mater Res B Appl Biomater. 2024. PMID: 39578236 Free PMC article.
References
-
- Eckman PM, John R. Bleeding and Thrombosis in Patients With Continuous-Flow Ventricular Assist Devices. Circulation. 2012;125(24):3038–47. - PubMed
-
- Guidance for Industry and Food and Drug Administration Staff. Use of International Standard ISO 10993–1, “Biological evaluation of medical devices - Part 1: Evaluation and testing within a risk management process”: US Food and Drug Administration, Silver Spring, MD. 2023.
-
- Jaffer I, Fredenburgh J, Hirsh J, Weitz J. Medical device‐induced thrombosis: what causes it and how can we prevent it? Journal of Thrombosis and Haemostasis. 2015;13:S72–S81. - PubMed
-
- Wiper A, Hashmi I, Srivastava V, Shaktawat S, Sogliani F, Tang G, et al. Guide wire thrombus formation during trans-femoral TAVI. Cardiovascular revascularization medicine: including molecular interventions. 2014;15(6–7):360–1. - PubMed
Publication types
MeSH terms
Substances
Grants and funding
LinkOut - more resources
Full Text Sources
Miscellaneous
