. 2024 Nov;11(44):e2404342.
doi: 10.1002/advs.202404342. Epub 2024 Sep 28.

TRPC3/6 Channels Mediate Mechanical Pain Hypersensitivity via Enhancement of Nociceptor Excitability and of Spinal Synaptic Transmission

Affiliations

TRPC3/6 Channels Mediate Mechanical Pain Hypersensitivity via Enhancement of Nociceptor Excitability and of Spinal Synaptic Transmission

Zhi-Chuan Sun et al. Adv Sci (Weinh). 2024 Nov.

Abstract

Patients with tissue inflammation or injury often experience aberrant mechanical pain hypersensitivity, one of leading symptoms in clinic. Despite this, the molecular mechanisms underlying mechanical distortion are poorly understood. Canonical transient receptor potential (TRPC) channels confer sensitivity to mechanical stimulation. TRPC3 and TRPC6 proteins, coassembling as heterotetrameric channels, are highly expressed in sensory neurons. However, how these channels mediate mechanical pain hypersensitivity has remained elusive. It is shown that in mice and human, TRPC3 and TRPC6 are upregulated in DRG and spinal dorsal horn under pathological states. Double knockout of TRPC3/6 blunts mechanical pain hypersensitivity, largely by decreasing nociceptor hyperexcitability and spinal synaptic potentiation via presynaptic mechanism. In corroboration with this, nociceptor-specific ablation of TRPC3/6 produces comparable pain relief. Mechanistic analysis reveals that upon peripheral inflammation, TRPC3/6 in primary sensory neurons get recruited via released bradykinin acting on B1/B2 receptors, facilitating BDNF secretion from spinal nociceptor terminals, which in turn potentiates synaptic transmission through TRPC3/6 and eventually results in mechanical pain hypersensitivity. Antagonizing TRPC3/6 in DRG relieves mechanical pain hypersensitivity in mice and nociceptor hyperexcitability in human. Thus, TRPC3/6 in nociceptors is crucially involved in pain plasticity and constitutes a promising therapeutic target against mechanical pain hypersensitivity with minor side effects.

Keywords: TRPC3; TRPC6; mechanical pain hypersensitivity; nociceptor; synaptic potentiation.


Conflict of interest statement

The authors declare no conflict of interest.

Figures
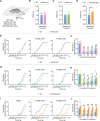
Figure 1
Figure 1
TRPC3/6 deficiency blunts mechanical pain hypersensitivity. A) Schematic illustration of mechanical behavioral testing in different genotypes of mice. B–D) Comparison of basal mechanical sensitivity in TRPC3 KO (B, n = 11), TRPC6 KO (C, n = 8), TRPC3/6 DKO (D, n = 5) mice and their corresponding wildtype (WT) littermates. *P < 0.05, by two‐tailed unpaired t‐test. E,G,I) Comparison of response frequency to von Frey hairs in TRPC3 KO (E), TRPC6 KO (G) and TRPC3/6 DKO (I) mice with WT littermates prior to and at 1d and 4d following CFA inflammation. F,H,J) Magnitude and time course of mechanical pain hypersensitivity to von Frey hairs application to ipsilateral hindpaws following CFA inflammation in TRPC3 KO (F, n = 11), TRPC6 KO (H, n = 8) and TRPC3/6 DKO (J, n = 5) mice as compared to their WT littermates. **P < 0.01, ***P < 0.001, ****P < 0.0001 at all‐time points for different genotypes versus basal by two‐way ANOVA, P < 0.05, †† P < 0.01, ††† P < 0.001, †††† P < 0.0001 at all‐time points for either TRPC3 KO, TRPC6 KO or TRPC3/6 DKO versus their WT littermates by two‐way ANOVA. Data are represented as mean ± S.E.M. See Table S2 (Supporting Information) for detailed statistical information. WT, wildtype; TRPC3 KO, TRPC3 knockout; TRPC6 KO, TRPC6 knockout; TRPC3/6 DKO, TRPC3/6 double knockout; PWMT, paw withdrawal mechanical threshold.
Figure 2
Figure 2
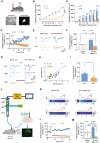
TRPC3/6 is responsible for the coding of cutaneous mechanical sensitivity in DRG and spinal cord circuits. A) Schematic diagram showing fiber photometry recording in spinal dorsal horn excitatory neurons in response to different types of mechanical stimulation applied to its receptive field. B) Typical examples of traces (upper panels) and heat maps (lower panels) of calcium transients induced by different forces of von Frey hairs prior to and at 1d and 7d following CFA inflammation in WT and TRPC3/6 DKO mice. Insets show the magnified calcium transients. C) Quantitative summary from 7 independent experiments of peak GCaMP6s signals evoked by von Frey hairs in WT and TRPC3/6 DKO mice prior to and at different time points after CFA injection. **P < 0.01 for WT CFA versus WT basal, # P < 0.05, ## P < 0.01 for DKO versus WT, by Friedman's M test. D) Typical examples of traces (upper panels) and heat maps (lower panels) of calcium transients induced by brush, pressure and pinch of the receptive field prior to and at 1d and 7d following CFA inflammation in WT and TRPC3/6 DKO mice. Insets show the magnified calcium transients. E) Quantitative summary from 7 independent experiments of peak GCaMP6s signals evoked by brush, pressure and pinch stimuli in WT and TRPC3/6 DKO mice prior to and at different time points after CFA injection. **P < 0.01 for WT CFA versus WT basal, †† P < 0.01 for DKO versus WT, by Friedman's M test. Data are represented as mean ± S.E.M. See Table S2 (Supporting Information) for detailed statistical information.
Figure 3
Figure 3
TRPC3 and TRPC6 are upregulated in DRG and spinal dorsal horn following peripheral injury in mice and human. A–D) TRPC3 and TRPC6 are upregulated in the DRG and spinal dorsal horn at both mRNA (A,B) (n = 4) and protein (C,D) (n = 3) levels at 24 h after CFA inflammation in WT mice. **P < 0.01, ***P < 0.001, by two‐tailed unpaired t‐test. E–H) Representative FISH images (E,F) and quantitative summary (G,H) showing the localization of TRPC3 and TRPC6 in different subtypes of DRG neurons and their upregulation upon CFA inflammation in mice (n = 4–5). *P < 0.05, **P < 0.01, ****P < 0.0001, by two‐tailed unpaired t‐test. Scale bar: 100 µm in the left three columns and 50 µm in right magnified panels in (E) and (F). I–L) Representative FISH images (I,K) and quantitative summary (J,L) showing the localization of TRPC3 and TRPC6 in the spinal dorsal horn and their upregulation upon CFA inflammation in WT mice (n = 4–5). **P < 0.01, ***P < 0.001, by two‐tailed unpaired t‐test. Scale bar: 100 µm in the left three columns and 50 µm in right magnified panels in (I) and (K). M,N) TRPC3 (M) (n = 3) and TRPC6 (N) (n = 3) are upregulated in DRGs of patients with brachial plexus avulsion as compared to controls (n = 3). *P < 0.05, **P < 0.01, by two‐tailed unpaired t‐test. O–R) Representative triple immunofluorescence images of DRG neurons from avulsed DRGs in BPA patients for TRPC3 with CGRP and P2X3 (O) and for TRPC6 with CGRP and P2X3 (Q). Scale bar: 100 µm in (O) and (Q). P,R) Relative frequency of TRPC3‐ (P) and TRPC6‐ (R) immunoreactive neurons across population of human DRG neurons after BPA injury. Bars are averages. Insets shown in (P) and (R) are quantitative summary of coexpression of TRPC3 or TRPC6 with CGRP and P2X3. n = 777 neurons for TRPC3 and 799 neurons for TRPC6 from three humans. Data are represented as mean ± S.E.M. See Table S2 (Supporting Information) for detailed statistical information. DRG, dorsal root ganglion; SDH, spinal dorsal horn; BPA, brachial plexus avulsion.
Figure 4
Figure 4
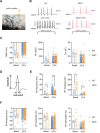
Excitability of nociceptive DRG neurons is substantially reduced in TRPC3/6 DKO mice. A) Photograph showing whole‐cell patch‐clamp recording from small‐diameter DRG neurons from WT and TRPC3/6 DKO mice. Scale bar: 10 µm. B) Action potentials (APs) induced by depolarizing current injection at 50 pA in DRG neurons from WT and TRPC3/6 DKO mice in both basal and CFA‐inflamed state (n = 6–12). C) Comparison of passive membrane properties including resting membrane potential, membrane resistance, membrane capacitance in small DRG neurons derived from WT and DKO mice in basal and inflamed state (n = 6–12). D) A representative AP evoked by depolarizing current injection and depiction of analysis of different parameters of AP. E,F) Comparison of active membrane properties of small DRG neurons from WT and DKO mice in either basal or CFA‐inflamed state, including AP frequency, AP rheobase, AP threshold, AP amplitude and AP half‐width (n = 6–12). *P < 0.05, ****P < 0.0001, by one‐way ANOVA and Kruskal‐Wallis H test. Data are represented as mean ± S.E.M. See Table S2 (Supporting Information) for detailed statistical information. RMP, resting membrane potential; Rm, membrane resistance; Cm, membrane capacitance; AP, action potential.
Figure 5
Figure 5
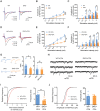
Efficacy of spinal synaptic transmission and plasticity is compromised in TRPC3/6 DKO mice. A) Schematic diagram showing whole‐cell patch‐clamp recording from spinal‐PAG projection neurons in spinal lamina I retrogradely labeled by DiI injection into contralateral ventrolateral PAG. B,C) Input‐output curves of C‐eEPSCs in spinal‐PAG projection neurons evoked by primary afferent stimulation at C‐fiber intensity from WT and TRPC3/6 DKO mice in the basal state. n = 7 for WT, n = 6 for DKO. *P < 0.05, ****P < 0.0001, by Friedman's M test for (B), Mann‐Whitney U test for (C). D–F) Time course (D), representative traces (E) and quantitative summary (F) of synaptic LTP induced by low‐frequency conditioning stimulation (LFS, 2 Hz, 3 mA) in WT and DKO mice. n = 10 for WT, n = 10 for DKO. **P < 0.01, ***P < 0.001, by Kruskal‐Wallis H test. G) Traces of typical recordings showing PPF or PPD of C‐ eEPSCs induced by pairs of pulses with an interval of 110 ms prior to and 30 min following LFS. H) Paired‐pulse ratio (PPR) prior to LFS is plotted against PPR at 30 min after LFS in WT and DKO mice. I) C‐eEPSCs recorded in WT mice showed clear change of PPR following LFS, which is significantly larger than DKO mice. n = 7–11. *P < 0.05, by two‐tailed unpaired t‐test. J) Schematic diagram showing fiber photometry recording in spinal dorsal horn excitatory neurons in response to electrical stimulation applied to its receptive field. K) Typical traces (upper panels) and heat map (lower panels) of calcium transients recorded in spinal excitatory neurons in response to a test electrical stimulation applied to the receptive field prior to and at 30 min after conditioning LFS in WT and DKO mice. L,M) Time course (L) and quantitative summary (M) of calcium transients prior to and after LFS in WT and DKO mice. n = 5 for WT, n = 5 for DKO. ****P < 0.0001, by one‐way ANOVA. Data are represented as mean ± S.E.M. See Table S2 (Supporting Information) for detailed statistical information. PPF, paired‐pulse facilitation; PPD, paired‐pulse depression.
Figure 6
Figure 6
TRPC3/6 facilitates activity‐dependent spinal functional plasticity under inflammatory pain states. A–C) Typical traces (A) and quantitative summary (B,C) of C‐eEPSCs in spinal lamina I projection neurons evoked by primary afferent stimulation in WT and DKO mice in the basal state. n = 11 for WT, n = 13 for DKO. *P < 0.05 by Friedman's M test in (B), *P < 0.05, **P < 0.01 by Mann‐Whitney U test in (C). D–F) Typical traces (D) and quantitative summary (E,F) of C‐eEPSCs in spinal‐PAG projection neurons evoked by primary afferent stimulation in WT and DKO mice at 24 h after CFA inflammation. n = 11 for WT, n = 13 for DKO. *P < 0.05, **P < 0.01 by two‐way ANOVA. G) Typical examples (left panels) and quantitative summary of PPF (right panels) of C‐eEPSCs recorded in WT and DKO mice in both basal and CFA‐inflamed state. n = 10 for WT, n = 10 for DKO. *P < 0.05 by Mann‐Whitney U test. H) Representative traces of mEPSCs recorded in CFA‐inflamed WT and DKO mice. I,J) Cumulative curves and quantitative summary for mEPSCs frequency (I) and amplitude (J) derived from CFA‐treated WT and DKO mice. n = 5 for WT, n = 5 for DKO. **P < 0.01, by two‐tailed unpaired t‐test. Data are represented as mean ± S.E.M. See Table S2 (Supporting Information) for detailed statistical information.
Figure 7
Figure 7
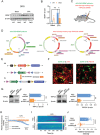
TRPC3/6 facilitates production and secretion of BDNF from primary sensory neurons upon inflammation. A,B) Typical example (A) and quantitative summary (B) showing levels of BDNF in L3‐L4 DRGs derived from WT and DKO mice prior to and at 24 h after CFA inflammation (n = 3 mice in each lane). *P < 0.05, **P < 0.01, by one‐way ANOVA. C) Scheme illustrating the experimental approach for imaging activity‐induced changes in BDNF‐pHluorin fluorescence from spinal terminals of nociceptors in SNS‐Cre and nociceptor‐specific TRPC3/6 knockdown mice. Nociceptor‐specific knockdown of TRPC3/6 is achieved via injection of Cre‐dependent AAV2/8 shTRPC3/6 into L3‐L4 DRGs in SNS‐Cre mice. D,E) Schematic diagram showing the construction of AAV2/8‐EF1a‐DIO‐BDNF‐pHluorin and Cre‐dependent AAV2/8 expressing shRNA TRPC3/6 (AAV2/8‐U6‐loxp‐CMV‐mcherry‐loxp‐shRNA TRPC3/6). F) Double immunofluorescence staining images showing colocalization of BDNF‐pHluorin (BDNF‐pH) puncta with the presynaptic marker synaptophysin (SYN), but juxtaposition with the postsynaptic marker PSD‐95. Scale bar: 5 µm. G) Western blot analysis with anti‐TRPC3 and anti‐TRPC6 antibody confirmed the efficient knockdown of TRPC3/6 by the above approach. **P < 0.01, by two‐tailed unpaired t‐ test. H–J) Sample traces (H), heat map (I) and quantitative summary (J) of BDNF‐pHluorin fluorescence changes evoked by LFS after intraganglionic injection of AAV2/8 conRNA and AAV2/8 shTRPC3/6 in SNS‐Cre mice. ****P < 0.0001, by two‐tailed unpaired t‐test. Data are represented as mean ± S.E.M. See Table S2 (Supporting Information) for detailed statistical information.
Figure 8
Figure 8
Marked defects in inflammatory pain hypersensitivity in nociceptor‐specific loss of TRPC3/6 as well as BDNF. A) Schematic illustration of expression of AAV2/8‐loxp‐shRNA TRPC3/6 in L3/L4 DRGs of SNS‐Cre mice for nociceptor‐ specific knockdown of TRPC3/6. B,C) Stimulus‐response curve (B) and mechanical response threshold (C) at different time points to von Frey hairs applied to the ipsilateral hindpaw following peripheral CFA inflammation in SNS‐Cre mice expressing shRNA TRPC3/6 and shRNA control. n = 5, ****P < 0.0001 at all‐time points for AAV‐conRNA versus basal, ††† P < 0.001, †††† P < 0.0001 at all‐time points for AAV‐shRNA TRPC3/6 versus AAV‐conRNA, by two‐way ANOVA. D) Schematic illustration of specific knockdown of BDNF in nociceptors via injection of AAV2/8‐loxp shRNA BDNF into L3/L4 DRGs of SNS‐Cre mice. E,F) Stimulus‐response curve (E) and mechanical threshold (F) at different time points to von Frey hairs applied to the ipsilateral hindpaw following CFA inflammation in SNS‐Cre mice expressing shRNA BDNF and shRNA control. n = 5, ****P < 0.0001 at all‐time points for AAV‐conRNA versus basal, †† P < 0.01, †††† P < 0.0001 at all‐time points for AAV‐shRNA BDNF versus AAV‐conRNA, by two‐way ANOVA. G,H) ELISA assay showing the increased production of bradykinin in the inflamed hindpaw (G) and lumbar DRGs (H) at different time points following CFA inflammation. n = 3, *P < 0.05, by two‐way unpaired t‐test. I,J) Representative immunoblots (I) and quantitative summary (J) showing the expression of TRPC3 and TRPC6 in the membrane fraction of DRG tissue after incubation with bradykinin for 1 h without and with the presence of B1 receptor antagonist, SSR240612 (10 µM) or B2 receptor antagonist, Icatibant (50 nM). Ica, Icatibant; SSR, SSR240612. K,L) Schematic illustration (K) and quantitative summary (L) showing that nociceptor‐specific knockdown of TRPC3/6 attenuates bradykinin‐induced spontaneous nociception. n = 5, ***P < 0.001, by two‐way unpaired t‐test. M,N) Representative traces (M) and quantitative summary (N) showing that BDNF‐induced synaptic potentiation is eliminated in TRPC3/6 DKO mice as compared to WT mice. n = 5–7, *P < 0.05, by Friedman's M test. O) Intervertebral foramen injection of TRPC3/6 antagonist, SAR7334 produced a dose‐dependent relief of CFA‐induced mechanical pain hypersensitivity in WT mice. n = 6, ****P < 0.0001 for Vehicle + CFA versus basal, ### P < 0.001, #### P < 0.0001 for SAR7334 + CFA versus Vehicle + CFA, by two‐way ANOVA. P) Upper panel showing whole‐cell patch clamp recordings from typical human small DRG neurons. Lower panels showing typical examples and quantitative summary showing that bath application of TRPC3/6 antagonist, SAR7334 (0.1 µM) largely attenuated the firing frequency induced by depolarizing current injection in small DRG neurons from BPA patients. n = 5, **P < 0.01, by paired t‐test. Scale bar: 50 µm. Q) A schematic model proposing how TRPC3/6 channels get recruited upon inflammation and mediates mechanical pain hypersensitivity via feed‐forward regulatory network (see text for details). Data are represented as mean ± S.E.M. See Table S2 (Supporting Information) for detailed statistical information.

References

    1. Costigan M., Scholz J., Woolf C. J., Annu. Rev. Neurosci. 2009, 32, 1. - PMC - PubMed
    1. Woolf C. J., Pain 2011, 152, S2. - PMC - PubMed
    1. Sandkühler J., Brain 2015, 138, 2463. - PubMed
    1. Luo C., Kuner T., Kuner R., Trends. Neurosci. 2014, 37, 343. - PubMed
    1. Abraira V. E., Ginty D. D., Neuron 2013, 79, 618. - PMC - PubMed

LinkOut - more resources