. 2024 Oct:108:105354.
doi: 10.1016/j.ebiom.2024.105354. Epub 2024 Sep 27.

Ultrapotent class I neutralizing antibodies post Omicron breakthrough infection overcome broad SARS-CoV-2 escape variants

Affiliations

Ultrapotent class I neutralizing antibodies post Omicron breakthrough infection overcome broad SARS-CoV-2 escape variants

Mengxiao Luo et al. EBioMedicine. 2024 Oct.

Abstract

Background: The spread of emerging SARS-CoV-2 immune escape sublineages, especially JN.1 and KP.2, has resulted in new waves of COVID-19 globally. The evolving memory B cell responses elicited by the parental Omicron variants to subvariants with substantial antigenic drift remain incompletely investigated.

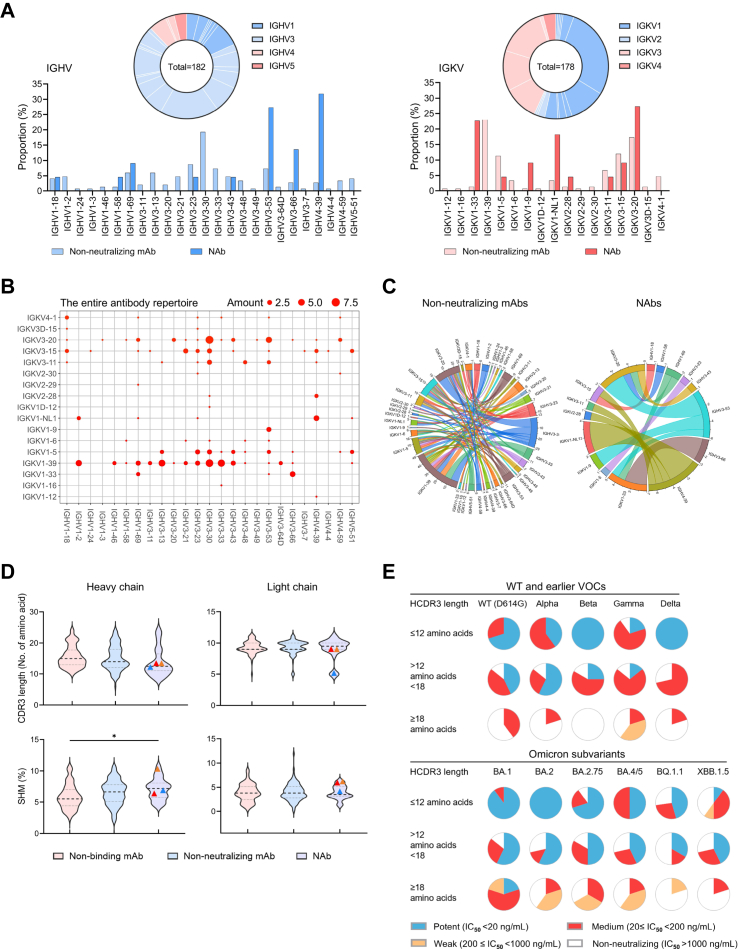
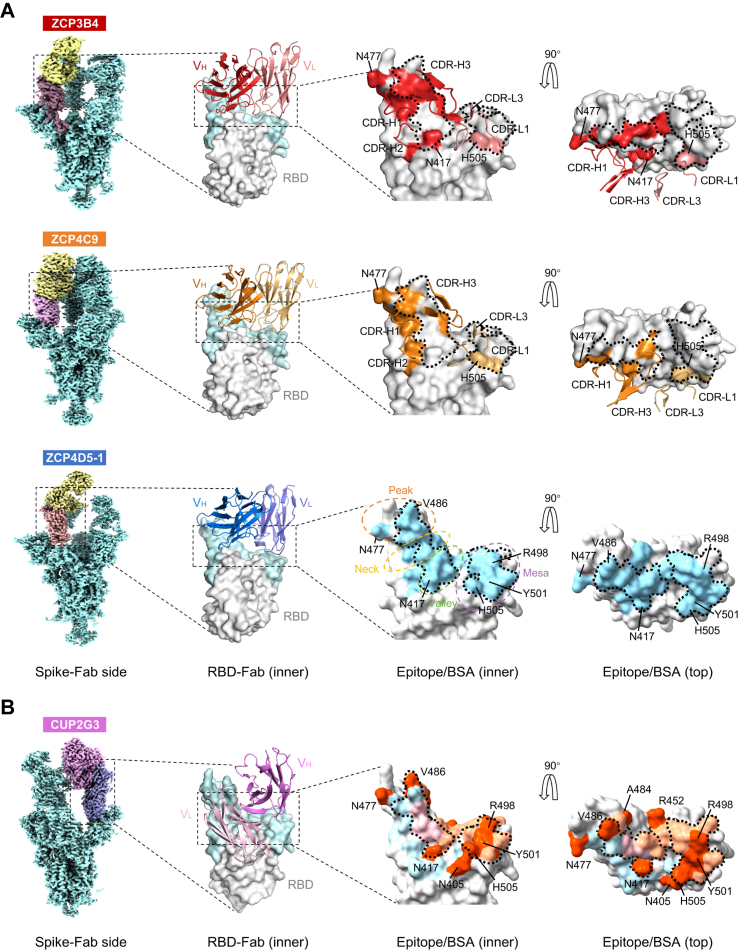
Methods: Using the single B cell antibody cloning technology, we isolated single memory B cells, delineated the B cell receptor repertoire and conducted the pseudovirus-based assay for recovered neutralizing antibodies (NAb) screening. We analyzed the cryo-EM structures of top broadly NAbs (bnAbs) and evaluated their in vivo efficacy (golden Syrian hamster model).

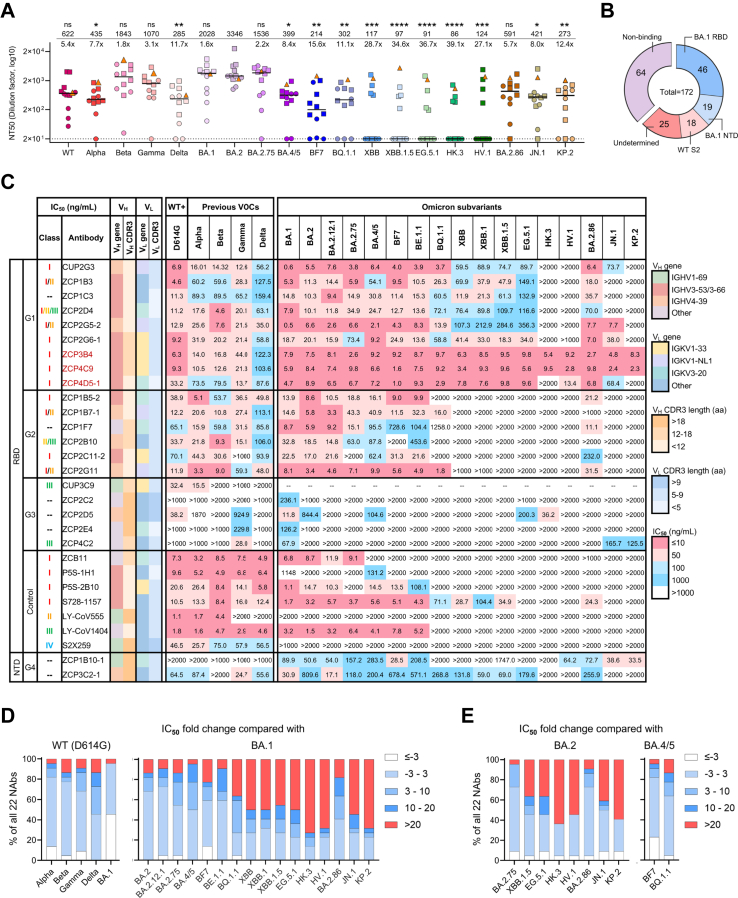
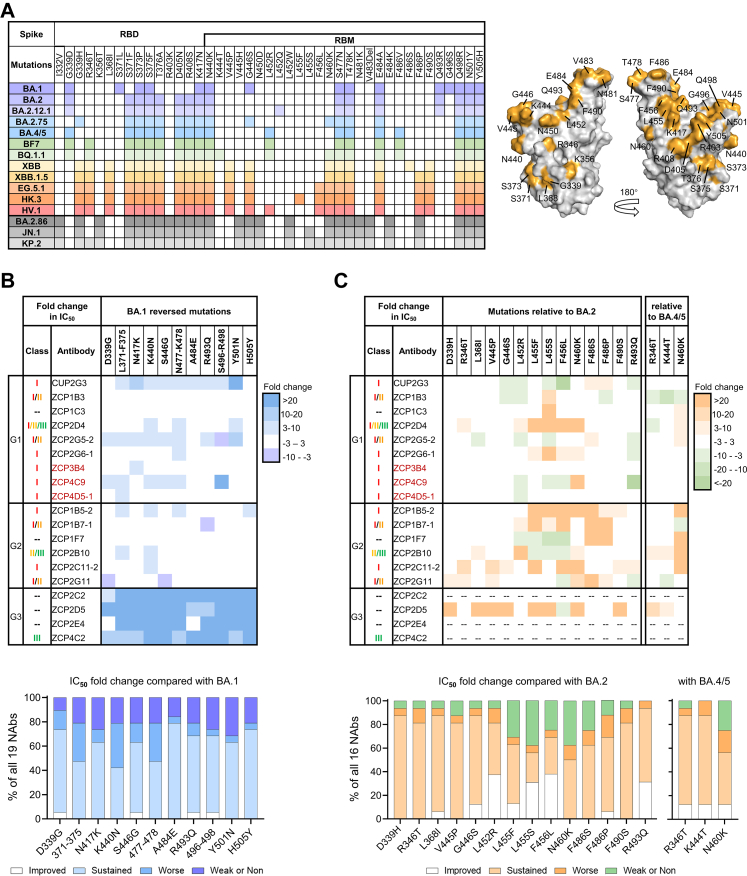
Findings: By investigating the evolution of human B cell immunity, we discovered a new panel of bnAbs arising from vaccinees after Omicron BA.2/BA.5 breakthrough infections. Two lead bnAbs neutralized major Omicron subvariants including JN.1 and KP.2 with IC50 values less than 10 ng/mL, representing ultrapotent receptor binding domain (RBD)-specific class I bnAbs. They belonged to the IGHV3-53/3-66 clonotypes instead of evolving from the pre-existing vaccine-induced IGHV1-58/IGKV3-20 bnAb ZCB11. Despite sequence diversity, they targeted previously unrecognized, highly conserved conformational epitopes in the receptor binding motif (RBM) for ultrapotent ACE2 blockade. The lead bnAb ZCP3B4 not only protected the lungs of hamsters intranasally challenged with BA.5.2, BQ.1.1 and XBB.1.5 but also prevented their contact transmission.

Interpretation: Our findings demonstrated that class I bnAbs have evolved an ultrapotent mode of action protecting against highly transmissible and broad Omicron escape variants, and their epitopes are potential targets for novel bnAbs and vaccine development.

Funding: A full list of funding bodies that contributed to this study can be found in the Acknowledgements section.

Keywords: Broadly neutralizing antibody; Omicron breakthrough infection; Prevention of XBB.1.5 transmission; SARS-CoV-2; Structural fitness of antibody.


Conflict of interest statement

Declaration of interests The other authors declare no competing interests.

Figures

Fig. 1
Fig. 1
Isolation of cross-reactive NAbs from convalescents after Omicron BA.2/BA.5 breakthrough infection. (A) Neutralization of pseudotyped SARS-CoV-2 WT and 18 variants by sera from a cohort of convalescents (n = 12). Neutralizing titer 50 (NT50) values represent the plasma dilution required to achieve 50% virus neutralization. The limit of detection is 20 (dash line). The triangle, squares and dots represent ZC (BNT162b), 6 CUs (BNT162b2) and 5 CUs (Sinovac), respectively, with a line indicating the median of each group. Geometric mean NT50 values are shown upon the symbols, and the fold reduction in geometric mean NT50 values for WT and each variant compared to BA.2 is also shown. Comparisons were made by Kruskal–Wallis test followed by Dunn's multiple comparisons test. ∗p < 0.05; ∗∗p < 0.01; ∗∗∗p < 0.001; ∗∗∗∗p < 0.0001; ns (not significant), p > 0.05. (B) Epitope specificity of 172 recovered mAbs as determined by ELISA. (C) Neutralization profiles of 22 newly identified NAbs against SARS-CoV-2 WT (D614G), previous VOCs and Omicron subvariants. IC50 values of all tested NAbs against the whole panel of pseudoviruses are summarized in the graph. The top three ultrapotent bnAbs are highlighted in red. Published NAb controls from class I-IV (ZCB11, P5S-1H1, P5S-2B10, S728-1157, LY-CoV555, LY-CoV1404 and S2X259) are included. The neutralizing potency is indicated according to the color bar. The antibody germline gene usage (IGHV and IGKV) and the length of CDR3 are also presented. aa, amino acid. (D) Fold changes in IC50 values of 22 NAbs against previous VOCs including Alpha, Beta, Gamma, Delta and Omicron BA.1 compared with the WT (D614G) (left), or against Omicron subvariants compared to BA.1 (right). (E) Fold changes in IC50 values of 22 NAbs against Omicron BA.2.75, XBB.1.5, HK.3, HV.1, EG.5.1, BA.2.86, JN.1 and KP.2, compared to ancestral BA.2 (left), or against BF7 and BQ.1.1 compared with ancestral BA.4/5 (right).
Fig. 2
Fig. 2
Immunogenetic properties of the antibody repertoire induced by Omicron breakthrough infection. (A) Antibody gene repertoire analysis of reactive memory B cells derived from 12 convalescent individuals. In pie charts, the number of all cloned antibody V genes is shown in the center for the heavy (left) or light chains (right). The colors represent variable gene families, and each fragment of the same color stands for one specific sub-family. The histograms summarize the IGHV (left) and IGKV (right) gene usage of 172 recovered mAbs, including 150 non-neutralizing mAbs (non-NAbs) and 22 NAbs, labeled in light and dark colors, respectively. (B and C) Parings of germline heavy and light V genes display preference among NAbs. (B) IGHV and IGKV pairings of 172 recovered mAbs are presented in the bubble diagram and (C) the diversity between non-NAbs and NAbs is indicated in chord diagrams. The outer circle border indicates the number of each pairing. (D) Comparison of CDR3 lengths and SHM rates between recovered non-binding mAbs (n = 64), non-NAbs (n = 86) and NAbs (n = 22). Amino acid lengths and SHM rates compared to germline sequences are presented in violin plots with kernel density estimation curves of the distribution. A dash line and two dotted lines indicate the median and quartiles of each group, respectively. bnAbs ZCP3B4 (red), ZCP4C9 (orange) and ZCP4D5-1 (blue) are presented by symbols. Comparisons were made by one-way ANOVA followed by Tukey's multiple comparisons test. ∗p < 0.05. (E) Neutralizing potency distribution of 22 NAbs against WT (D614G), earlier VOCs and Omicron subvariants. The NAbs are grouped according to their overall CDR-H3 amino acid (aa) lengths as follows: short (≤12 aa, upper panel), intermediate (12–18 aa, mid panel), or long (≥18 aa, lower panel).
Fig. 3
Fig. 3
Inference of Omicron RBD mutation hotspots on NAb neutralization and evasion. (A) Specific RBD mutations carried by each Omicron subvariant. Mutation sites are colored on the WT RBD (PDB: 7B3O) (right). (B) Fold changes in IC50 values against BA.1 individual reversed mutations compared with BA.1. 19 anti-BA.1 NAbs in group1-3 were tested (top). Ranges are indicated according to the color bar. The top three ultrapotent bnAbs are highlighted in red. Impact of individual reversed mutations on tested NAbs potency as determined by proportions of improved (IC50 fold change < -3), sustained (−3≤ IC50 fold change ≤3), worse (3 < IC50 fold change ≤10) and weak/non (IC50 fold change >10) NAbs (bottom). (C) Fold changes in IC50 values against related convergent mutations compared with BA.2 or BA.4/5. 16 anti-BA.2/BA.4/5 NAbs in group1-3 were tested (top). Ranges are indicated according to the color bar. The top three ultrapotent bnAbs are highlighted in red. Impact of individual convergent mutations on tested NAbs potency as determined by proportions of improved (IC50 fold change < -3), sustained (−3≤ IC50 fold change ≤3), worse (3 < IC50 fold change ≤10) and weak/non (IC50 fold change >10) NAbs (bottom).
Fig. 4
Fig. 4
Structural basis for class I bnAbs ZCP3B4, ZCP4C9, ZCP4D5-1 and CUP2G3. (A) Binding modes and footprints of ZCP3B4, ZCP4C9 and ZCP4D5-1. Cryo-EM density maps of BA.5 spike trimers in complex with bnAb Fabs are shown in the side views. ‘Up’ RBDs of complexes are colored in dark brown (ZCP3B4), purple (ZCP4C9) and light orange (ZCP4D5-1), whereas bnAb Fabs are colored in yellow. The cartoons represent the structures of bnAb heavy chain and light chain variable regions (VH and VL) binding RBD (gray), viewed from the RBD inner face. The receptor binding motif (RBM) is colored in light cyan. HCDRs and LCDRs of ZCP3B4 and ZCP4C9 involved in the interaction are shown in the zoom-in figures. Epitopes of ZCP3B4 and ZCP4C9 and the buried surface area (BSA) of ZCP4D5-1 are shown in corresponding colors on the RBD surface viewed from the inner and top faces. BA.5 mutation sites involved in epitopes/BSA are also indicated. The RBM is topologically divided into ‘peak’, ‘neck’, ‘valley’ and ‘mesa’ subsections. The ACE2 binding site is outlined with dotted lines. PDB codes: 8K19 (BA.5 RBD-ZCP3B4 Fab) and 8K18 (BA.5 RBD-ZCP4C9 Fab). (B) Binding mode and footprint of CUP2G3. Cryo-EM density map of BA.5 spike trimer in complex with CUP2G3 Fabs is shown in the side view. The ‘up’ RBD of complex is colored in purple and Fab is in pink. The cartoon represents the structure of CUP2G3 heavy chain and light chain variable regions (VH and VL) binding RBD (gray), viewed from the RBD inner face. The receptor binding motif (RBM) is colored in light cyan. The buried surface areas (BSA) buried by VH (light orange), VL (light blue) and both (pink) are viewed from the inner and top faces. BA.5 mutation sites involved in the BSA are colored in orange. The ACE2 binding site is outlined with dotted lines.
Fig. 5
Fig. 5
Prophylactic efficacy of ZCP3B4, ZCP4C9 and ZCP4D5-1 against authentic Omicron BA.5.2, BQ.1.1 and XBB.1.5 in golden Syrian hamsters. (A) Experimental schedule and color coding for different treatment groups. Four groups of female hamsters received a single intraperitoneal injection of PBS (n = 6), 4.5 mg/kg of ZCP3B4 (n = 5), ZCP4C9 (n = 5) or ZCP4D5-1 (n = 5) one day before viral infection (−1 dpi). 24 h later (day 0), each group was challenged intranasally with a mixture of live Omicron BA.5.2, BQ.1.1 and XBB.1.5 (105 PFU/hamster). All animals were sacrificed on day 4 for final analysis. (B) Proportion of viral RNA copies in lungs and nasal turbinate (NT) homogenates of each group. The data is shown as mean ± SEM. (C) Daily body weight change of each group was measured after the viral infection. The data is shown as mean ± SEM. (D) Live viral plaque assay was used to quantify the number of infectious viruses in lungs and NT of each group. Log10-transformed plaque-forming unit (PFU) per mL was shown for each group. The dash line indicates the limit of detection. Each symbol represents an individual hamster with a line indicating the mean of each group. Statistics were generated using one-way ANOVA followed by Tukey's multiple comparisons test. ∗∗p < 0.01, ∗∗∗p < 0.001, ∗∗∗∗p < 0.0001; ns (not significant), p > 0.05. (E) Representative histopathology of lung tissues and NT from pre-treated hamsters after viral challenge. Tissue sections were stained with hematoxylin and eosin (H&E). For PBS-treated hamsters, the infection could cause lung damage with alveolar septa thickening (black arrow), extensive inflammatory cell accumulation (blue arrow), homogeneously pink foci of edema (green arrow), and multifocal hemorrhage (red arrow). In NT, submucosal immune cell accumulation (blue arrow) as well as damage to the respiratory and olfactory epithelium (black arrow) are also indicated. The resolution is indicated by the scale bar.
Fig. 6
Fig. 6
Efficacy of ZCP3B4 in preventing authentic Omicron BA.5.2, BQ.1.1 and XBB.1.5 transmission in golden Syrian hamsters. (A) Experimental schedule and color coding for different treatment groups. Index hamsters (male, n = 6) were challenged intranasally with a mixture of live Omicron BA.5.2, BQ.1.1 and XBB.1.5 (105 PFU/hamster) two days prior to the co-housing (day 0). On 2 dpi, two groups of male hamsters were administered intranasally with PBS (n = 6) or 4.5 mg/kg of ZCP3B4 (n = 6) 8 h before being co-housed with index hamsters at a 2:1 ratio. 4 h after the co-housing, index hamsters were sacrificed, whereas PBS- and ZCP3B4-treated hamsters were separated and sacrificed on day 4 for final analysis. (B) Live viral plaque assay was used to quantify the number of infectious viruses in lungs and nasal turbinate (NT) homogenates of each group. Log10-transformed plaque-forming unit (PFU) per mL was shown for each group. The dash line indicates the limit of detection. Each symbol represents an individual hamster with a line indicating the mean of each group. Statistics were generated using one-way ANOVA followed by Tukey's multiple comparisons test. ∗∗p < 0.01, ∗∗∗p < 0.001, ∗∗∗∗p < 0.0001. (C) Representative histopathology of lung tissues and NT from index and pre-treated hamsters after the co-housing. Tissue sections were stained with hematoxylin and eosin (H&E). For index and PBS-treated hamsters, the infection could cause lung damage with alveolar septa thickening (black arrow), extensive inflammatory cell accumulation (blue arrow), homogeneously pink foci of edema (green arrow), and multifocal hemorrhage (red arrow). In NT, submucosal immune cell accumulation (blue arrow) as well as damage to the respiratory and olfactory epithelium (black arrow) are also indicated. The resolution is indicated by the scale bar. (D) Representative images of infected cells in NT from index and pre-treated hamsters after the co-housing. Viral nucleocapsid protein (NP) was stained in green by immunofluorescence staining and cell nuclei were stained in blue with DAPI. The scale bar represents 100 μm.

References

    1. Zhou D., Zhou R., Chen Z. Human neutralizing antibodies for SARS-CoV-2 prevention and immunotherapy. Immunother Adv. 2022;2(1) - PMC - PubMed
    1. Zhou R., To K.K., Wong Y.C., et al. Acute SARS-CoV-2 infection impairs dendritic cell and T cell responses. Immunity. 2020;53(4):864–877.e5. - PMC - PubMed
    1. Liu L., To K.K., Chan K.H., et al. High neutralizing antibody titer in intensive care unit patients with COVID-19. Emerg Microb Infect. 2020;9(1):1664–1670. - PMC - PubMed
    1. Wajnberg A., Amanat F., Firpo A., et al. Robust neutralizing antibodies to SARS-CoV-2 infection persist for months. Science. 2020;370(6521):1227–1230. - PMC - PubMed
    1. Polack F.P., Thomas S.J., Kitchin N., et al. Safety and efficacy of the BNT162b2 mRNA Covid-19 vaccine. N Engl J Med. 2020;383(27):2603–2615. - PMC - PubMed

Supplementary concepts