

Bifidobacterium longum and microbiome maturation modify a nutrient intervention for stunting in Zimbabwean infants
- PMID: 39341154
- PMCID: PMC11467582
- DOI: 10.1016/j.ebiom.2024.105362
Bifidobacterium longum and microbiome maturation modify a nutrient intervention for stunting in Zimbabwean infants
Abstract
Background: Small-quantity lipid-based nutrient supplements (SQ-LNS), which has been widely tested to reduce child stunting, has largely modest effects to date, but the mechanisms underlying these modest effects are unclear. Child stunting is a longstanding indicator of chronic undernutrition and it remains a prevalent public health problem. The infant gut microbiome may be a key contributor to stunting; and mother and infant fucosyltransferase (FUT) phenotypes are important determinants of infant microbiome composition.
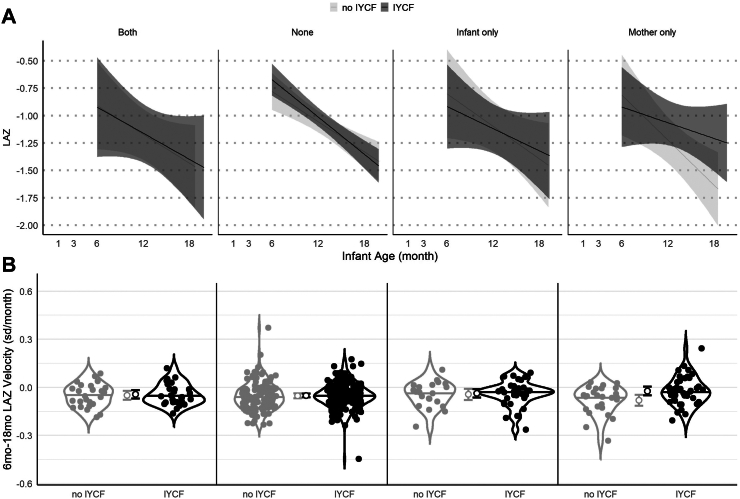
Methods: We investigated whether mother-infant FUT status (n = 792) and infant gut microbiome composition (n = 354 fecal specimens from 172 infants) modified the impact of an infant and young child feeding (IYCF) intervention, that included SQ-LNS, on stunting at age 18 months in secondary analysis of a randomized trial in rural Zimbabwe.
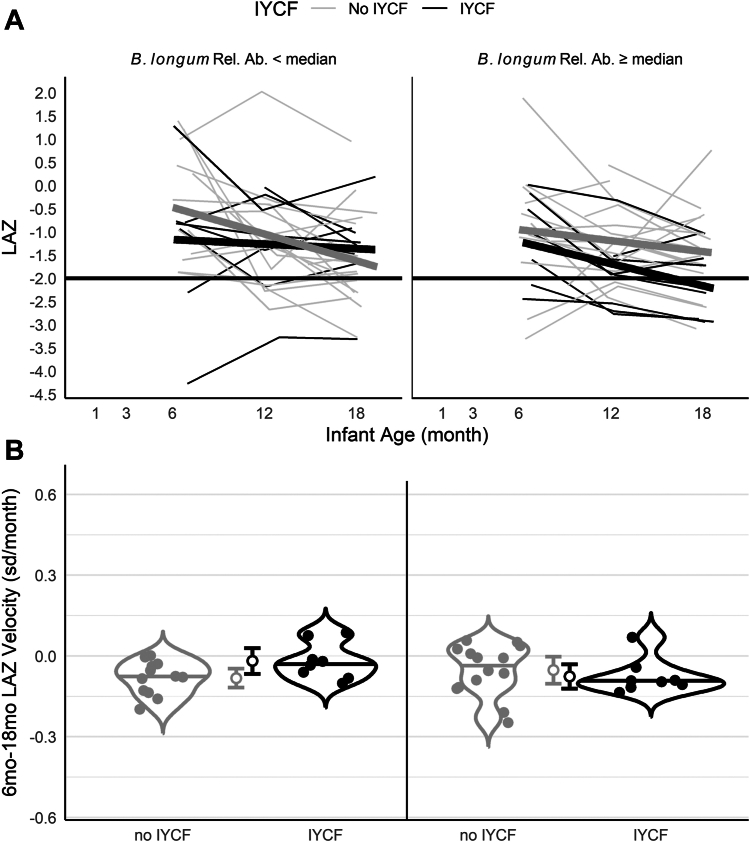
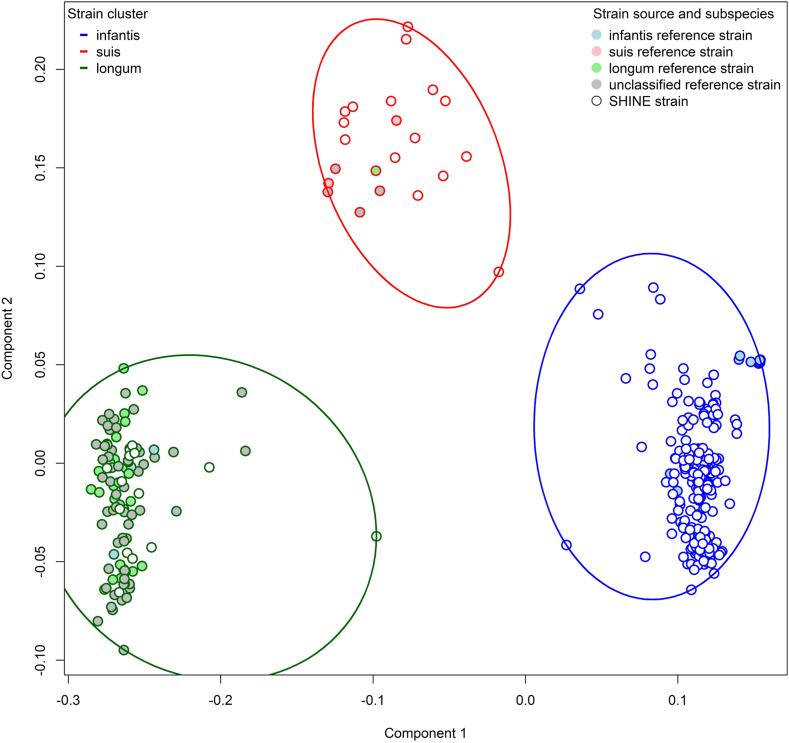
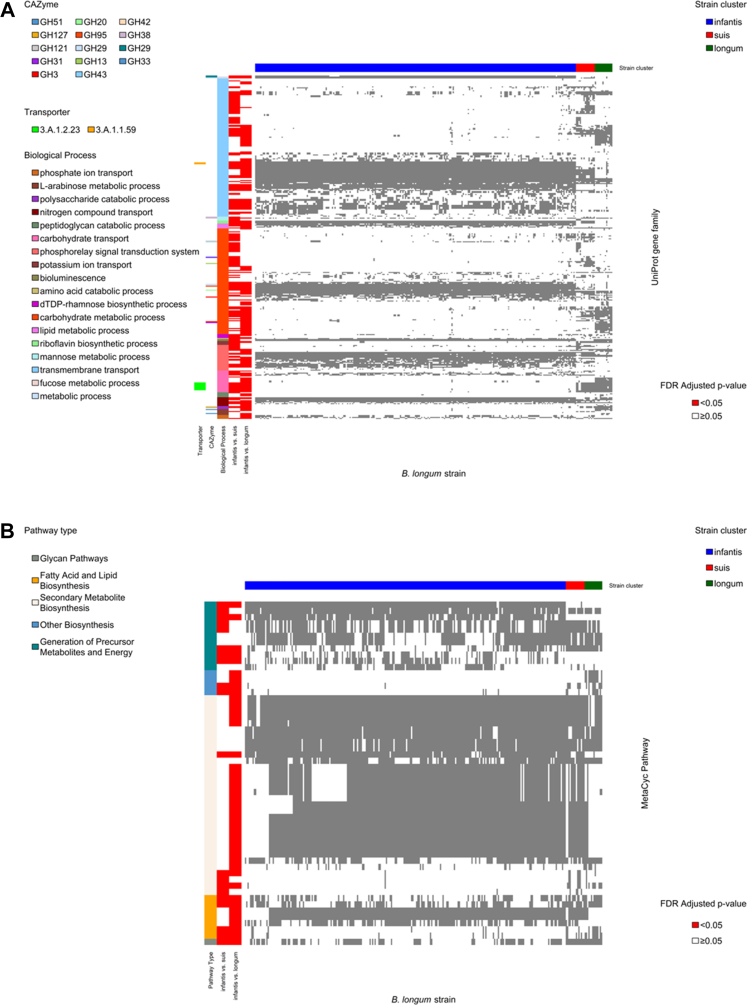
Findings: We found that the impact of the IYCF intervention on stunting was modified by: (i) mother-infant FUT2+/FUT3- phenotype (difference-in-differences -32.6% [95% CI: -55.3%, -9.9%]); (ii) changes in species composition that reflected microbiome maturation (difference-in-differences -68.1% [95% CI: -99.0%, -28.5%); and (iii) greater relative abundance of B. longum (differences-in-differences 49.1% [95% CI: 26.6%, 73.6%]). The dominant strains of B. longum when the intervention started were most similar to the proficient milk oligosaccharide utilizer subspecies infantis, which decreased with infant age and differed by mother-infant FUT2+/FUT3- phenotypes.
Interpretation: These findings indicate that a persistently "younger" microbiome at initiation of the intervention reduced its benefits on stunting in areas with a high prevalence of growth restriction.
Funding: Bill and Melinda Gates Foundation, UK DFID/Aid, Wellcome Trust, Swiss Agency for Development and Cooperation, US National Institutes of Health, UNICEF, and Nutricia Research Foundation.
Keywords: Infant; Metagenome; Microbiome; Nutrition; Stunting.
Copyright © 2024 The Author(s). Published by Elsevier B.V. All rights reserved.
Conflict of interest statement
Declaration of interests AJP was supported by Wellcome Trust grant 108065/Z/15/Z. ARM was supported by Bill & Melinda Gates Foundation grant OPP1021542 and OPP1143707, with a subcontract to the University of British Columbia 20R25498 EKG was supported by The Nutricia Research Foundation grant 2021-52. T.J.E. was paid a scientific consulting fee in relation to the analysis of the data presented here by the Zvitambo Institute for Maternal and Child Health Research. RCR declares remittance from Abbott Nutrition Health Institute and Nutricia for public conference talks outside of the submitted work in the past 36 months. All other authors declare that they have no competing interests.
Figures
Update of
-
Bifidobacterium longum modifies a nutritional intervention for stunting in Zimbabwean infants.medRxiv [Preprint]. 2024 Mar 4:2024.01.18.24301438. doi: 10.1101/2024.01.18.24301438. medRxiv. 2024. Update in: EBioMedicine. 2024 Oct;108:105362. doi: 10.1016/j.ebiom.2024.105362. PMID: 38293149 Free PMC article. Updated. Preprint.
References
-
- United Nations Children’s Fund, World Health Organization, The World Bank . United Nations Children’s Fund (UNICEF), World Health Organization, International Bank for Reconstruction and Development/The World Bank; 2019. Levels and trends in child malnutrition: key findings of the 2019 edition of the joint child malnutrition estimates – UNICEF regions.
-
- WHO Multicentre Growth Reference Study Group WHO Child Growth Standards based on length/height, weight and age. Acta Paediatr Suppl. 2006;450:76–85. - PubMed
MeSH terms
Substances
LinkOut - more resources
Full Text Sources
Medical
