. 2024 Nov;300(11):107829.
doi: 10.1016/j.jbc.2024.107829. Epub 2024 Sep 27.

Plasmodium berghei HMGB1 controls the host immune responses and splenic clearance by regulating the expression of pir genes

Affiliations

Plasmodium berghei HMGB1 controls the host immune responses and splenic clearance by regulating the expression of pir genes

Pradeep Mini Vaishalli et al. J Biol Chem. 2024 Nov.

Abstract

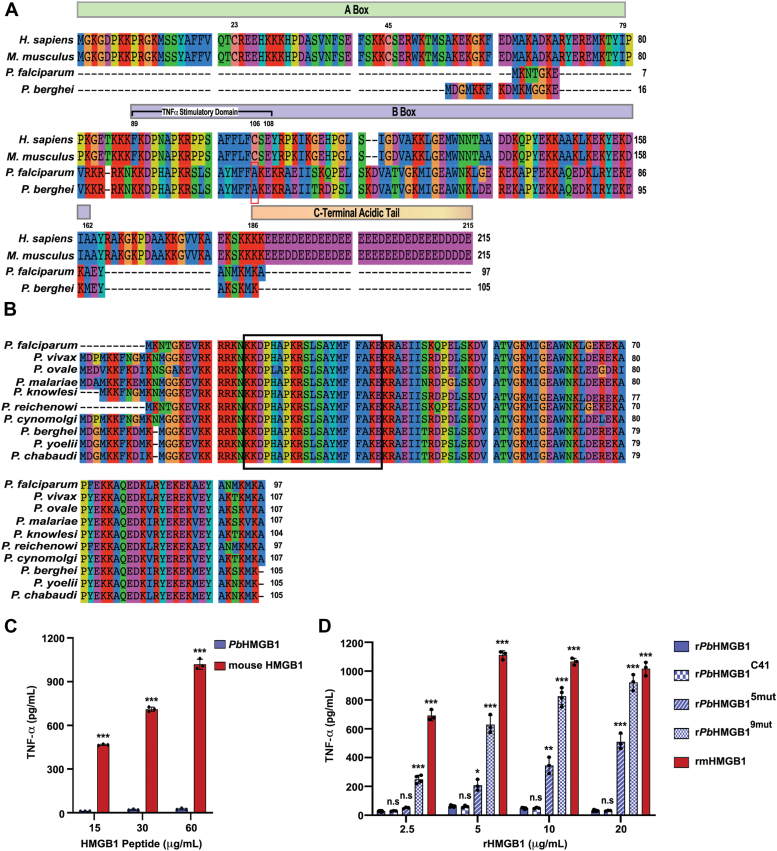
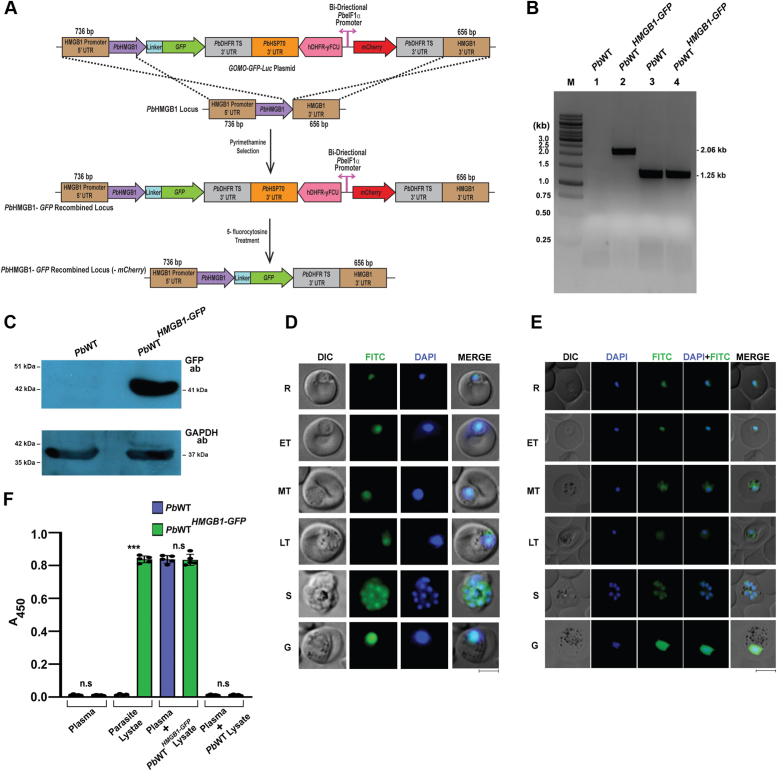
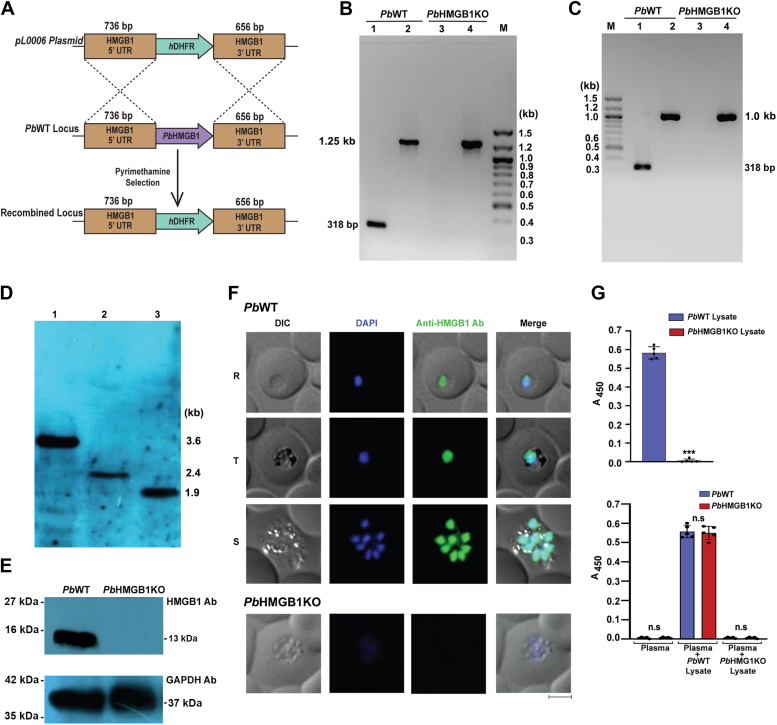
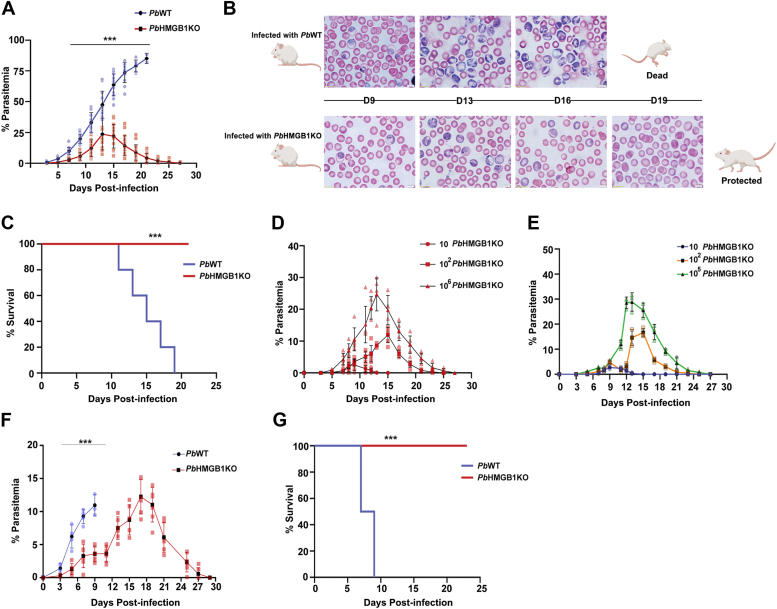
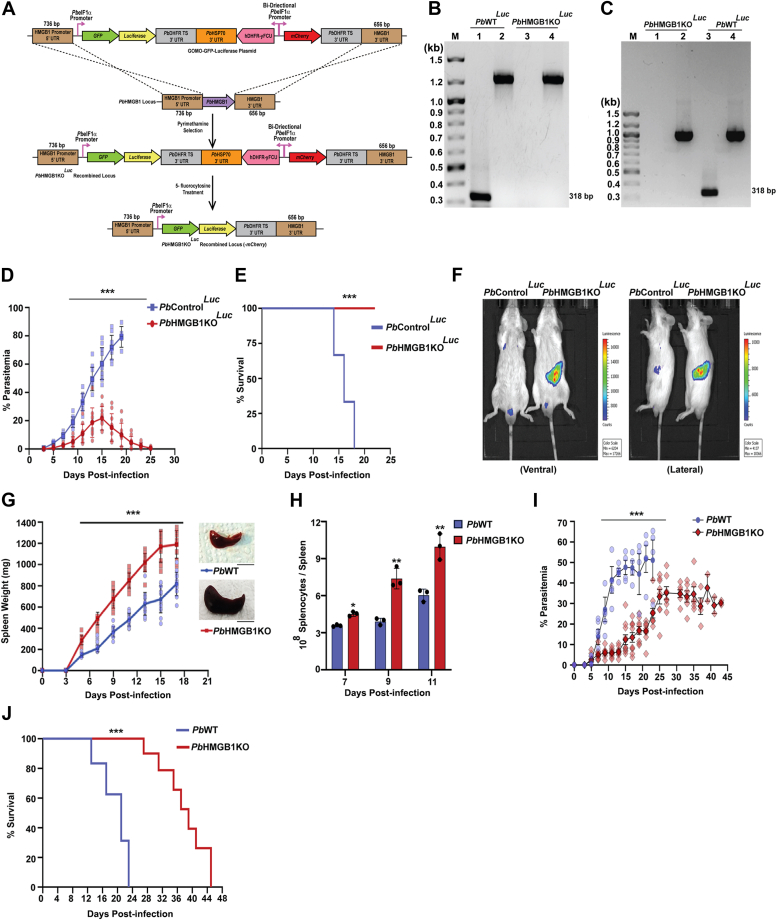
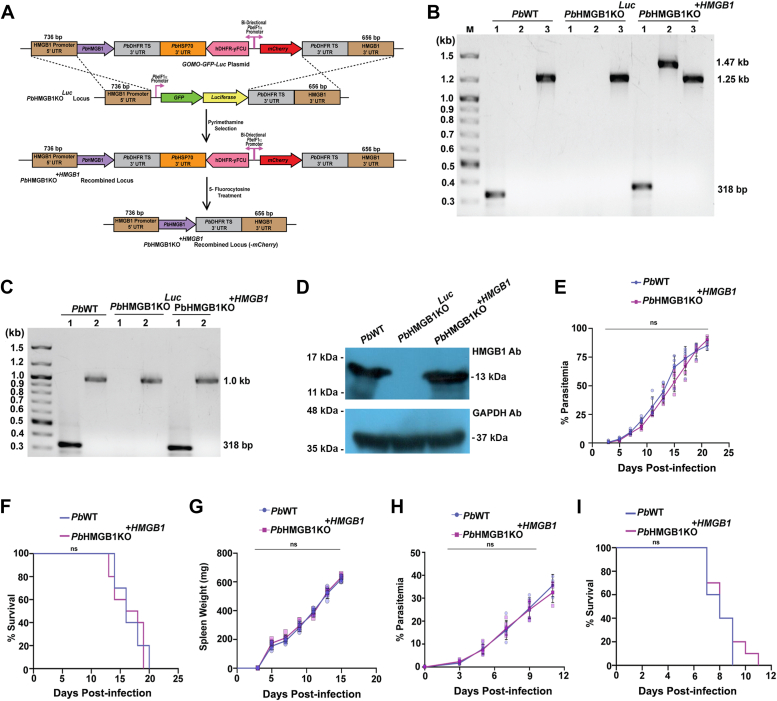
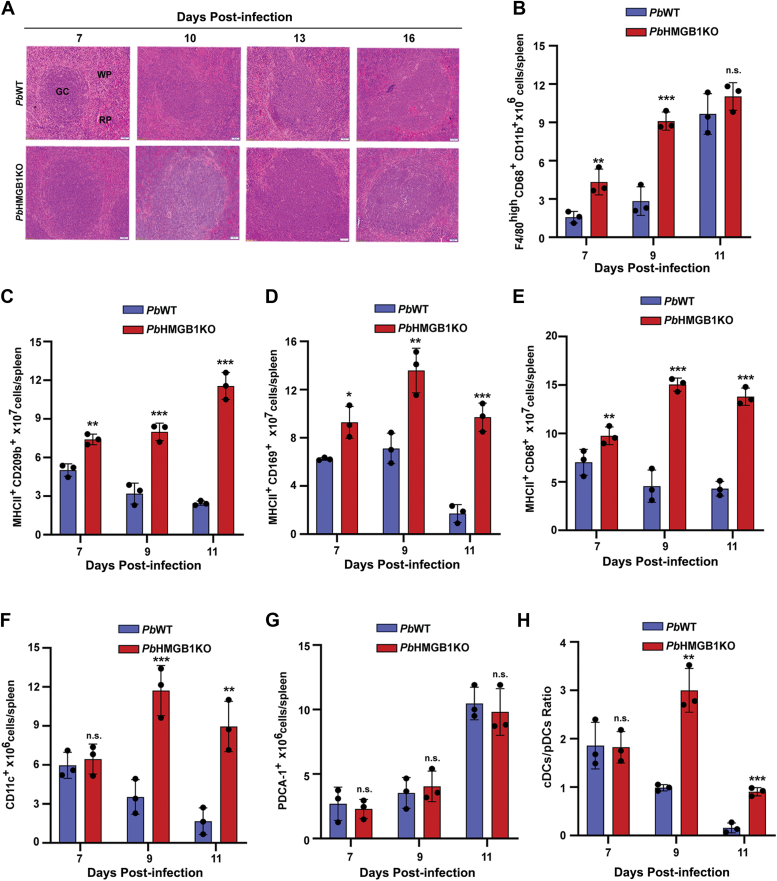
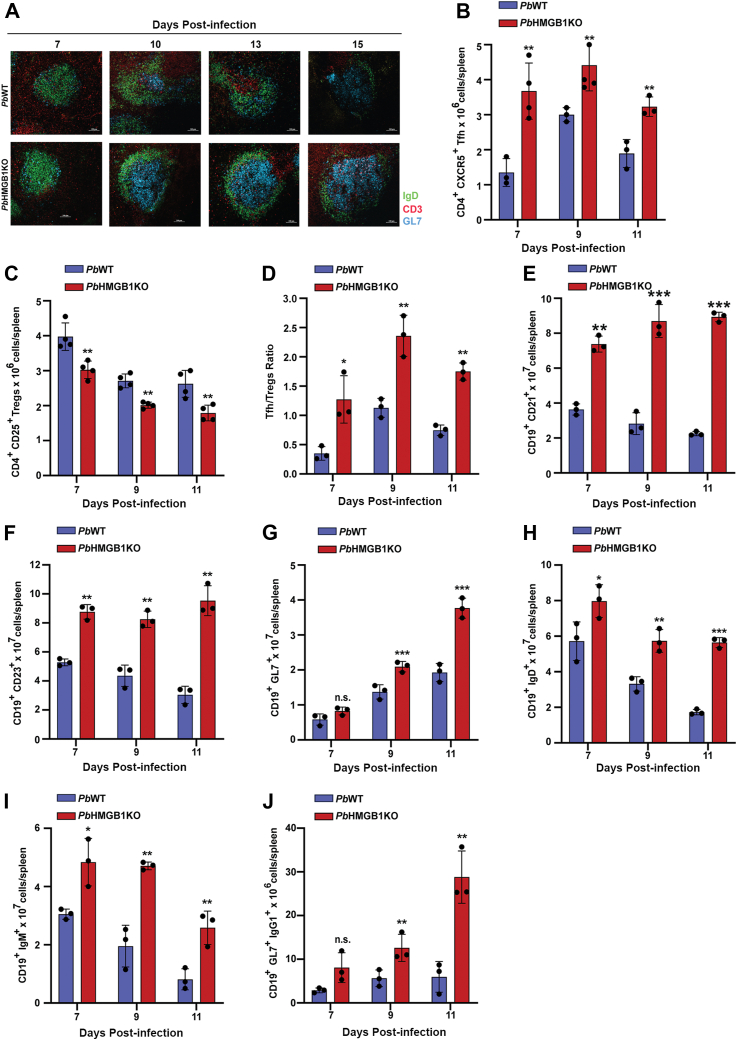
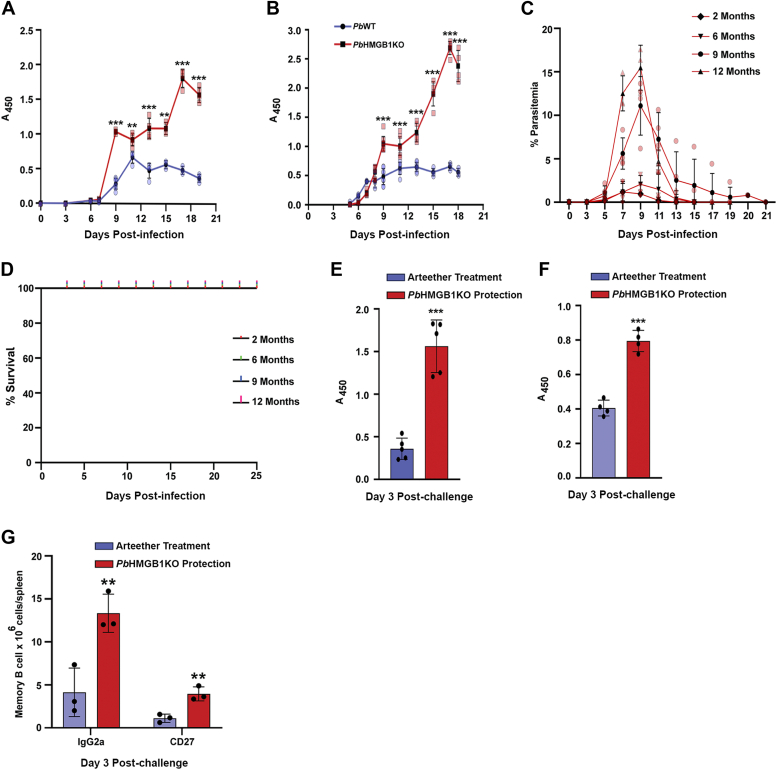
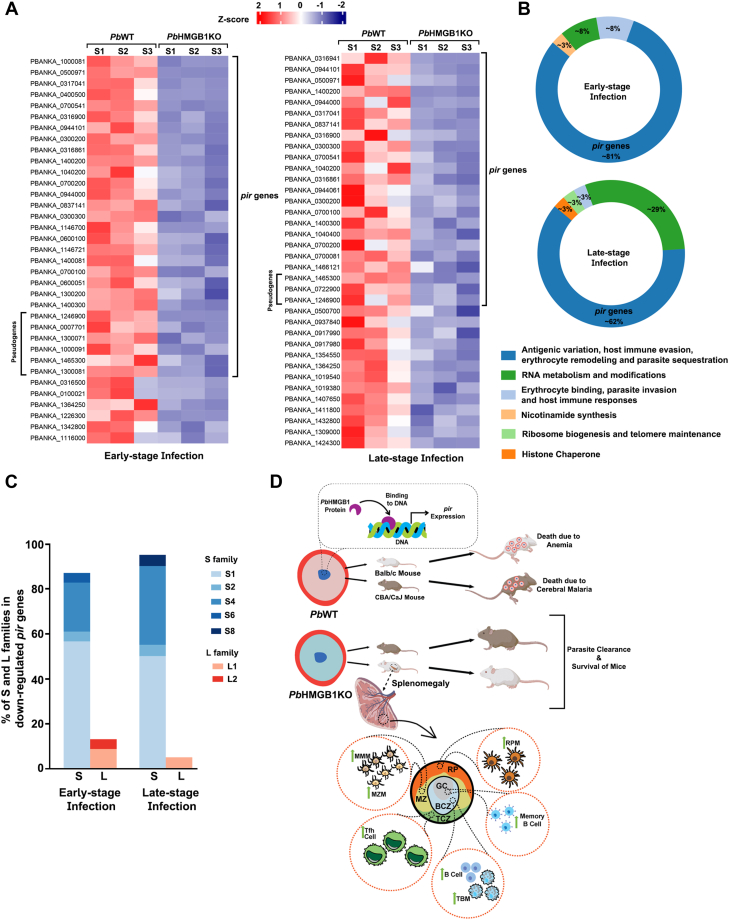
High mobility group box (HMGB) proteins belong to the high mobility group (HMG) superfamily of non-histone nuclear proteins that are involved in chromatin remodeling, regulation of gene expression, and DNA repair. When extracellular, HMGBs serve as alarmins inducing inflammation, and this is attributed to the proinflammatory activity of box B. Here, we show that Plasmodium HMGB1 has key amino acid changes in box B resulting in the loss of TNF-α stimulatory activity. Site-directed mutagenesis of the critical amino acids in box B with respect to mouse HMGB1 renders recombinant Plasmodium berghei (Pb) HMGB1 capable of inducing TNF-α release. Targeted deletion of PbHMGB1 and a detailed in vivo phenotyping show that PbHMGB1 knockout (KO) parasites can undergo asexual stage development. Interestingly, Balb/c mice-infected with PbHMGB1KO parasites display a protective phenotype with subsequent clearance of blood parasitemia and develop long-lasting protective immunity against the challenges performed with Pb wildtype parasites. The characterization of splenic responses shows prominent germinal centers leading to effective humoral responses and enhanced T follicular helper cells. There is also complete protection from experimental cerebral malaria in CBA/CaJ mice susceptible to cerebral pathogenesis with subsequent parasite clearance. Transcriptomic studies suggest the involvement of PbHMGB1 in pir expression. Our findings highlight the gene regulatory function of parasite HMGB1 and its in vivo significance in modulating the host immune responses. Further, clearance of asexual stages in PbHMGB1KO-infected mice underscores the important role of parasite HMGB1 in host immune evasion. These findings have implications in developing attenuated blood-stage vaccines for malaria.

Keywords: HMGB1; gene knockout; host immune evasion; inflammation; malaria; parasite; parasite clearance; pathogenesis; recombinant protein expression; site-directed mutagenesis.


Conflict of interest statement

Conflict of interest The authors declare that they have no conflicts of interest with the contents of this article.

Figures

Figure 1
Figure 1
Sequence comparison of parasite HMGB1 and the lack of TNF-α stimulatory activity.A, multiple protein sequence alignment of mouse, human, Pf and Pb HMGB1. The alignment shows the absence of A box and C-terminal acidic tail in Plasmodia HMGB1. The cysteine residues Cys23 and Cys45 present in the A box, and Cys106 present in the B box of mammalian (mouse and human) HMGB1 are highlighted with their respective numbers. The TNF-α stimulatory domain of mammalian HMGB1 (89–108 amino acids) and the corresponding sequence in Plasmodia HMGB1 are shown. The presence of indigenous Ala in the Plasmodia HMGB1 sequence corresponding to the TNF-α stimulatory domain of mammalian HMGB1 is highlighted in red box. B, multiple protein sequence alignment of Plasmodia HMGB1 infecting humans, rodents and primates. The 20 amino acid sequence in Plasmodia HMGB1 that corresponds to TNF-α stimulatory domain of mammalian HMGB1 is highlighted in a box. The respective sequence is conserved across the represented Plasmodium species with almost 100% identity. Multiple protein sequence alignments were carried out with SeaView Version 5.0.5 (https://doua.prabi.fr/software/seaview). C, treatment of murine macrophage-like RAW 264.7 cell line with the synthetic peptide of mouse HMGB1 representing TNF-α stimulatory domain of 20 amino acid length and the corresponding synthetic peptide of PbHMGB1. After 12 h of treatment, ELISA was performed with the culture supernatants to estimate the levels of TNF-α secretion. The data (mean ± SD) represent three independent experiments (∗∗∗p < 0.001, unpaired t test; two-tailed). D, treatment of murine macrophage-like RAW 264.7 cell line with rPbHMGB1, rPbHMGB1C41, rPbHMGB15mut, rPbHMGB19mut and rmHMGB1. After 12 h of treatment, ELISA was performed with the culture supernatants to estimate the levels of TNF-α secretion. The data (mean ± SD) represent at least three independent experiments. (n.s.- not significant, ∗p < 0.05, ∗∗p < 0.01, ∗∗∗p < 0.001; unpaired t test; two-tailed).
Figure 2
Figure 2
Generation of PbWTHMGB1-GFPparasites and examination of the extracellular presence of parasite HMGB1.A, schematic representation of double-crossover recombination strategy followed to generate PbWTHMGB1-GFP parasites. B, genomic DNA PCR confirmation for site-specific integration of HMGB1-GFP in PbWTHMGB1-GFP parasites. Lane M: 1 kb ladder. Lane 1 and 2: Integration-specific product of 2.06 kb amplified using forward primer upstream to the promoter sequence of PbHMGB1 and GFP-specific reverse primer. Lane 3 and 4: PbGAPDH control (1.25 kb). C, Western blot analysis of PbHMGB1-GFP protein expression in PbWTHMGB1-GFP parasites. 100 μg of total protein was used. D, live imaging of PbWTHMGB1-GFP parasites showing the localization of endogenous PbHMGB1-GFP. DAPI treatment was carried out to stain the nuclear DNA. Images were captured using 100× objective lens. Scale bar = 5 μm. E, indirect immunofluorescence analysis of PbHMGB1-GFP localization in PbWTHMGB1-GFP parasites using GFP antibodies. DAPI treatment was carried out to stain the nuclear DNA. Images were captured using 100× objective lens. Scale bar = 5 μm. F, ELISA of plasma samples collected from PbWT- and PbWTHMGB1-GFP-infected mice using GFP antibodies. 100 μl plasma samples were used to coat the wells. For parasite lysate control, 50 μg of PbWT and PbWTHMGB1-GFP lysates were used. For spiking, the respective plasma samples were spiked with 50 μg of PbWTHMGB1-GFP or PbWT lysates. The data (mean ± SD) represent five different samples (n.s.- not significant, ∗∗∗p < 0.001; unpaired t test; two-tailed). ET, early trophozoite; G, gametocyte; LT, late trophozoite; MT, mid trophozoite; R, ring; S, schizont.
Figure 3
Figure 3
Generation of PbHMGB1KO parasites.A, double cross-over recombination strategy followed to generate PbHMGB1KO parasites. B, genomic DNA PCR confirmation of HMGB1 deletion in PbHMGB1KO parasites. Lane 1 and 3: PCR amplification of PbHMGB1 (318 bp). Lane 2 and 4: PbGAPDH control (1.25 kb). Lane M: 100 bp ladder. C, RT-PCR confirmation of HMGB1 deletion in PbHMGB1KO parasites. Lane 1 and 3: PCR amplification of HMGB1 (318 bp). Lane 2 and 4: PbGAPDH control (1.0 kb). Lane M: 100 bp ladder. D, southern blot confirmation of site-specific integration in PbHMGB1KO parasites. Lane 1: Recombinant plasmid used for transfection as a control to rule out the presence of episomes. Lane 2 and 3: Genomic DNA isolated from PbWT and PbHMGB1KO parasites, respectively. Genomic DNA and plasmid samples were digested with SphI and HindIII and hybridized with 3′UTR-specific probe of PbHMGB1. PbWT and PbHMGB1KO genomic DNA showed the hybridized fragments of size 2.4 kb and 1.9 kb, respectively. For recombinant plasmid, the fragment size was 3.6 kb. E, Western blot confirmation of HMGB1 deletion in PbHMGB1KO parasites using PbHMGB1 polyclonal antibodies. 150 μg of total protein was used for SDS-PAGE. F, immunofluorescence analysis of HMGB1 localization in PbWT parasites and HMGB1 deletion in PbHMGB1KO parasites. Scale bar = 5 μM. G, ELISA analysis of plasma samples collected from PbWT- and PbHMGB1KO-infected mice using polyclonal PbHMGB1 antibodies. 100 μl plasma samples were used to coat the wells. For parasite lysates, 50 μg of PbWT and PbHMGB1KO lysates were used. The data (mean ± SD) represent five different samples (n.s.- not significant, ∗∗∗p < 0.001; unpaired t test; two-tailed).
Figure 4
Figure 4
Characterization of a sexual phenotype of PbHMGB1KO parasites.A, growth analysis of PbWT (n = 13) and PbHMGB1KO (n = 16) in Balb/c mice. 105 parasites were used for infection. The data (mean ± SD) represent three different batches (∗∗∗p < 0.001; Two-way ANOVA; Tukey test). B, Geimsa-stained images of blood smears prepared from tail vein blood of PbWT and PbHMGB1KO parasite-infected mice. Scale bar = 10 μM. C, Survival analysis of Balb/c mice infected with PbWT (n = 5) and PbHMGB1KO (n = 11) parasites (∗∗∗p < 0.001; log-rank (Mantel-Cox) test). D, clearance of blood parasitemia in Balb/c mice (n = 6) infected with 10, 102 or 106 parasitized RBCs through intravenous route. The data (mean ± SD) represent three different batches. (∗∗∗p < 0.001; Two-way ANOVA; Tukey test). E, growth analysis of PbHMGB1KO parasites collected during protective phase. The naïve Balb/c mice (n = 3) were infected with 10, 102 or 105 parasitized RBCs through intravenous route. F, growth analysis of PbWT (n = 4) and PbHMGB1KO (n = 6) in CBA/CaJ mice. 105 parasites were used for infection. The data (mean ± SD) represent three different batches (∗∗∗p < 0.001; Two-way ANOVA; Tukey test). G, survival analysis of CBA/CaJ mice (n = 12) infected with PbWT and PbHMGB1KO parasites (∗∗∗p < 0.001 log-rank (Mantel-Cox) test).
Figure 5
Figure 5
In vivo bioluminescence studies with PbHMGB1KOLucparasites and the effect of splenectomy on the clearance of PbHMGB1KO parasites.A, double cross-over recombination strategy followed to generate PbHMGB1KOLuc parasites. B, genomic DNA PCR confirmation of HMGB1 deletion in PbHMGB1KOLuc parasites. Lane M: 100 bp ladder. Lane 1 and 3: PCR amplification of HMGB1 (318 bp). Lane 2 and 4: GAPDH control (1.25 kb). C, RT-PCR confirmation of HMGB1 deletion in PbHMGB1KOLuc parasites. Lane M: 100 bp ladder. Lane 1 and 3: PCR amplification of HMGB1 (318 bp). Lane 2 and 4: PbGAPDH control (1.0 kb). Lane M: 100 bp ladder. D, growth analysis of PbControlLuc (n = 10) and PbHMGB1KOLuc (n = 10) in Balb/c mice. 105 parasites were used for infection. The data (mean ± SD) represent three different batches (∗∗∗p < 0.001; Two-way ANOVA; Tukey test). E, survival analysis of Balb/c mice infected with PbControlLuc (n = 6) and PbHMGB1KOLuc (n = 6) parasites (∗∗∗p < 0.001, log rank (Mantel-Cox) test). F, in vivo bioluminescence imaging of Balb/c mice infected with PbControlLuc and PbHMGB1KOLuc parasites. 105 parasites were used for infection. G, Spleen weight of Balb/c mice infected with PbWT (n = 14) and PbHMGB1KO (n = 16). The data (mean ± SD) represent three different batches (∗∗∗p < 0.001; Two way ANOVA; Tukey test). Scale bar = 1 cm. H, total number of splenocytes from PbWT- and PbHMGB1KO-infceted mouse spleen. The data (mean ± SD) represent three mice (∗p < 0.05, ∗∗p < 0.01; unpaired t test; two-tailed). I, growth analysis of PbWT (n = 5) and PbHMGB1KO (n = 10) parasites in splenectomized Balb/c mice. 105 parasites were used for infection. The data represent mean ± SD; ∗∗∗p < 0.001; Two-way ANOVA; Tukey test). J, survival analysis of splenectomized Balb/c mice infected with PbWT (n = 4) and PbHMGB1KO (n = 7) parasites; (∗∗∗p < 0.001; log-rank (Mantel-Cox) test].
Figure 6
Figure 6
Genetic complementation of PbHMGB1 in PbHMGB1KOLucparasites.A, double cross-over recombination strategy followed to generate PbHMGB1KO+HMGB1 parasites. The arrows denote the promoters present in the plasmid. The expression of PbHMGB1 was restored at its endogenous locus with its own promoter. B, genomic DNA PCR confirmation for the genetic complementation of PbHMGB1 and its site-specific integration in PbHMGB1KOLuc parasites. C, RT-PCR confirmation showing the expression of PbHMGB1 RNA in PbHMGB1KO+HMGB1 parasites. D, Western analysis showing the expression of PbHMGB1 in PbHMGB1KO+HMGB1 parasites. E, Growth analysis of PbHMGB1KO+HMGB1 parasites in Balb/c mice (n = 6). 105 parasites were used for infection. For control, PbWT-infected mice (n = 6) were used. The data (mean ± SD) represent two different batches (n.s., not significant; Two-way ANOVA; Tukey test). F, survival analysis of Balb/c mice infected with PbHMGB1KO+HMGB1 parasites. The data represent ten mice (n.s., not significant; log-rank (Mantel-Cox) test). G, Spleen weight of Balb/c mice infected with PbWT (n = 6) and PbHMGB1KO+HMGB1 parasites (n = 6). H, growth analysis of PbHMGB1KO+HMGB1 parasites (n = 6) in CBA/CaJ mice. 105 parasites were used for infection. For control, PbWT-infected mice (n = 6) were used. The data (mean ± SD) represent two different batches (n.s., not significant; Two-way ANOVA; Tukey test). I, survival analysis of CBA/CaJ mice infected with PbWT and PbHMGB1KO parasites. The data represent ten mice (n.s., not significant; log-rank (Mantel-Cox) test).
Figure 7
Figure 7
Assessment of splenic architecture, macrophages and dendritic cells in PbHMGB1KO-infected mice.A, H&E stained spleen sections of mice infected with PbWT and PbHMGB1KO parasites. The spleen samples were collected on the respective days post-infection. Images were captured using 10× objective. Scale bar = 50 μm. n = 3 independent experiments. B–G, Flow cytometry analyses of F4/80high CD68+ CD11b+ red pulp macrophages (B), MHCII+ CD209b+ marginal zone macrophages (C), MHCII+ CD169+ marginal metallophilic macrophages (D), MHCII+ CD68+ tingible body macrophages (E), CD11c+ cDCs (F) and PDCA-1+ pDCs (G). The spleen samples of PbWT- and PbHMGB1KO-infected mice were collected and the total splenocytes were prepared to carry out the isolation and staining of macrophages and dendritic cells. The flow cytometry data (mean ± SD) represents three different mice for the respective days (∗p < 0.05, ∗∗p < 0.01, ∗∗∗p < 0.001, n.s., not significant; unpaired t test; two-tailed). H, cDCs/pDCs ratio in the spleen samples of PbWT- and PbHMGB1KO-infected mice. The data represent the mice used for flow cytometry analysis of cDCs and pDCs (n.s., not significant, ∗∗p < 0.01, ∗∗∗p < 0.001; unpaired t test; two-tailed). GC, germinal centers; RP, red pulp; WP, white pulp.
Figure 8
Figure 8
Characterization of GC responses in PbHMGB1KO-infected mice.A, immunofluorescence analyses of GCs in the spleen sections of PbWT- and PbHMGB1KO-infected mice. Images were captured using 20× objective. Scale bar = 50 μm. n = 3 independent experiments. B, Tfh in the spleen samples of PbWT- and Pb-HMGB1KO-infected mice. C, tregs in the spleen samples. D, tregs/Tfh ratio in the spleen samples. The flow cytometry data (mean ± SD) represent at least three different mice for the respective days (∗p < 0.05, ∗∗p < 0.01; unpaired t test; two-tailed). E–J, B cell subtypes in the spleen samples of PbWT- and Pb-HMGB1KO-infected mice. CD19+ CD21+ marginal zone B cells (E), CD19+ CD23+ follicular B cells (F), CD19+ GL+ GC B cells (G), IgD secreting CD19+ B cells (H), IgM secreting CD19+ B cells (I) and CD19+ GL+ GC B cells expressing IgG1 (J). The flow cytometry data (mean ± SD) represent three different mice (n.s.- not significant,∗p < 0.05, ∗∗p < 0.01, ∗∗∗p < 0.001; unpaired t test; two-tailed).
Figure 9
Figure 9
Long-term protection of PbHMGB1KO-infected mice.A and B, ELISA analyses of the sera collected from PbHMGB1KO-infected mice against PbWT parasite lysates (A) and iRBC lysates (B) to assess the parasite antigen-specific IgG. For control, sera collected from PbWT-infected mice were used. The wells were coated with 100 μg of the total protein from parasite lysates or iRBC lysates. The data (mean ± SD) represent at least three different mice (∗∗p < 0.01, ∗∗∗p < 0.001; unpaired t test; two-tailed). C, blood parasitemia of PbHMGB1KO-infected mice challenged with PbWT parasites at 2, 6, 9 and 12 months post-protection. D, survival curves of the respective mice used for PbWT challenge. The data (mean ± SD) represent at least three different mice for each time interval. E and F, assessment of parasite antigen-specific IgG in the sera of the protected mice infected earlier with PbHMGB1KO parasites and challenged with PbWT parasites. 100 μg of the total protein from PbWT parasite lysates (E) and iRBC lysates (F) were used to coat the wells. Sera collected from day 3 post-challenge were used. For control, sera from PbWT-infected mice cleared with a single dose of arteether (2 mg/mouse) and challenged with PbWT parasites were used. The data (mean ± SD) represent at least three different mice (∗∗∗p < 0.001; unpaired t test; two-tailed). G, levels of CD27+ and IgG2a+ memory B cells isolated from the spleen of PbHMGB1KO-infection protected mice on day 3 post-challenge. The flow cytometry data (mean ± SD) represent three different mice (∗∗p < 0.01; unpaired t test; two-tailed).
Figure 10
Figure 10
Transcriptomics of PbHMGB1KO parasites and schematic representation of the parasite clearance and long-lasting protective immunity in PbHMGB1KO-infected mice.A, list of downregulated genes in PbHMGB1KO parasites during early- and late-stage infections. The genes that showed significant down-regulation with greater than 1.5-fold change, FDR < 0.05 and adjusted p-value < 0.05 were considered (Benjamini-Hochberg procedure; multiple hypothesis testing). RNA-Seq analyses were carried out for three independent parasite pellets of PbWT and PbHMGB1KO parasites for early- and late-stage infections, respectively. B, donut chart representing the gene ontologies of significantly down-regulated genes based on the functional annotations available in PlasmoDB and published literature. C, percentage of S and L families in the down-regulated pir genes and the proportion of various clades. The entire details of RNA-Seq analyses are provided in Dataset S1. D, model depicting the role of PbHMGB1 in regulating the expression of pir genes and the splenic events leading to parasite clearance and long-lasting protective immunity in PbHMGB1KO-infected mice. The protection from anemia and cerebral malaria mortality due to the clearance of PbHMGB1KO parasites in Balb/c and CBA/CaJ mice is shown. The preservation of splenic architecture with effective germinal center responses in PbHMGB1KO-infected mice is represented. BCZ, B cell zone; GC, germinal center; MZ, marginal zone; MMM, marginal metallophilic macrophages; MZM, marginal zone macrophages; RP, red pulp; RPM, red pup macrophages; TBM, tingible body macrophages; TCZ, T cell zone.

Similar articles

Cited by

References

    1. Cox F.E. History of the discovery of the malaria parasites and their vectors. Parasit. Vectors. 2010;3:5. - PMC - PubMed
    1. Deroost K., Pham T.T., Opdenakker G., Van den Steen P.E. The immunological balance between host and parasite in malaria. FEMS Microbiol. Rev. 2016;40:208–257. - PubMed
    1. Templeton T.J. The varieties of gene amplification, diversification and hypervariability in the human malaria parasite, Plasmodium falciparum. Mol. Biochem. Parasitol. 2009;166:109–116. - PubMed
    1. Sherman I.W., Eda S., Winograd E. Cytoadherence and sequestration in Plasmodium falciparum: defining the ties that bind. Microbes Infect. 2003;5:897–909. - PubMed
    1. Duraisingh M.T., Skillman K.M. Epigenetic variation and regulation in malaria parasites. Annu. Rev. Microbiol. 2018;72:355–375. - PubMed

Publication types

MeSH terms

LinkOut - more resources