. 2024 Sep 29;13(1):279.
doi: 10.1038/s41377-024-01643-7.

Picotesla-sensitivity microcavity optomechanical magnetometry

Affiliations

Picotesla-sensitivity microcavity optomechanical magnetometry

Zhi-Gang Hu et al. Light Sci Appl. .

Abstract

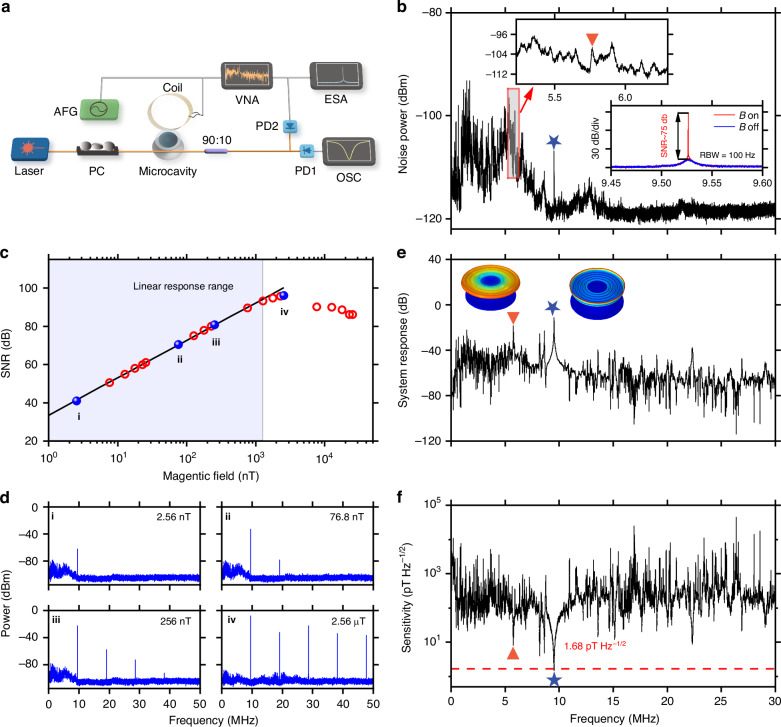
Cavity optomechanical systems have enabled precision sensing of magnetic fields, by leveraging the optical resonance-enhanced readout and mechanical resonance-enhanced response. Previous studies have successfully achieved mass-produced and reproducible microcavity optomechanical magnetometry (MCOM) by incorporating Terfenol-D thin films into high-quality (Q) factor whispering gallery mode (WGM) microcavities. However, the sensitivity was limited to 585 pT Hz-1/2, over 20 times inferior to those using Terfenol-D particles. In this work, we propose and demonstrate a high-sensitivity and mass-produced MCOM approach by sputtering a FeGaB thin film onto a high-Q SiO2 WGM microdisk. Theoretical studies are conducted to explore the magnetic actuation constant and noise-limited sensitivity by varying the parameters of the FeGaB film and SiO2 microdisk. Multiple magnetometers with different radii are fabricated and characterized. By utilizing a microdisk with a radius of 355 μm and a thickness of 1 μm, along with a FeGaB film with a radius of 330 μm and a thickness of 1.3 μm, we have achieved a remarkable peak sensitivity of 1.68 pT Hz-1/2 at 9.52 MHz. This represents a significant improvement of over two orders of magnitude compared with previous studies employing sputtered Terfenol-D film. Notably, the magnetometer operates without a bias magnetic field, thanks to the remarkable soft magnetic properties of the FeGaB film. Furthermore, as a proof of concept, we have demonstrated the real-time measurement of a pulsed magnetic field simulating the corona current in a high-voltage transmission line using our developed magnetometer. These high-sensitivity magnetometers hold great potential for various applications, such as magnetic induction tomography and corona current monitoring.


Conflict of interest statement

The authors declare no competing interests.

Figures

Fig. 1
Fig. 1. Designed structure and theoretical analysis of the MCOM.
a Schematic structure (left panel) and the cross-section (right panel) of the magnetometer. The optical WGM is confined along the inner surface. The RBM motion changes the microcavity circumference, thereby shifting the optical resonance. b Optical readout principle. The magnetostriction-induced mechanical displacement u shifts the optical transmission spectrum from the blue curve to the orange one periodically. When the laser frequency fL is locked on the side of the optical resonance, the frequency shift can be converted into an intensity modulation of the detected photocurrent i(t) with the mechanical angular frequency of Ωm. ce Simulation results for magnetic actuation constants cact (blue diamonds) and sensitivity Bmin (orange dots) for the RBM of the magnetometer, as a function of the radius of FeGaB film (c), the thickness of FeGaB film (d), and the radius of microdisk (e), respectively
Fig. 2
Fig. 2. Fabrication and characterization of the magnetometers.
a Scanning electron microscope (SEM) image of the FeGaB film. b Atomic force microscope (AFM) of a 500 nm × 500 nm region of the FeGaB film. RMS roughness of the FeGaB film is ~540 pm. c In-plain magnetic hysteresis loops measured using a vibrating sample magnetometer (VSM). The lines and scatters correspond to the loops measured along the easy-axis (x) and hard-axis (y) directions respectively. d Schematic of the fabrication process of the magnetometers. e, f SEM and optical microscope images of the fabricated magnetometer, respectively. The slight warping of the SiO2 microdisk outer edge is due to the stress within the FeGaB film. g Optical transmission spectrum of the fabricated magnetometer, showing an intrinsic Q factor of around 3.37 × 106 for the WGM of the microdisk, in the 1550 nm band under the critical-coupled condition
Fig. 3
Fig. 3. Sensitivity measurement of the magnetometers.
a Schematic of the experimental setup. AFG: arbitrary function generator, PC: polarization controller, PD: photodetector, VNA: vector network analyzer, ESA: electronic spectrum analyzer, OSC: oscilloscope. b Noise power spectrum of a magnetometer with a radius of 355 μm, with the peaks representing the thermally excited mechanical modes. Left inset: zoomed-in noise power spectrum within the frequency range of 5.2–6.3 MHz. Right inset: power spectra with (red) and without (blue) the magnetic field in the frequency range of 9.45–9.6 MHz. The applied AC magnetic field is around 128 nT at 9.53 MHz. c Signal-to-noise ratio (SNR) at 9.53 MHz as a function of increasing AC magnetic field. A linear response of SNR is fitted in the black line using data within the shaded region. A nonlinearity emerges when the magnetic field exceeds 1.28 μT. d Power spectra obtained at the magnetic fields of 2.56 nT, 76.8 nT, 256 nT, and 2.56 μT, respectively, orderly identified by blue dots in (c). e System response of the magnetometer in the frequency range of 5 kHz–30 MHz. Insets show the simulated displacement profiles of RBM and HOFM using FEM simulation. f Sensitivity spectrum in the frequency range of 5 kHz–30 MHz, highlighting a peak sensitivity of approximately 1.68 pT Hz−1/2 at 9.52 MHz. In (b, e, f), the orange triangles and blue stars denote the RBM and HOFM, respectively
Fig. 4
Fig. 4. Sensitivity statistics of different-sized magnetometers.
a Sensitivity spectra of different-sized magnetometers within the frequency range of 5 kHz–30 MHz. The microdisk radii are 105 μm, 155 μm, 205 μm, 305 μm, 355 μm, and 405 μm from top to bottom. The dips marked by orange triangles correspond to the RBMs, located at 20.02 MHz, 12.57 MHz, 9.34 MHz, 6.49 MHz, 5.77 MHz, and 5.20 MHz from top to bottom. The dips marked by blue stars correspond to the HOFMs, located at 23.73 MHz, 17.00 MHz, 11.21 MHz, 9.52 MHz, and 8.30 MHz from top to bottom. b Optimal sensitivity Bmin of the RBMs (orange triangles) and HOFMs (blue stars), as a function of the microdisk radius
Fig. 5
Fig. 5. Proof-of-concept demonstration of the corona current measurement.
a Schematic of corona current monitoring through magnetic field detection. b Original voltage signal generated by the AFG to simulate the corona current. c Response of the magnetometer with a microdisk radius of 205 μm. The red (blue) curve shows the AC component of the optical transmission with (without) the signal

References

    1. Zhao, N. et al. Sensing single remote nuclear spins. Nat. Nanotechnol.7, 657–662 (2012). - PubMed
    1. Safronova, M. et al. Search for new physics with atoms and molecules. Rev. Mod. Phys.90, 025008 (2018).
    1. Savukov, I. & Karaulanov, T. Magnetic-resonance imaging of the human brain with an atomic magnetometer. Appl. Phys. Lett.103, 043703 (2013). - PMC - PubMed
    1. Xiao, W. et al. A movable unshielded magnetocardiography system. Sci. Adv.9, eadg1746 (2023). - PMC - PubMed
    1. Pizzo, F. et al. Deep brain activities can be detected with magnetoencephalography. Nat. Commun.10, 971 (2019). - PMC - PubMed

LinkOut - more resources