. 2024 Sep 28;15(1):8425.
doi: 10.1038/s41467-024-52739-y.

Deletion of ASPP1 in myofibroblasts alleviates myocardial fibrosis by reducing p53 degradation

Affiliations

Deletion of ASPP1 in myofibroblasts alleviates myocardial fibrosis by reducing p53 degradation

Shangxuan Li et al. Nat Commun. .

Abstract

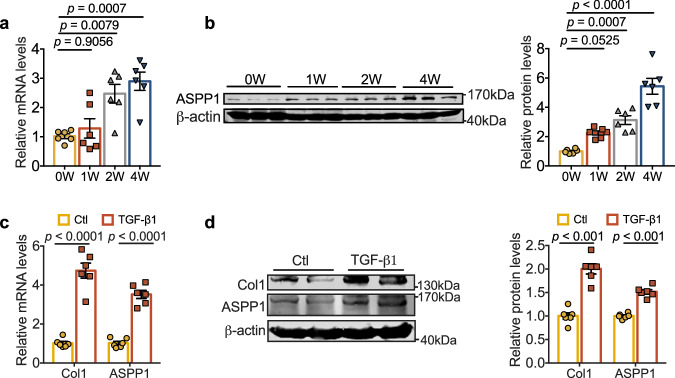
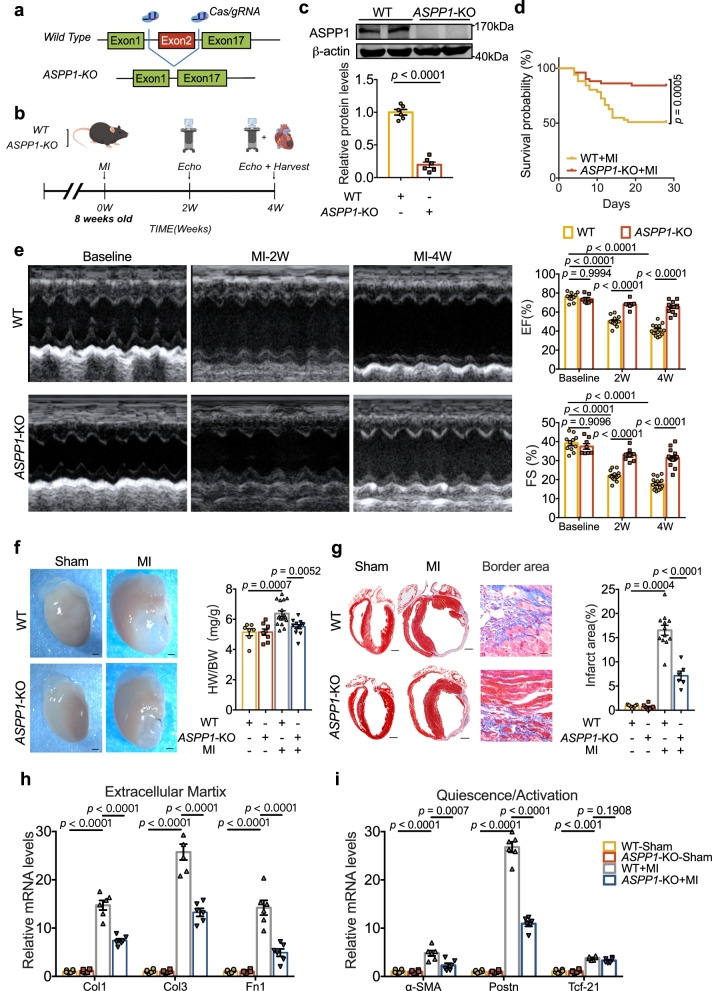
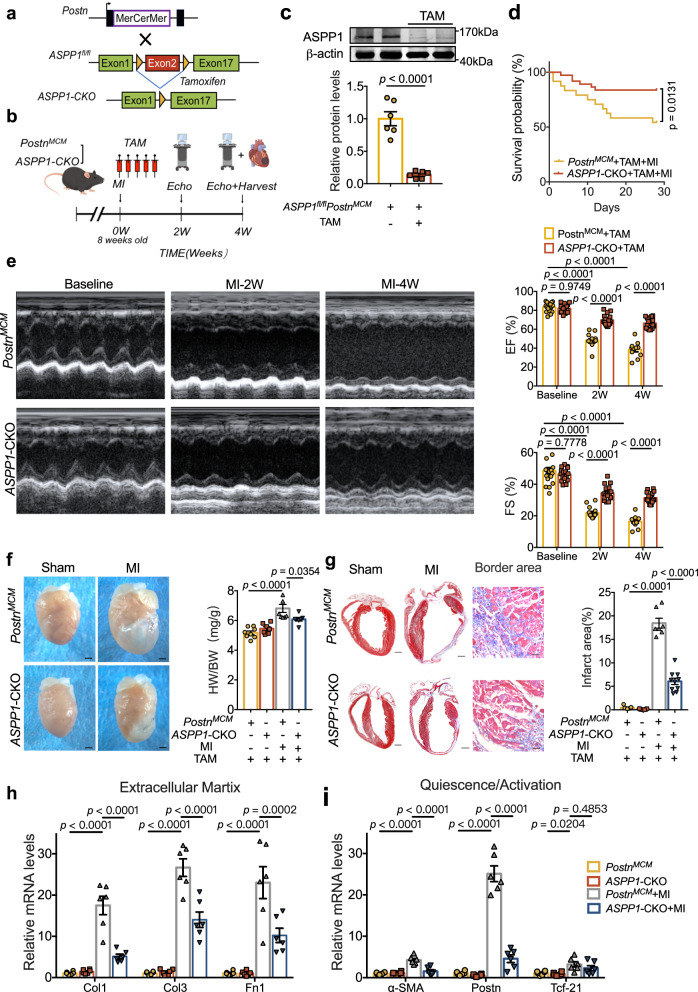
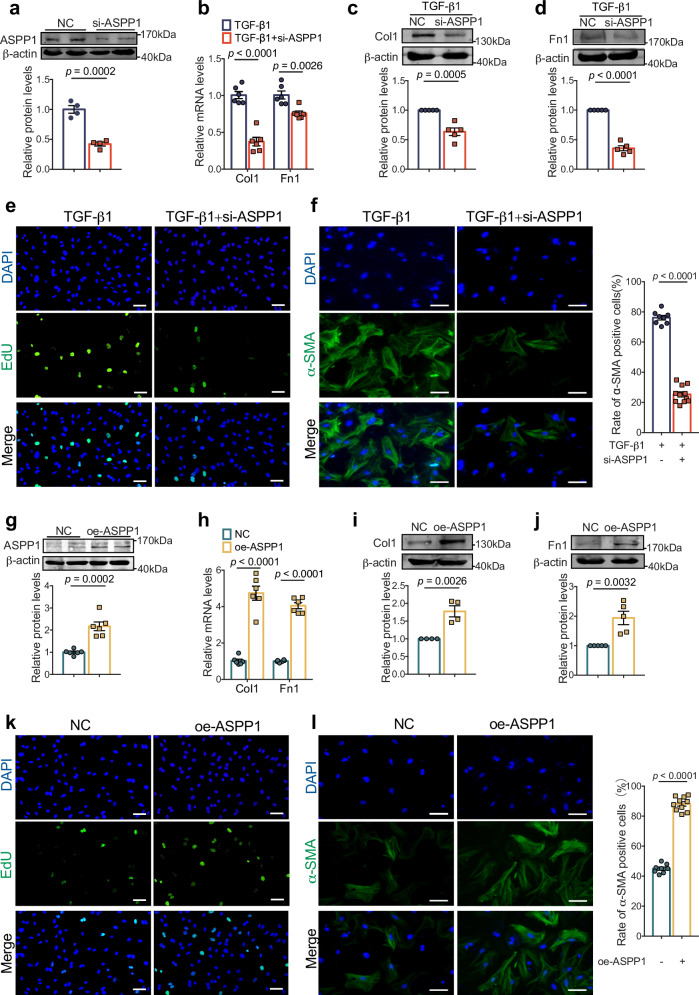
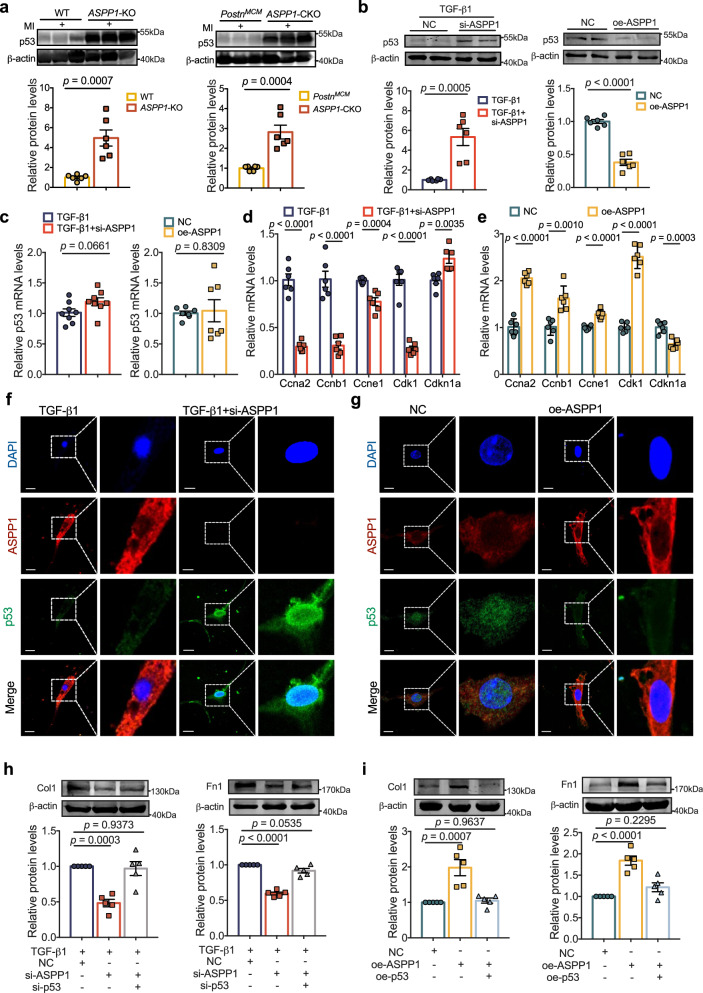
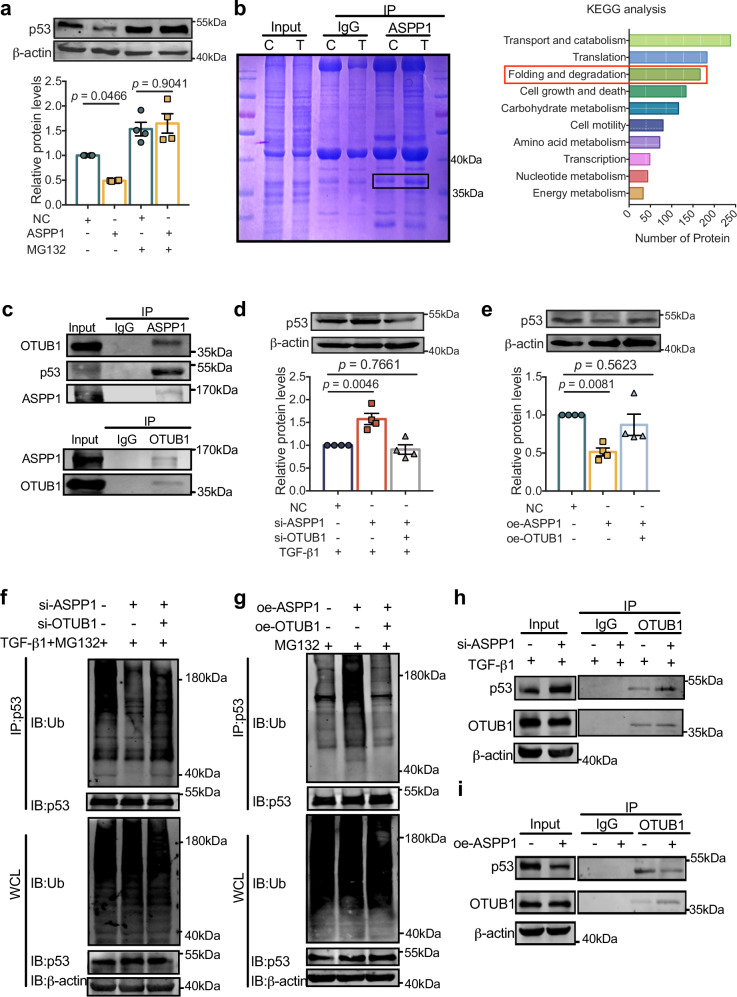
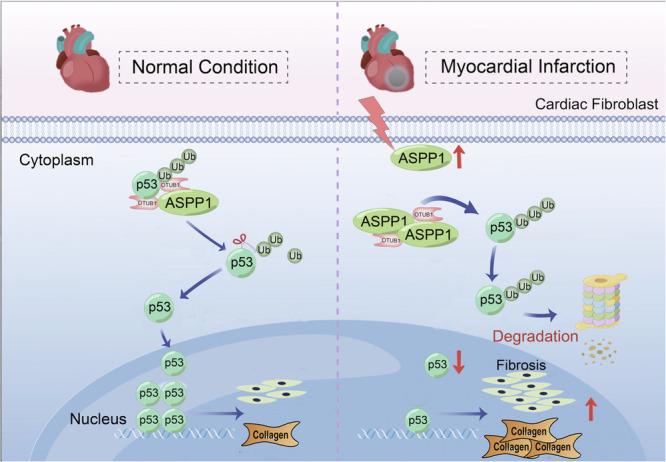
In the healing process of myocardial infarction, cardiac fibroblasts are activated to produce collagen, leading to adverse remodeling and heart failure. Our previous study showed that ASPP1 promotes cardiomyocyte apoptosis by enhancing the nuclear trafficking of p53. We thus explored the influence of ASPP1 on myocardial fibrosis and the underlying mechanisms. Here, we observed that ASPP1 was increased after 4 weeks of MI. Both global and myofibroblast knockout of ASPP1 in mice mitigated cardiac dysfunction and fibrosis after MI. Strikingly, ASPP1 produced the opposite influence on p53 level and cell fate in cardiac fibroblasts and cardiomyocytes. Knockdown of ASPP1 increased p53 levels and inhibited the activity of cardiac fibroblasts. ASPP1 accumulated in the cytoplasm of fibroblasts while the level of p53 was reduced following TGF-β1 stimulation; however, inhibition of ASPP1 increased the p53 level and promoted p53 nuclear translocation. Mechanistically, ASPP1 is directly bound to deubiquitinase OTUB1, thereby promoting the ubiquitination and degradation of p53, attenuating myofibroblast activity and cardiac fibrosis, and improving heart function after MI.


Conflict of interest statement

The authors declare no competing interests.

Figures

Fig. 1
Fig. 1. Upregulation of ASPP1 in fibrotic models.
a, b mRNA and protein of ASPP1 were elevated at 1 week, 2 weeks, and 4 weeks of MI mice. n = 6 independent animals in each group. c mRNA levels of Col1 and ASPP1 in PMCFs treated with TGF-β1 (20 ng/mL), n = 6 independent samples. d Representative immunoblots/densitometric quantitative analysis of Col1 and ASPP1 levels in total lysates of PMCFs treated with TGF-β1 (20 ng/mL). β-actin was used as a loading control, n = 6 independent samples. Data are represented as mean ± SEM. Statistics: one-way ANOVA followed by Tukey post hoc test (a, b). Two-tailed Student’s t-test was used to calculate the presented P values (c, d). Source data are provided as a Source Data file. Ctl control.
Fig. 2
Fig. 2. Global ASPP1 depletion in mice prevents cardiac fibrosis after MI.
a Strategy for the generation of ASPP1 global KO mice. b Schematic diagram of the experiment. Cardiac function was measured at the second and fourth week after MI surgery, and samples were taken at the fourth week. The diagram was created using Figdraw. c ASPP1 protein level in the heart of ASPP1 global KO mice by western blot analysis, n = 6 independent samples in each group. d Kaplan–Meier analysis of the survival of WT (n = 51) and ASPP1-KO mice (n = 51) after MI for 4 weeks. e Echocardiographic measurement of cardiac function. EF ejection fraction, FS fractional shortening; (WT, n = 13; ASPP1-KO, n = 14). f Representative images of the hearts and quantification of the ratio of heart weight (HW) to body weight (BW) in four groups of mice. (WT, n = 7; ASPP1-KO, n = 8; WT-MI, n = 17; ASPP1-KO, n = 12). Scale bar = 1 mm. Magnification 2×. g Coronal cross-section images of Masson’s trichrome staining of the whole heart and heart border area, and statistical analysis of fibrotic area (infarct size) calculated by Image-Pro Plus. (WT, n = 7; ASPP1-KO, n = 8; WT-MI = 12; ASPP1-KO = 6). Scale bar = 1 mm. Magnification 2× in whole heart view group. Scale bar = 5 mm, Magnification 20× in border area part. h, i Transcriptional level of genes encoding ECM (h) and myofibroblast markers molecules (i) in left ventricular tissue at 4 weeks after MI by qRT-PCR, n = 6 independent samples. Data are represented as mean ± SEM. Statistics: Two-tailed Student’s t-test was used to calculate the presented P values (c). Log-rank (Mantel–Cox) test (d). Two-way ANOVA followed by Tukey post hoc test (e). One-way ANOVA, followed by Tukey post hoc multiple comparisons test (fi). Source data are provided as a Source Data file.
Fig. 3
Fig. 3. Myofibroblast ASPP1 deletion prevents cardiac fibrosis in mice.
a Schematic diagram for the construction of myofibroblast ASPP1 KO mice. ASPP1fl/fl mice were crossed with PostnMCM to obtain ASPP1fl/fl PostnMCM mice. b Schematic diagram of the experimental design. ASPP1+/+PostnMCM (PostnMCM) and ASPP1fl/fl PostnMCM (ASPP1-CKO) mice were given TAM continuously for 5 days after MI by intraperitoneal injection. PostnMCM, ASPP1+/+ PostnMCM; ASPP1-CKO, ASPP1fl/fl PostnMCM; TAM, tamoxifen. The diagram was created using Figdraw. c ASPP1 protein level in the heart of ASPP1fl/fl PostnMCM by western blot assay, n = 6 independent samples. d Kaplan–Meier analysis of the survival of ASPP1+/+PostnMCM (PostnMCM) and ASPP1-CKO upon MI 4 weeks. n = 24 in PostnMCM + MI group, n = 37 in ASPP1-CKO + MI group. e Echocardiographic measurement of cardiac function. n = 18 in PostnMCM group, n = 16 in ASPP1-CKO group. f Representative images of the hearts and quantification of the ratio of HW to BW in four groups of mice. n = 8 in PostnMCM group, n = 7 in ASPP1-CKO group, n = 8 in PostnMCM + MI group, n = 7 in ASPP1-CKO + MI group, Scale bar = 1 mm. Magnification 2×. g Coronal cross-section images of Masson’s trichrome staining and statistical analysis of fibrotic area (infarct size) using Image-Pro Plus. n = 7 in the PostnMCM group, n = 7 in the ASPP1-CKO group, n = 7 in the PostnMCM + MI group, n = 10 in ASPP1-CKO + MI group. Scale bar = 1 mm. Magnification 2× in the whole heart view group. Scale bar = 5 mm, Magnification 20× in border area part. h, i. Transcriptional level of genes encoding ECM (h) and myofibroblast markers molecules (i) in left ventricular tissue at 28 days after MI by qRT-PCR, n = 6 independent samples. Data are represented as mean ± SEM. Statistics: A two-tailed Student’s t-test was used to calculate the presented P values (c). Log-rank (Mantel–Cox) test (d). 2-way ANOVA followed by Tukey post hoc test (e). One-way ANOVA, followed by Tukey post hoc multiple comparisons test (fi). Source data are provided as a Source Data file.
Fig. 4
Fig. 4. ASPP1 facilitates cardiac fibroblast activation and collagen production in vitro.
a Efficiency of small interfering RNA (siRNA) of ASPP1 in PMCFs by Western blot, n = 4 independent samples. b Effects of siASPP1 on TGF-β1-induced decreases of Col1, and Fn1 mRNA levels in PMCFs by qRT-PCR analysis, n = 6 independent samples. c, d Effects of ASPP1 knockdown (siASPP1) on TGF-β1-induced decreases of Col1 and Fn1 protein levels in PMCFs by Western blot analysis, n = 5 independent experiments. e Representative photographs of EdU-positive cells by immunofluorescent staining, n = 17 independent fields of view from three independent experiments. Scale bar = 50 μm. Magnification 20×. f Representative images of α-SMA positive cells by immunofluorescent staining and rate of α-SMA positive cells. n = 8 independent fields of view from three independent experiments in the TGF-β1 group, n = 11 independent fields of view from three independent experiments in the TGF-β1 + siASPP1 group. Scale bar = 40 μm. Magnification 40×. g Efficiency of ASPP1 overexpression plasmid in PMCFs by western blot, n = 6 independent samples. h The mRNA levels of Col1 and Fn1 in PMCFs after transfection of ASPP1 overexpression plasmids by qRT-PCR analysis, n = 6 independent samples. i, j The protein levels of Col1 and Fn1 upregulated in the PMCFs after transfection of ASPP1 overexpression plasmids by Western blot analysis, n = 4 independent experiments in Col1 group, n = 5 independent experiments in Fn1. k Representative photographs of EdU-positive cells in the ASPP1 overexpression group. n = 17 independent fields of view from three independent experiments in the NC group, n = 10 independent fields of view from three independent experiments in the oe-ASPP1 group. Scale bar = 50 μm. Magnification 20×. l Immunofluorescent staining of α-SMA and statistical analysis of α-SMA positive cells. n = 8 independent fields of view from three independent experiments. Scale bar = 40 μm. Magnification 40×. Data are represented as mean ± SEM. Statistics: Two-tailed Student’s t-test was used to calculate P values (a–d and f–l). Source data are provided as a Source data file.
Fig. 5
Fig. 5. ASPP1 negatively regulates p53 protein level.
a p53 protein levels in ASPP1-KO group (The left) and ASPP1-CKO group (the right) by western blot assay, n = 6 independent samples in ASPP1-KO group in each group, n = 6 independent samples in ASPP1-CKO group in each group. b Effects of ASPP1 knockdown (si-ASPP1) on TGF-β1-induced (The left) or ASPP1 overexpression (The right) negative regulation of p53 protein levels in PMCFs by western blot analysis, n = 6 independent samples. c Effects of ASPP1 knockdown (si-ASPP1) on TGF-β1-induced (The left) or ASPP1 overexpression (the right) on p53 mRNA levels in PMCFs by qRT-PCR, n = 8 independent samples in si-ASPP1 + TGF-β1 group, n = 7 independent samples in ASPP1 overexpression group. d, e qRT-PCR was used to evaluate the expression of genes encoding cell cycle regulators in PMCFs, n = 6 independent samples in each group. f, g Immunofluorescent staining of ASPP1 and p53 in PMCFs. ASPP1 was stained in red, and p53 in green. The nucleus was stained in blue with DAPI, n = 3 independent experiments. Scale bar = 20 μm. Magnification 60×. h The protein levels of Col1 and Fn1 after co-transfection of si-ASPP1 and the siRNA for p53 (si-p53), n = 5 independent samples in each group. i The effect of Col1 and Fn1 after co-transfection of oe-ASPP1 plasmids and p53 overexpression (oe-p53) plasmids, n = 5 independent samples in each group. Data are represented as mean ± SEM. Statistics: A two-tailed Student’s t-test was used to calculate P values (ae). One-way ANOVA, followed by Tukey post hoc multiple comparisons test (h, i). Source data are provided as a Source Data file.
Fig. 6
Fig. 6. ASPP1 regulates p53 stability by binding to OTUB1.
a Effect of ASPP1 overexpression on p53 protein in the presence of ubiquitin-proteasome inhibitor MG132 (5 μM) by western blot assay, n = 4 independent samples. b Coomassie Blue staining of proteins immunoprecipitated by ASPP1 antibody, n = 3 independent experiments. Bar plot showing Kyoto Encyclopedia of Genes and Genomes (KEGG) analysis of ASPP1-binding genes. c Western blot analysis of OTUB1 and p53 immunoprecipitated by ASPP1 (Upper panel), and ASPP1 immunoprecipitated by OTUB1(Lower panel). The data have been reproduced in 3 independent experiments. d Protein level of p53 after co-transfection of si-ASPP1 and si-OTUB1, n = 4 independent samples. e Protein levels of p53 after co-transfection of oe-ASPP1 plasmid and oe-OTUB1 plasmid, n = 4 independent samples. f Effects of concurrent OTUB1 knockdown on p53 ubiquitination suppressed by siASPP1 in TGF-β1-induced PMCFs by Co-IP, n = 3 independent experiments. g Effect of OTUB1 overexpression on p53 ubiquitination induced by ASPP1 in PMCFs by Co-IP, n = 3 independent experiments. h. Effects of ASPP1 knockdown on the binding of OTUB1 to p53 in TGF-β1-treated PMCFs by Co-IP, n = 3 independent experiments. i Effect of ASPP1 overexpression on p53’s binding to OTUB1, n = 3 independent experiments. Data are represented as mean ± SEM. Statistics: one-way ANOVA, followed by Tukey post hoc multiple comparisons test (a, d, and e). Source data are provided as a Source data file.
Fig. 7
Fig. 7. The influence of ASPP1 on cardiac fibrosis.
ASPP1 was up-regulated during cardiac fibrosis after MI, which bound more OTUB1 and thus inhibited OTUB1 interaction with p53. The deubiquitination of p53 was therefore decreased resulting in its enhanced ubiquitination and degradation. The degradation of p53 accelerated the cell cycle progression of fibroblasts and promoted cardiac fibrosis. Ub, ubiquitin. The diagram was created using Figdraw.

References

    1. Hinderer, S. & Schenke-Layland, K. Cardiac fibrosis—a short review of causes and therapeutic strategies. Adv. Drug Deliv. Rev.146, 77–82 (2019). - PubMed
    1. Park, S., Nguyen, N. B., Pezhouman, A. & Ardehali, R. Cardiac fibrosis: potential therapeutic targets. Transl. Res.209, 121–137 (2019). - PMC - PubMed
    1. Travers, J. G., Kamal, F. A., Robbins, J., Yutzey, K. E. & Blaxall, B. C. Cardiac fibrosis: the fibroblast awakens. Circ. Res.118, 1021–1040 (2016). - PMC - PubMed
    1. From the American Association of Neurological Surgeons ASoNC. et al. Multisociety consensus quality improvement revised consensus statement for endovascular therapy of acute ischemic stroke. Int J. Stroke13, 612–632 (2018). - PubMed
    1. Burstein, B. & Nattel, S. Atrial fibrosis: mechanisms and clinical relevance in atrial fibrillation. J. Am. Coll. Cardiol.51, 802–809 (2008). - PubMed

Publication types

MeSH terms

Substances