. 2024 Sep 28;15(1):8416.
doi: 10.1038/s41467-024-51995-2.

Hypoxia induces ROS-resistant memory upon reoxygenation in vivo promoting metastasis in part via MUC1-C

Affiliations

Hypoxia induces ROS-resistant memory upon reoxygenation in vivo promoting metastasis in part via MUC1-C

Inês Godet et al. Nat Commun. .

Abstract

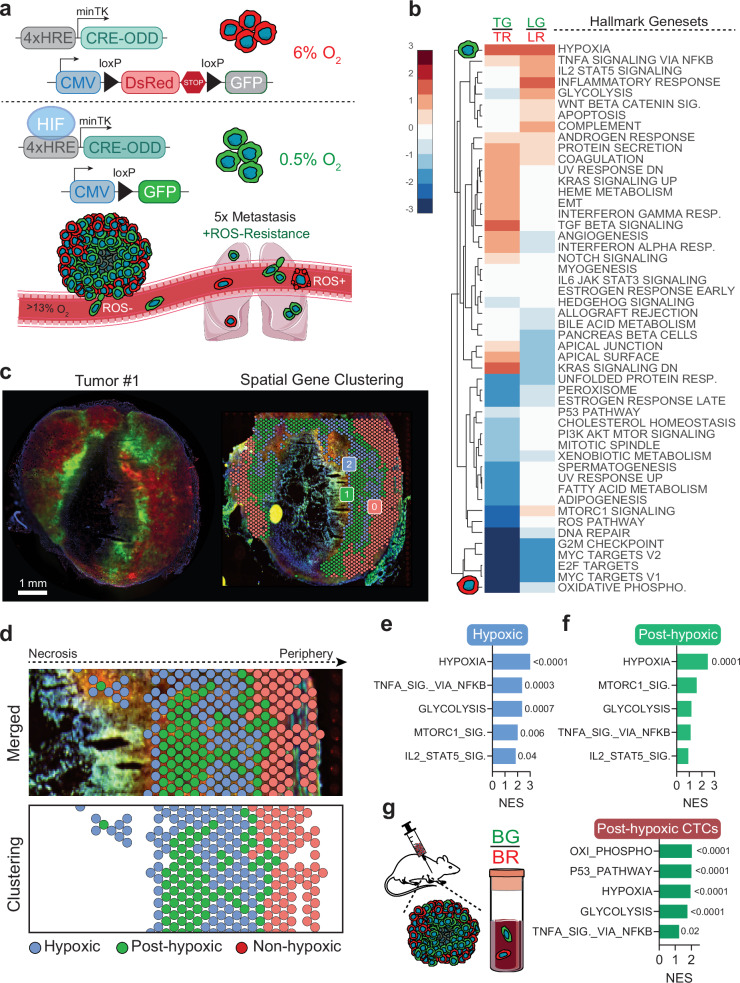
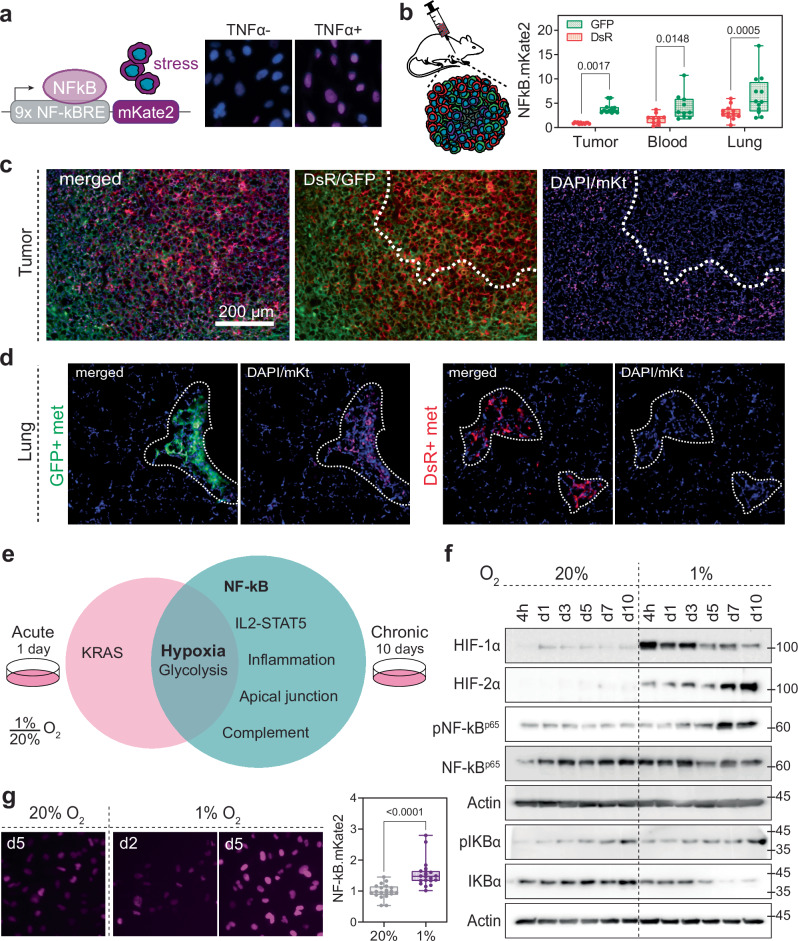
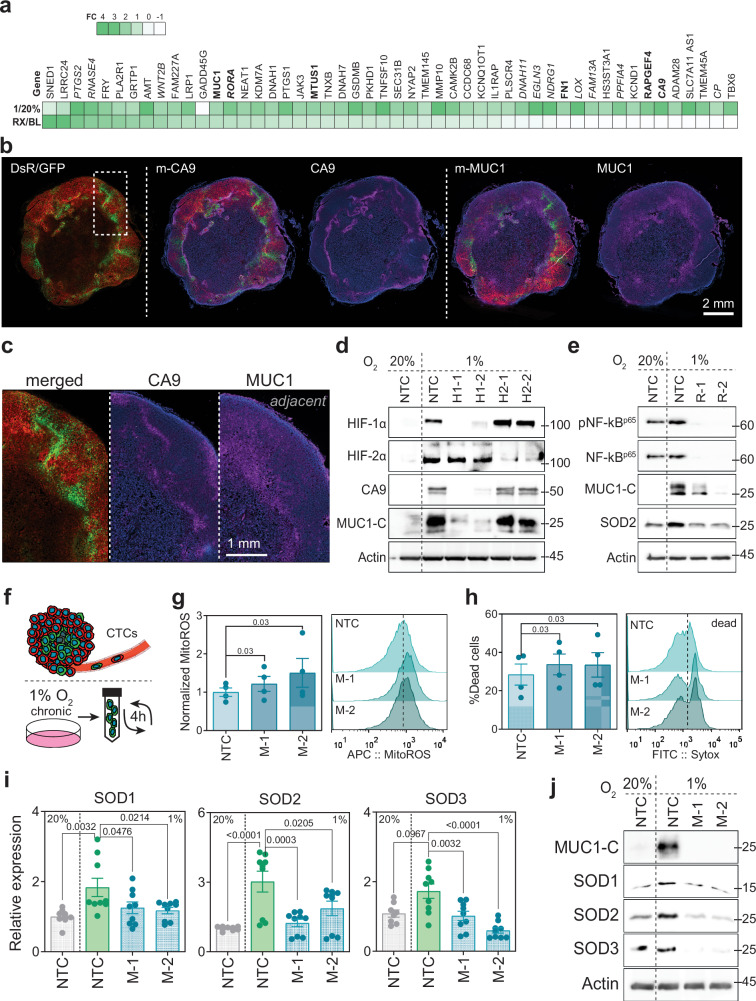
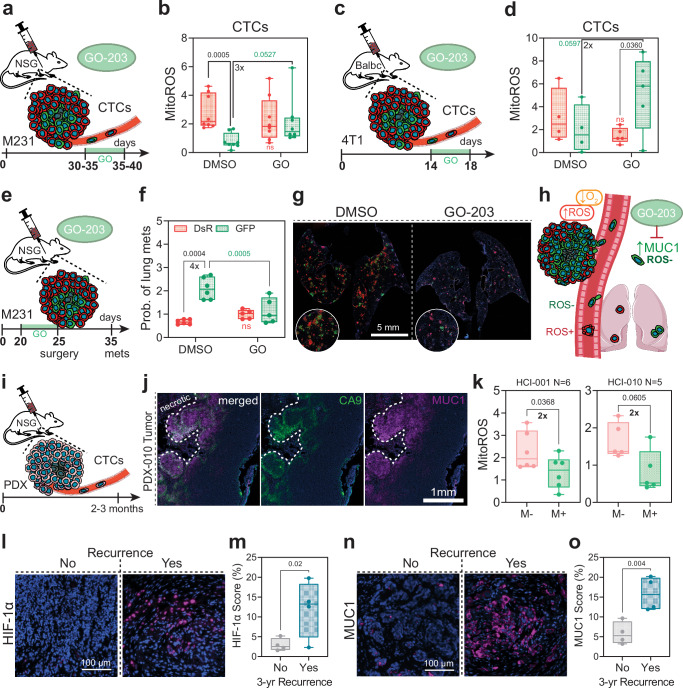
Hypoxia occurs in 90% of solid tumors and is associated with metastasis and mortality. Breast cancer cells that experience intratumoral hypoxia are 5x more likely to develop lung metastasis in animal models. Using spatial transcriptomics, we determine that hypoxic cells localized in more oxygenated tumor regions (termed 'post-hypoxic') retain expression of hypoxia-inducible and NF-kB-regulated genes, even in the oxygen-rich bloodstream. This cellular response is reproduced in vitro under chronic hypoxic conditions followed by reoxygenation. A subset of genes remains increased in reoxygenated cells. MUC1/MUC1-C is upregulated by both HIF-1α and NF-kB-p65 during chronic hypoxia. Abrogating MUC1 decreases the expression of superoxide dismutase enzymes, causing reactive oxygen species (ROS) production and cell death. A hypoxia-dependent genetic deletion of MUC1, or MUC1-C inhibition by GO-203, increases ROS levels in circulating tumor cells (CTCs), reducing the extent of metastasis. High MUC1 expression in tumor biopsies is associated with recurrence, and MUC1+ CTCs have lower ROS levels than MUC1- CTCs in patient-derived xenograft models. This study demonstrates that therapeutically targeting MUC1-C reduces hypoxia-driven metastasis.


Conflict of interest statement

C.A.S. has received research funds from AstraZeneca, GSK/Tesaro, Merck, Gilead, Celldex, BMS, and Pfizer and has received consulting fees from Seattle Genetics. E.J.F. serves on the Scientific Advisory Board of Resistance Bio and is a consultant for Merck and Mestag Therapeutics and received research funding from Abbvie, Inc. and Roche/Genentech. The other authors have no competing interests to disclose.

Figures

Fig. 1
Fig. 1. GFP+ CTCs retain hypoxia and NF-kB signaling.
a Dual-vector hypoxia fate-mapping system. Cancer cells express DsRed under physiological O2 (6%) levels, or GFP after a Cre-mediated switch under hypoxia (0.5% O2) in vivo. Previous studies demonstrated that post-hypoxic MDA-MB-231 tumor cells had a 5-times higher probability of establishing a lung metastatic lesion in NSG mice due to a ROS-resistant phenotype that promoted survival in the bloodstream. b Cluster analysis of gene expression patterns from bulk RNA sequencing analysis to compare normalized enrichment scores (NES) of hallmark gene sets in GFP + versus DsRed + FACS-sorted tumor (TG/TR) or metastatic cells in the lung (LG/LR). c Spatial transcriptomics was applied to tumor sections obtained from mice bearing tumors from MDA-MB-231 hypoxia fate-mapping cells (left). The clustering analysis revealed gene expression clusters that were visually identified in hypoxic, post-hypoxic, or non-hypoxic regions of the tumor (right). d Magnified view of a tumor overlayed with gene expression clusters. e, f Top enriched hallmark gene sets in hypoxic (cluster #2) (e) and post-hypoxic (cluster #1) (f) clusters compared to non-hypoxic (cluster #0) tissue (adjusted p-value ****< 0.0001, **< 0.001, *< 0.05, versus normal). g Low input RNA sequencing was performed in DsRed + and matched GFP + CTCs isolated from the blood of tumor-bearing mice. Hallmark gene sets of interest enriched in GFP + versus DsRed + CTCs (BG/BR) are displayed. Source data are provided as a Source Data file. Cartoons adapted (altered cell colors) under Creative Commons Attribution 4.0 Unported License (https://creativecommons.org/licenses/by/4.0/).
Fig. 2
Fig. 2. Chronic but not acute hypoxia recapitulates in vivo NF-kB signaling.
a Schematic of NF-kB-mKate2 reporter construct that drives mKate2 expression regulated by an NF-kB-responsive promoter. Fluorescent images of reporter MDA-MB-231 cells cultured in the absence or presence of 10 ng/mL TNFα. b Levels of mKate2 were assessed using flow cytometry in DsRed + and GFP + cells derived from tumor, blood, and lung samples of mice (mean ± SEM, N = 2: set 1 – n = 3 (blood) or n = 4 (tumor and lung) and set 2 – n = 7 (blood) or n = 8 (tumor and lung); GFP versus DsRed, RM two-way ANOVA with Fisher’s LSD post-test; The box extends from the 25th to 75th percentiles, the median is marked by the vertical line inside the box, and the whiskers represent the minimum and maximum points). c, d Representative fluorescent images displaying DsRed, GFP, and mKate2 expression in MDA-MB-231 tumor (c) and lung (d) sections. e Venn diagram displaying the overlap of the hallmark gene sets enriched in MDA-MB-231 cells exposed to hypoxia (1% O2) for 1 (acute) or 10 days (chronic). f Immunoblot assay of MDA‐MB‐231 cells cultured under 20% or 1% O2 for 4h, or 1, 3, 5, 7, and 10 days to assess the levels of HIF-1α, HIF-2α, pNF-kB p65, total NF-kB p65, pIKBα, and total IKBα. g Fluorescent images of MDA-MB-231 NF-kB.mKate2 reporter cells cultured under 20% O2 for 5 days and 1% O2 for 2 or 5 days. Quantification of fluorescence intensity measured by image analysis (mean ± SEM, N = 1, n = 20 fields of view; 1% versus 20%, unpaired t-test two-tailed). For boxplots, the box extends from the 25th to 75th percentiles, the median is marked by the vertical line inside the box, and the whiskers represent the minimum and maximum points. Source data are provided as a Source Data file. Cartoons adapted (altered cell colors) under Creative Commons Attribution 4.0 Unported License (https://creativecommons.org/licenses/by/4.0/).
Fig. 3
Fig. 3. HIF-1α and NF-kB regulate gene expression under hypoxic-oxidative stress.
a MDA-MB-231 tumor section imaged to visualize DsRed, GFP, and 8-Oxoguanine + labeling with normalized intensity plots (N = 6). b MitoROS levels assessed using flow cytometry in MDA‐MB‐231 cells cultured under 20% versus 1% O2 for 2 or 5 days (N = 2; n = 3 except for set 1 d2 20% n = 2, Ordinary two-way ANOVA with Bonferroni post-test). Representative flow cytometry histograms (right). c Fluorescent images of NF-kB.mKate2 MDA-MB-231 or MDA-MB-436 cells cultured under 1% O2 for 5 days with or without NAC. d Quantification of mKate2 expression by flow cytometry in MDA-MB-231 cells treated with NAC or BAY 11-7082 (N = 6; versus control (C) 1%, RM one-way ANOVA with Fisher’s LSD post-test). e COX2, pNF-kB p65, NF-kB, and SOD2 protein expression in MDA‐MB‐231 cells cultured under hypoxia for 5 days with or without NAC treatment. f Venn diagram displaying the number of genes enriched in GFP + versus DsRed + tumor cells overlapping with genes enriched in MDA-MB-231 cells exposed to 1% O2 versus 20% O2 for 1 or 10 days of hypoxia. A number of upregulated (standard font), downregulated (underlined), or oppositely regulated (italic) genes for each comparison (Supplementary Table 2). g Sixteen ROS-protective genes were upregulated by both intratumoral and chronic hypoxia exposure and organized by reported or predicted HIF- and/or NF-kB-dependent regulation. h mRNA expression levels of genes (g) in MDA-MB-231 cells under acute (1d) or chronic (5d) hypoxia conditions. i MUC1, FN1, MTUS1, RORA, RAPGEF4, and CA9 mRNA expression levels in MDA-MB-231 control (NTC), HIF-1α (H1-1/H1-2), or HIF-2α (H2-1/H2-2) knockout cells cultured under 20% or 1% O2 for 5 days (N = 3, n = 3 except for RAPGEF4 n = 2; versus NTC 1%, Kruskal-Wallis test with Dunn’s post-test). j Relative MUC1, FN1, MTUS1, RORA, RAPGEF4, and CA9 mRNA expression in MDA-MB-231 control or RELA (R-1/R-2) knockout cells. k Fold-change of mRNA expression summarized from (i) and (j). Data displayed as mean ± SEM; N = biological and n= technical replicates. For boxplots, boxes are median centered and extend from 25th to 75th percentiles, with whiskers representing minimum and maximum points. Source data are provided as a Source Data file.
Fig. 4
Fig. 4. MUC1-C drives resistance to ROS via SODs.
a Heatmap displaying the fold-change expression of the 55-gene signature co-upregulated by both intratumoral and chronic hypoxia (9 genes did not have read counts in the RX group and were excluded; 4 additional genes were added (SNED1, LRRC24, GADD45G, TMEM45A) that were upregulated by acute and intratumoral hypoxia but not by chronic hypoxic conditions) (see Fig. 3f). 1%/20%: cells cultured for 10 days 1% versus 20% O2; RX/BL: cells cultured under 1% O2 for 10 days and then reoxygenated for 10 days (RX) versus cells cultured under 20% O2 (BL). Scale indicates Log2(FC). b Representative fluorescent images of full tumor cross-sections immunolabeled for CA9 or MUC1 c magnified region marked in (b). d Immunoblot assay was performed using lysates prepared from MDA-MB-231 control (NTC), HIF-1α (H1-1/H1-2), or HIF-2α knockout (H2-1/H2-2) cells cultured under 20% or 1% O2 for 5 days to assess the levels of MUC1-C and CA9. e Immunoblot assay was performed using lysates prepared from MDA-MB-231 control or RELA (R-1/R-2) knockout cells cultured under 20% or 1% O2 for 5 days to assess the levels of MUC1-C and SOD2. f Schematic of a suspension assay designed to mimic survival in the bloodstream. Cells are cultured under chronic hypoxia, followed by 4h of culture in liquid suspension with rotation after reoxygenation. g, h Relative levels of MitoROS (g) and Sytox (h) were assessed using flow cytometry in MDA‐MB‐231 NTC or MUC1 (M-1/M-2) knockout cells cultured as described in (f) (mean ± SEM, N = 4 biological repeats versus NTC, matched Friedman test with uncorrected Dunn’s post-test). Representative flow cytometry histograms (right). i, Relative mRNA expression of SOD1, SOD2 and SOD3 as measured by RT-qPCR in MDA-MB-231 NTC or MUC1 (M-1/M-2) knockout cells cultured under 20% or 1% O2 for 5 days (mean ± SEM, N = 3 biological repeats, n = 3 technical repeats except n = 2 for SOD3 set 1; versus NTC 1%, Ordinary one-way ANOVA with Dunnett’s post-test). j Immunoblot assay was performed using lysates prepared from the same MDA‐MB‐231 NTC or MUC1 (M-1/M-2) knockout cells cultured under 20% or 1% O2 for 5 days to assess the levels of the SOD enzymes. Source data are provided as a Source Data file. Cartoons adapted (altered cell colors) under Creative Commons Attribution 4.0 Unported License (https://creativecommons.org/licenses/by/4.0/).
Fig. 5
Fig. 5. MUC1 is a biomarker for breast cancer metastasis.
a, b Kaplan–Meier analysis (https://kmplot.com) of distant metastasis-free survival (DMFS) of gene chip data from patients with breast cancer across each subtype – Luminal A, Luminal B, HER2 + and Basal – stratified by high or low MUC1 expression detected with probe 213693_s_at (a) or 211695_x_at (b). Log-rank p-value calculated by KMPlot. c, d Correlation analysis between MUC1 expression and hypoxia measured by a signature conserved across 31 breast cancer cell lines exposed to 1% O2 for 24h (Ye et al. 2018, MCR) (c) and a signature conserved between MDA-MB-231 cells exposed to intratumoral hypoxia and in vitro hypoxia (Godet et al. 2019, NC) (d) in breast cancer tumor samples from the TCGA database (https://xenabrowser.net) (r = Pearson’s coefficient; p = one-tailed p-value). e, f Correlation analysis between MUC1 expression and SOD enzyme expression in luminal A, luminal B, and HER2 + (e) and basal-like (f) breast cancer tumor samples from the TCGA database (https://xenabrowser.net) (r = Pearson’s coefficient; p = one-tailed p-value). g Fold change in the expression of MUC1 mRNA measured by qRT-PCR in the cell lines indicated cultured under 1% O2 for 5 days (mean ± SEM, N = 1 biological repeat, n = 3 technical repeats for all except n = 2 for MDA-MB-453 1%; 1% versus 20%, unpaired t test two-tailed when FC > 2). Source data are provided as a Source Data file.
Fig. 6
Fig. 6. MUC1 is required for survival of GFP + CTCs and metastatic dissemination.
a Schematic illustrating the design of the hypoxia-inducible MUC1 gene knockout lentiviral vector construct. b–d MDA‐MB‐231 hypoxia-inducible control (NTC) or RELA knockout (Cre-R-1/Cre-R-2) fate-mapping cells were cultured under 20%, 5% or 1% O2 for 6 days to assess the levels of pNF-kB and NF-kB p65 by immunoblot (b, c) or fluorescent imaging (d). e, f MDA‐MB‐231 NTC, Cre-R-1, or Cre-R-2 cells were orthotopically implanted into NSG mice (e) and re-isolated from tumors (f). g NF-kB staining was quantified in DsRed + or GFP + segmented cells (N = 3 mice except N = 2 for Cre-R-1, n = 3 fields of view; GFP versus DsRed, and Cre-NTC versus Cre-R-1 and Cre-R-2, RM two-way ANOVA with Fisher’s LSD post-test) (bottom). h Hypoxia fate-mapping MDA-MB-231 cells transduced with hypoxia-inducible NTC or MUC1 knockout vectors (Cre-M-1/Cre-M-2) were orthotopically implanted into NSG mice. Representative images of MUC1 immunolabeling (h) were quantified (i) (N = 3 mice n = 4 fields of view; versus NTC, Ordinary one-way ANOVA with Dunnett’s post-test). j MDA-MB-231 cells (h) were implanted into NSG mice. Whole blood was collected 35-40 days later to isolate CTCs. k MitoROS levels in DsRed + and GFP + CTCs were assessed using flow cytometry (N = 2 sets: set 1 – Cre-NTC n = 4, Cre-M-1 and Cre-M-2 n=2 mice; set 2 – Cre-NTC and Cre-M-2 n = 4, Cre-M-1 n = 5 mice; RM two-way ANOVA with Fisher’s LSD post-test for comparisons displayed). l MDA-MB-231 cells (h) were implanted into NSG mice, the tumor was resected on day 25, and lung metastasis was assessed on day 35. m The probability of a GFP + (DsRed) lung metastasis forming was determined by dividing the percentage of GFP + (DsRed) cells in the lung by the percentage of GFP + (DsRed) cells in the matched primary tumor by flow cytometry (N = 2 sets: set 1 – Cre-NTC n = 5; Cre-M-1 n = 3; Cre-M-2 n = 2 mice and set 2 – Cre-NTC n = 7; Cre-M-1 n = 5; Cre-M-2 n = 6 mice); GFP versus DsRed, and Cre-NTC versus Cre-M-1 and Cre-M-2; RM two-way ANOVA with Fisher’s LSD test) n Representative fluorescent images of lung tissue sections. Data displayed as mean ± SEM; N=biological replicates; n = technical replicates. For boxplots, boxes are median centered and extend from 25th to 75th percentiles, with whiskers representing the minimum and maximum points. Source data are provided as a Source Data file. Cartoons adapted (altered cell colors) under Creative Commons Attribution 4.0 Unported License (https://creativecommons.org/licenses/by/4.0/).
Fig. 7
Fig. 7. Prognostic and therapeutic potential of MUC1 and MUC1-C to prevent GFP + from metastasizing.
a Hypoxia fate-mapping MDA-MB-231 cells were orthotopically implanted into NSG mice. When tumors reached ~ 500 mm3, GO-203 was I.V. administered for 5 days. b Levels of MitoROS in DsRed + and GFP + CTCs assessed by flow cytometry (N=2 sets: set 1 – n = 3 and set 2 – n = 5 mice). c Hypoxia fate-mapping 4T1 cells were orthotopically implanted into Balb/c mice. Fourteen days post-implantation, GO-203 was I.V. administered for 5 days. d Levels of MitoROS in DsRed and GFP CTCs assessed by flow cytometry (N = 1 set: DMSO n = 4 and GO-203 n = 5 mice; the percent reduction in the mean is displayed). e MDA-MB-231 cells were implanted into NSG mice. After 20 days, GO-203 was I.V. administered for 5 days, tumors were removed on day 25, and metastasis was assessed on day 35. f The probability of a GFP + lung metastasis forming was determined by dividing the percentage of GFP + cells in the lung by the percentage of GFP + cells in the matched primary tumor as assessed by flow cytometry (N = 1 set: DMSO n = 6 and GO-203 n = 5 mice). g Representative fluorescent images of lung tissue sections. h GO-203 selectively targets GFP + cells that express high levels of MUC1-C in response to hypoxia and ROS. i PDXs (HCl-001 and HCI-010) were implanted into NSG mice. When the tumor burden reached 1 cm3, CTCs were collected from whole blood. j Representative fluorescent images of MUC1 and CA9 immunolabeling in PDX-010 tumor. k Levels of MitoROS in MUC1low and MUC1high CTCs were assessed using flow cytometry (N = 1 set, HCI-001 - n = 6 or HCI-010 - n = 5; paired one-tailed t test). lo HIF-1α (l), and MUC1 (n) immunofluorescent labeling were performed on adjacent core biopsy sections from patients with TNBC. Quantification based on digital pathology scores (Sup. Fig. 8k,l) for (m) HIF-1α and (o) MUC1 (N = 8 patients: 3-yr recurrence (N = 4) or no recurrence (N = 4); unpaired one-tailed t test). Data displayed as mean ± SEM; N = biological replicates; n = technical replicates. Statistical analysis for (b, d, f): RM two-way ANOVA with Fisher’s LSD post-test for comparisons displayed. For boxplots, the box is median-centered and extends from the 25th to 75th percentiles, and the whiskers represent the minimum and maximum points). Source data are provided as a Source Data file. Cartoons adapted (altered cell colors) under Creative Commons Attribution 4.0 Unported License (https://creativecommons.org/licenses/by/4.0/).

References

    1. Vaupel, P., Höckel, M. & Mayer, A. Detection and characterization of tumor hypoxia using pO2 histography. Antioxid. Redox Signal9, 1221–1236 (2007). - PubMed
    1. Godet, I. et al. Fate-mapping post-hypoxic tumor cells reveals a ROS-resistant phenotype that promotes metastasis. Nat. Commun.10, 4862 (2019). - PMC - PubMed
    1. Kallergi, G. et al. Hypoxia-inducible factor-1α and vascular endothelial growth factor expression in circulating tumor cells of breast cancer patients. Breast Cancer Res.11, R84 (2009). - PMC - PubMed
    1. Hecht, F. et al. The role of oxidative stress on breast cancer development and therapy. Tumor Biol.37, 4281–4291 (2016). - PubMed
    1. Marshall, C., Mamary, A. J., Verhoeven, A. J. & Marshall, B. E. Pulmonary artery NADPH-oxidase Is activated in hypoxic pulmonary vasoconstriction. Am. J. Respir. Cell Mol. Biol.15, 633–644 (1996). - PubMed

Publication types

MeSH terms

Associated data