. 2024 Sep 29;15(1):8430.
doi: 10.1038/s41467-024-52654-2.

The urotensin II receptor triggers an early meningeal response and a delayed macrophage-dependent vasospasm after subarachnoid hemorrhage in male mice

Affiliations

The urotensin II receptor triggers an early meningeal response and a delayed macrophage-dependent vasospasm after subarachnoid hemorrhage in male mice

Martin Pedard et al. Nat Commun. .

Abstract

Subarachnoid hemorrhage (SAH) can be associated with neurological deficits and has profound consequences for mortality and morbidity. Cerebral vasospasm (CVS) and delayed cerebral ischemia affect neurological outcomes in SAH patients, but their mechanisms are not fully understood, and effective treatments are limited. Here, we report that urotensin II receptor UT plays a pivotal role in both early events and delayed mechanisms following SAH in male mice. Few days post-SAH, UT expression is triggered by blood or hemoglobin in the leptomeningeal compartment. UT contributes to perimeningeal glia limitans astrocyte reactivity, microvascular alterations and neuroinflammation independent of CNS-associated macrophages (CAMs). Later, CAM-dependent vascular inflammation and subsequent CVS develop, leading to cognitive dysfunction. In an SAH model using humanized UTh+/h+ male mice, we show that post-SAH CVS and behavioral deficits, mediated by UT through Gq/PLC/Ca2+ signaling, are prevented by UT antagonists. These results highlight the potential of targeting UT pathways to reduce early meningeal response and delayed cerebral ischemia in SAH patients.


Conflict of interest statement

The authors declare no competing interests.

Figures
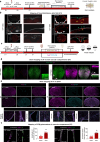
Fig. 1
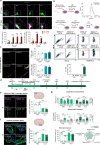
Fig. 1. The urotensinergic system is overexpressed in the cerebral vascular endothelial compartment after SAH.
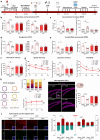
a Timeline of SAH surgery, mouse sacrifice for skull collection and clearing for the iDISCO+ procedure. b Example of Ter-119+ (red) erythrocyte distribution around leptomeninges and into the Osteosense+ (gray) skull from a transparent 8-week-old UT+/+ brain 24 hours after surgery (representative of one of the two tested mice/condition). Scale bar = 1 mm. Zoomed scale bar = 200 µm. c Timeline of SAH surgery, mouse sacrifice for brain collection, brain IHC and clearing for iDISCO+ procedure, light sheet imaging and Imaris analysis to measure vascular diameter and density. d Example of characterization of UT (magenta) from a transparent 8-week-old UT+/+ brain generated by iDISCO+ showing endothelial (Podo+/CD31+ in green) UT overexpression in SAH (blood) compared to sham (aCSF) conditions. Scale bar = 1 mm. Zoomed X-stack generated with Imaris showing at least endothelial UT overexpression in pial and penetrating arterioles under SAH conditions (representative of one of the three tested mouse brains). Scale bar = 200 µm. e Mouse brain mapping of immunolabeling of UT (cyan) or bacterial β-galactosidase (β-Gal, cyan) under the UTS2R promoter and of Podo (podocalyxin)+ cerebral endothelium (magenta) in UT+/+ or UT-/- mice from aCSF- and blood-injected mouse brains 7 days (D7) after SAH. Scale bar = 1 mm (representative of one of the two tested mouse brains). Zoomed scale bar = 200 µm. f Immunolabeling of UT or β-Gal (green) in the Podo+/CD31+ endothelium (white) and α-smooth muscle actin+ (αSMA, magenta) in cortical arterioles from aCSF- and blood-injected UT-/- mice. Quantification of endothelial UT and β-Gal intensities (n = 6/condition). Scale bar = 50 µm. UT and β-Gal are observed in the Podo/CD31+ endothelium and not in the αSMA+ layer in arterioles from SAH mice. Values are expressed as the mean ± SEM. **P < 0.01 (non-normally distributed, comparison of two groups, unpaired two-sided Mann‒Whitney test). Source data are provided as a Source Data file. a, c created with BioRender.com released under a Creative Commons Attribution-NonCommercial-NoDerivs 4.0 International license (https://creativecommons.org/licenses/by-nc-nd/4.0/deed.en).
Fig. 2
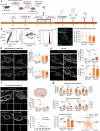
Fig. 2. The urotensinergic system relays SAH-induced behavioral deficits, neurogenesis, and glial and microglial reactivity post-SAH.
a Timeline of the SAH model of double injection of blood into the cisterna magna of UT+/+ and UT-/- mice, BrdU injections and behavioral testing before brain collection. OFT, open field test; BWT, beam walking test; EPM, elevated plus maze; FST, forced swim test; NORT and novel object recognition test; MWMT, Morris water maze test. bg Evaluation of exploration and locomotion in OFT (b), sensorimotor function in BWT (c), resignation in FST (d), anxiety and risk assessment in EPM (e), short-term memory in NORT (f) (be, n = 610/condition; f, n = 6-8/condition. Values are expressed as the mean ± SEM. *P < 0.05; **P < 0.01; ***P < 0.001 (two-way analysis of variance (ANOVA), Bonferroni’s correction). g Spatial learning (D21 to D24), long-term memory (D27) and flexibility (D28 to D31) post-SAH in MWMT. h Left, swim strategies post-SAH. Each training trial was scored such that more efficient strategies received higher scores, as indicated in parentheses. Right, distribution of search swim strategies during each trial for the 4 days of learning as stacked area percentage recognized by color codes. Cognitive scores during the 4 days of learning correspond to the mean scores attributed to swim strategies (g, h, n = 6–8/condition). Values are expressed as the mean ± SEM. ns, non-significant; $P < 0.05; $$P < 0.01 (three-way analysis of variance (ANOVA), Bonferroni’s correction) illustrating the effect of the SAH in UT+/+ mice compared to the three other groups in spatial learning, flexibility and cognitive score). ns, non-significant (two-way analysis of variance (ANOVA), Bonferroni’s correction in long-term memory. i Quantification of neurogenesis in the hippocampal dentate gyrus in aCSF- and blood-injected UT+/+ and UT-/- mice at D31 postsurgery by measuring the BrdU+ (green)/NeuN+ (magenta) ratio (n = 6). Scale bar = 200 µm. Zoomed scale bar = 10 µm. Values are expressed as the mean ± SEM. ***P < 0.001 (two-way analysis of variance (ANOVA), Bonferroni’s correction). j Astrogliosis and microgliosis at D7 postsurgery, respectively, quantified by labeled GFAP (red, upper plot) and Iba1 (green, lower plot) intensity (left plot) and area (right plot) (n = 3/condition). Scale bar = 100 µm. Values are expressed as the mean ± SEM. **P < 0.01, ***P < 0.001 (two-sided two-way analysis of variance (ANOVA), Bonferroni’s correction). Source data are provided as a Source Data file. a, i created with BioRender.com released under a Creative Commons Attribution-NonCommercial-NoDerivs 4.0 International license (https://creativecommons.org/licenses/by-nc-nd/4.0/deed.en).
Fig. 3
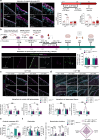
Fig. 3. The onset of SAH initiates UT/β-galactosidase expression in the brain vascular network of UT+/+ or UT-/- mice.
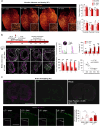
a Immunolabeling of Podo+/CD31+ brain vessels (glow dark) from a transparent sham and SAH UT+/+ and UT-/- brain generated by iDISCO + . Scale bar = 1 mm. Quantification of mean diameter and vascular density in three ROIs taken from occipital, parietal and frontal cortex areas (n = 3/condition). Values are expressed as the mean ± SEM. *P < 0.05; **P < 0.01; ***P < 0.001 (two-sided two-way analysis of variance (ANOVA), Tukey’s correction). b Timeline of SAH surgery and kinetic analysis of specific endothelial UT expression and cerebral vasospasm. Immunolabeling of middle cerebral artery (MCA) endothelium (podo+, white) and smooth muscle cells (αSMA+, magenta) from D1 to D7 in UT+/+ sham and SAH mice showing the kinetics of UT expression (green) from D1 to D7. Quantification of CVS by measuring lumen area/wall thickness ratio (left plot) and UT intensity (right plot). UT is observed in the Podo+ endothelium and not in the αSMA+ layer in the MCA of Blood UT+/+ mice. Spearman test showing a correlation between vasospasm and endothelial UT expression in the MCA (n = 6/condition). Values are expressed as the mean ± SEM. **P < 0.01; ***P < 0.001 (normally distributed, comparison of two groups, unpaired two-sided t-test). c Brain mapping from coronal (bregma 0.14 mm) slices of red blood cells immunolabeled by anti-ter-119 (magenta) and UII (green) of SAH UT+/+ mouse brain at D1 (n = 3). Scale bar = 1 mm. Immunolabeling of ter-119+ red blood cells (magenta) and UII (green) in AKAP12+ (gray) leptomeninges in sham and SAH UT+/+ and UT-/- mice at D1. Scale bar = 50 µm. Histogram of quantification of UII intensity in AKAP12+ area (n = 5/condition). Values are expressed as the mean ± SEM. *P < 0.05, **P < 0.01, ***P < 0.001 (two-sided two-way analysis of variance (ANOVA), Bonferroni’s correction or Spearman’s correlation). Source data are provided as a Source Data file. b created with BioRender.com released under a Creative Commons Attribution-NonCommercial-NoDerivs 4.0 International license (https://creativecommons.org/licenses/by-nc-nd/4.0/deed.en).
Fig. 4
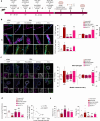
Fig. 4. UT drives brain vascular disorders associated with SAH.
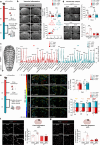
a Timeline of SAH surgery and molecular MRI coupled with intravenous injection of MPIO-anti-VCAM-1. b, c Representative T2*- (b) and T2- (c) weighted MRI brain images in sham and SAH UT+/+ and UT-/- mice. b Representative histograms of voxel density within a brain from D2 to D6 after SAH post-MPIO injection. Histogram of quantification of brain water content in sham and SAH UT+/+ and UT-/- mice at D1 (n = 6/condition). Values are expressed as the mean ± SEM. ***P < 0.001 (two-sided two-way analysis of variance (ANOVA, Bonferroni’s correction or Spearman’s correlation). c Representative T2*-weighted MRI brain images in SAH UT+/+ and UT-/- mice from bregma −5.88 mm to 3.08 mm and histograms of bound MPIO by measuring voxel density in each brain structure in sham and SAH mice at D2 and D6 (n = 6/condition). d Quantification of ventricular volume by measuring white voxel density (right plot, n = 6/condition) from D2 to D6 images (upper panel) and brain water content (lower panel) in sham and SAH UT+/+ and UT-/- mice. e Timeline of SAH surgery and fUS methodology to measure red blood cell (RBC) velocity and blood volume at D1 and D7. Illustrations depicting signed RBC velocity on a cross-section of mouse brains (bregma -1.82 mm) from aCSF and Blood UT+/+ and UT-/- mice at D1 (upper panel) and D7 (lower panel) postsurgery. Quantification of blood volume (upper right panel) and RBC velocity (lower right panel) changes at D1 and D7 postsurgery in pial, deep or Willis circle arteries and penetrating (Pen) arterioles. Scale bar = 2 mm. f Immunolabeling and quantification of fibrin (magenta) in lectin+ (green) cortical vessels in sham and SAH from UT+/+ and UT-/- mice at D7 (n = 6/condition). Scale bar = 50 µm. g Immunolabeling of podo+ (white) and caspase-3 (red) to quantify cortical endothelial apoptotic events in aCSF and blood from UT+/+ and UT-/- mice at D7 (n = 6/condition). cf Values are expressed as the mean ± SEM. *P < 0.05; **P < 0.01; ***P < 0.001 (two-sided two-way analysis of variance (ANOVA) with repeated measures, Bonferroni’s correction). Quantification of activated caspase-3 intensity in podo+ endothelial components, (n = 3). Scale bar = 100 µm. Values are expressed as the mean ± SEM. *P < 0.05 (two-sided two-way analysis of variance (ANOVA, Tukey’s correction). Source data are provided as a Source Data file. a, e, f, g created with BioRender.com released under a Creative Commons Attribution-NonCommercial-NoDerivs 4.0 International license (https://creativecommons.org/licenses/by-nc-nd/4.0/deed.en).
Fig. 5
Fig. 5. HIF-1α stabilization post-SAH induces early expression of UT in leptomeningeal fibroblasts and late cerebral vasospasm at D7.
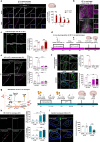
a Immunolabeling of ERTR7+ (white) meningeal fibroblasts of leptomeninges showing UT (magenta) overexpression and DAPI (blue) in SAH compared with sham conditions. Quantification of UT intensity from D1 to D7 in ERTR7+ areas (n = 5). Scale bar = 50 µm. b Immunolabeling of the dura mater showing UT (green) overexpression in SAH compared to sham conditions at D1 in ERTR7+ (magenta) meningeal fibroblasts bordering dural lectin+ (gray) vessels (n = 3/condition). Scale bar = 50 µm. c Immunolabeling of leptomeninges showing HIF-1α (cyan) overexpression at D1 in AKAP12+ (green) meningeal fibroblasts in SAH compared with sham conditions. Quantification of meningeal HIF-1α intensity in AKAP12+ areas (n = 6). Scale bar = 50 µm. d Timeline of intracisternal injections of siRNA targeting HIF-1α gene expression one day before SAH surgery. e Immunolabeling of leptomeninges showing at D1 HIF-1α (green) and UT (magenta) expression in SAH compared to sham conditions in mice pretreated with siCTRL or siHIF-1α in laminin+ (gray) meningeal fibroblasts. Quantification of HIF-1α (upper panel) and UT (lower panel) intensity in laminin+ areas (n = 4). Scale bar = 50 µm. f MCA delimited via lectin+ (green) and DAPI (blue) staining at D7. MCA lumen area/wall thickness ratio in SAH compared to sham conditions in mice pretreated with siCTRL or siHIF-1α (lower panel). Quantification of the lumen area/wall thickness ratio (n = 6). Scale bar = 50 µm. HIF-1α (magenta) expression in peri-MCA in SAH compared to sham UT+/+ and UT-/- mice (upper panel). Quantification of perivascular HIF-1α intensity in the MCA (n = 6). Scale bar = 50 µm. g Timeline of intracisternal injection of aCSF or VH298 prior to intracisternal injection of aCSF or UII. h Immunolabeling of HIF-1α (red) or UT (cyan) within leptomeninges at D1 in sham- or VH298-pretreated mice and in the absence or presence of UII. Quantification of HIF-1α (upper panel) and UT (lower panel) intensity in meningeal cells. Scale bar =  50 µm. i MCA delineation with lectin (green) and DAPI (blue) staining at D7. Quantification of the lumen area/wall thickness ratio (n = 3). Scale bar = 50 µm. ai Values are expressed as the mean ± SEM. *P < 0.05; **P < 0.01; ***P < 0.001 (ag, i) Two-sided two-way analysis of variance (ANOVA), Bonferroni’s correction). h two-sided two-way analysis of variance (ANOVA), Tukey’s correction). Source data are provided as a Source Data file. a, d, g created with BioRender.com released under a Creative Commons Attribution-NonCommercial-NoDerivs 4.0 International license (https://creativecommons.org/licenses/by-nc-nd/4.0/deed.en).
Fig. 6
Fig. 6. Leptomeningeal macrophages expressing UT are involved in cerebral vasospasm induced by SAH.
a Kinetics of F4/80+ (green) pial MΦ recruitment and UT (magenta) overexpression in leptomeninges from D1 to D7 in SAH compared to sham UT+/+ mice. Quantification of the number of F4/80+ MΦs (left panel, n = 5) and UT intensity in F4/80+ cells (right panel, n = 3) from D1 to D7. Scale bar = 50 µm. Values are expressed as the mean ± SEM. *P < 0.05; **P < 0.01; ***P < 0.001 (normally distributed, comparison of two groups, unpaired two sided t-test). b FACS analysis and gating strategy (upper right quadrant F4/80+ UT+) for bone marrow-derived (in vitro, see Material and Methods) F4/80+ MΦs (BMDMs) obtained from UT+/+ or UT-/- mice and treated or not treated with VH298 (24 h). Quantification of the percentage of UT-expressing cells among total F4/80+ BMDMs (n = 3). Values are expressed as the mean ± SEM. ***P < 0.001 (two-sided two-way analysis of variance (ANOVA), Tuckey’s correction). c Immunolabeling of leptomeninges of UT (magenta) and F4/80+ (green) MΦs at D1 in aCSF- or VH298-pretreated mice and in the absence or presence of UII in the subarachnoid space (n = 3). Scale bar = 50 µm. Values are expressed as the mean ± SEM. *P < 0.05 (two-sided two-way analysis of variance (ANOVA), Tuckey’s correction). d Experimental timeline of leptomeningeal and PVMΦ depletion by intracisternal injection of clodronate-liposomes (CLO-lip) before SAH with blood from mice depleted of peripheral MΦs prior to behavioral testing and brain analyses. Values are expressed as the mean ± SEM. *P < 0.05; ***P < 0.001 (two-sided two-way analysis of variance (ANOVA), Tuckey’s correction). e Immunolabeling of F4/80+ (magenta) MΦs around lectin+ (white) leptomeningeal and perivascular vessels. Histograms of quantification of the total number of F4/80+ cells at D1 in sham and SAH conditions. f Immunolabeling of lectin+ (green) and nuclei by DAPI (blue) in MCA at D7 in PBS-lip and CLO pretreated mice. Quantification of lumen area/wall thickness (n = 6). Scale bar = 50 µm. g Exploration and locomotion in OFT. Sensorimotor functions in the BWT and preference index in the NORT (n = 9/condition). Radar plots illustrating the relative effect of SAH in CLO pretreated mice on performance in OFT, BWT, and NOR test. Each item of the radar represents the mean normalized to CLO pretreated PBS mice. eg Values are expressed as the mean ± SEM. ns=non-significant, *P < 0.05; **P < 0.01; ***P < 0.001. (two-sided two-way analysis of variance (ANOVA), Bonferroni’s correction). Source data are provided as a Source Data file. b, df created with BioRender.com released under a Creative Commons Attribution-NonCommercial-NoDerivs 4.0 International license (https://creativecommons.org/licenses/by-nc-nd/4.0/deed.en).
Fig. 7
Fig. 7. UT expression in macrophages controls cerebral vasospasm and contributes to behavioral deficits post-SAH.
a Timeline of depletion of meningeal and PvMΦs by intracisternal injection of PBS-lip or CLO before intracisternal reinjection of bone marrow isolated MΦs (BMDMs) from UT+/+ or UT-/- mice prior to surgery, behavioral testing and CVS analysis. b Gating strategy for analysis of incorporation of QD655 by F4/80+ CD11b+ BMDMs (n = 3). FSC forward scatter, SSC side scatter. c Representative QD655 (magenta) staining and immunolabeling of F4/80+ MΦs (gray) along lectin+ dural vessels (cyan) of the meningeal dura mater at D3 in UT+/+ sham and SAH mice. Quantification of QD655+/F4/80+ cells among total F4/80+ cells (n = 6/condition). Values are expressed as the mean ± SEM. non-significant effect (two-sided two-way analysis of variance (ANOVA), Bonferroni’s correction). df Immunolabeling of Collagen IV+ (green) and nuclei stained by DAPI (white) MCA covered by ERTR7+ leptomeninges (magenta) containing QD655+ cells (red) (d) and IL-6 (magenta) and F4/80 (green) along Lectin+ structures (white) at D3 in UT+/+ sham and SAH mice intracisternally (IC) injected with UT+/+ or UT-/- MΦs labeled with QD655 (d). Scale bar =  50 µm. (e) Immunolabeling of UT (red), F4/80 (green), and nuclei (white) in MCA at D7 in UT+/+ sham and SAH mice injected (IC) with UT+/+ or UT-/- MΦs. Quantification of UT intensity in the endothelial and F4/80 MΦ compartments (n = 6/condition) and lumen area/wall thickness (n = 6/condition). Scale bar = 50 µm. Quantification of QD655+ cells distributed in all conditions (d) and of IL-6 staining in F4/80+ MΦ cells (f). Spearman test showing a correlation between vasospasm and IL-6 in peri-MCA MΦs (n = 6/condition). g Exploration in OFT, sensorimotor functions in BWT and preference index in NORT were investigated in sham and SAH mice (n = 9/condition). Radar plots illustrating the relative effect of Blood in UT+/+ mice injected with UT+/+ or UT-/- MΦs on performance in OFT, BWT, and NOR test. Each item of the radar represents the normalized mean. Values are expressed as the mean ± SEM. cg Values are expressed as the mean ± SEM. ns=non-significant, *P < 0.05; **P < 0.01; ***P < 0.001 (two-sided two-way analysis of variance (ANOVA), Bonferroni’s correction). Source data are provided as a Source Data file. a, f created with BioRender.com released under a Creative Commons Attribution-NonCommercial-NoDerivs 4.0 International license (https://creativecommons.org/licenses/by-nc-nd/4.0/deed.en).
Fig. 8
Fig. 8. UT-dependent meningeal plasticity post-SAH controls astrogliosis and some behavioral deficits.
a Immunolabeling of ERTR7+ meningeal fibroblasts (magenta) and GFAP+ glia limitans (cyan) in the pia mater and arachnoid from sham and SAH UT+/+ and UT-/- mice at D1. Quantification of meningeal GFAP intensity and area in ERTR7+ areas (n = 6/condition). Scale bar = 50 µm. ***P < 0.001 (two-way analysis of variance (ANOVA), Bonferroni’s correction). b Timeline of depletion of meningeal and PvMΦs by intracisternal injection of CLO versus PBS-lip in UT+/+ or UT-/- mice, intracisternal reinjection of BMDMs from UT+/+ mice prior to SAH, behavioral testing and CVS/leptomeninges-associated glia limitans reactivity analysis. Immunolabeling of meningeal and perivascular QD655+ (magenta) F4/80+ (white) MΦs along lectin+ brain vessels (green) in SAH UT+/+ mice. Quantification of the percentage of F4/80+/QD655+ cells in meningeal and perivascular areas (n = 5). Values are expressed as the mean ± SEM. ns, non-significant effect (normally distributed, comparison of two groups, unpaired two-sided t-test). c, d Immunolabeling of ERTR7+ meningeal fibroblasts (magenta), GFAP+ glia limitans (cyan) and DAPI (white) in meninges (c) or hippocampal fissure (d) in sham and SAH UT+/+ and UT-/- mice depleted and reinjected intracisternally with UT+/+ MΦs. Quantification of GFAP areas and intensity in contact with ERTR7+ areas within leptomeninges (c) and hippocampal fissure (d) (n = 6/condition). Scale bar = 100 µm. e Quantification of lumen area/wall thickness at D7 (n = 6/condition). Scale bar = 50 µm. f Exploration in OFT (left panel). Sensorimotor function BWT (right panel) (n = 10/condition). Radar plots illustrating the relative effect of blood in UT+/+ and UT-/- mice preinjected (IC) with UT+/+ MΦs on performance in the OFT, BWT, and NOR test. Each item of the radar represents the mean normalized to CLO pretreated Blood UT+/+ mice. (c-f) Values are expressed as the mean ± SEM. ns = non-significant, *P < 0.05; **P < 0.01; ***P < 0.001 (two-sided two-way analysis of variance (ANOVA), Bonferroni’s correction). Source data are provided as a Source Data file. b created with BioRender.com released under a Creative Commons Attribution-NonCommercial-NoDerivs 4.0 International license (https://creativecommons.org/licenses/by-nc-nd/4.0/deed.en).
Fig. 9
Fig. 9. SAH stimulates the UT/Gq/PKC coupling in leptomeninges, dictating delayed cerebral vasospasm and behavioral disorders.
a Timeline of intracisternal preinjection of aCSF or YM-254890, U73122, pertussis toxin (PTX), 30 minutes before SAH induction prior to behavioral testing and CVS analysis. b Immunolabeling of P-PKC and P-PKA (cyan) in ERTR7+ leptomeningeal fibroblasts (magenta) or GFAP (yellow) in contact with ERTR7+ fibroblasts was used to measure Gq- and Gi-associated pathway inhibition and astrogliosis at D1 in sham and SHA UTh+/h+ mice treated with intracisternal injection of aCSF, YM-254890, U73122 or PTX. Quantification of leptomeningeal P-PKC and P-PKA intensity in the ERTR7+ area and GFAP area (n = 3/condition). Scale bar = 20 µm (P-PKA) or 50 µm (P-PKC and GFAP). c Immunolabeling of P-PKC and P-PKA (green) in F4/80+ MΦs (magenta) around Lectin+ (gray) middle cerebral artery (MCA) was used to measure Gq- and Gi- pathway inhibition at D1 in sham and SAH UTh+/h+ mice treated with intracisternal injection of aCSF, YM-254890, U73122 or PTX. Quantification of meningeal cells P-PKC and P-PKA intensity in the ERTR7+ area (n = 3/condition). Scale bar = 50 µm. Zoomed scale bar = 10 µm. b, c Values are expressed as the mean ± SEM. ns, non-significant, *P < 0.05; **P < 0.01; ***P < 0.001 for comparisons with the cCSF + sham condition; $$P > 0.01; $$$P < 0.001 for comparisons with aCSF + SAH condition (two-sided one-way analysis of variance (ANOVA), Tukey’s correction). d Graphs (right panel) representing changes in lumen area/wall thickness on MCA for CVS measurement (n = 6/condition). Spearman test showing a correlation between vasospasm and P-PKC intensity in peri-MCA MΦs (n = 3/condition). Values are expressed as the mean ± SEM. *P < 0.05; **P < 0.01; ***P < 0.001 for comparisons with the cCSF + sham condition; $P < 0.05; $$P > 0.01; $$$P < 0.001 for comparisons with aCSF + SAH condition (two-sided one-way analysis of variance (ANOVA), Tukey’s correction). e Exploration in OFT and sensorimotor functions in BWT (n = 5–9/condition). Values are expressed as the mean ± SEM. *P < 0.05; **P < 0.01; ***P < 0.001 for comparisons with the cCSF + sham condition; $$P < 0.01; $$$P < 0.001 for comparisons with aCSF + SAH condition (two-sided one-way analysis of variance (ANOVA), Bonferroni’s correction). Source data are provided as a Source Data file. a created with BioRender.com released under a Creative Commons Attribution-NonCommercial-NoDerivs 4.0 International license (https://creativecommons.org/licenses/by-nc-nd/4.0/deed.en).
Fig. 10
Fig. 10. Cerebral vasospasm and behavioral disorders are efficiently targeted by UT-biased ligand/antagonists.
ae Antagonistic effect of palosuran, GSK1562590 and ligand bias of urantide on the activation of G proteins and β-arrestins on UII-activated UT signaling pathways (3 independent experiments for each in triplicate each). a Using BRET biosensors, UII activation of Gi coupled family members Gαi1, Gαi2, Gαi3, and Gαz was assessed in HEK293 cells transiently expressing hUT in the presence of 10 µM of the indicated biased ligand/antagonists. b The activation of the Gq pathway was accessed using both a BRET biosensor and by determining the production levels of the second messenger IP1 in the presence of 10 µM of the indicated biased ligand/antagonists. c Ca2+ mobilization induced by graded concentrations (10−11 to 10−6 M) of UII on hUT-transfected HEK-293 cells pretreated with buffer or biased ligand/antagonists. d Using BRET biosensors, UII activation of Go coupled family members GoA and GoB was assessed in HEK293 cells transiently expressing hUT in the presence of 10 µM of the indicated biased ligand/antagonists. e Using BRET biosensors, the UII-induced recruitment of β-arrestin 1 and β-arrestin 2 was assessed in HEK293 cells transiently expressing hUT in the presence of 10 µM of the indicated biased ligand/antagonists (ae, n = 3; values are expressed as the mean ± SEM). f Timeline of intracisternal injection of palosuran, GSK1562590 or urantide during SAH induction prior to CVS analysis and behavioral testing. g Graphs (right panel) representing changes in lumen area/wall thickness on MCA (n = 6/condition). Values are expressed as the mean ± SEM. ***P < 0.001 for comparisons with aCSF + sham condition. $$$P < 0.001 for comparisons with aCSF + SAH condition (two-sided one-way analysis of variance (ANOVA), Bonferroni’s correction). Exploration in OFT (10 min) and sensorimotor functions in BWT (n = 6–10/condition). Values are expressed as the mean ± SEM *P < 0.05; **P < 0.01; ***P < 0.001 for comparisons with aCSF + sham condition. $P < 0.05; $$P < 0.01; $$$P < 0.001 for comparisons with aCSF + SAH condition (two-sided one-way analysis of variance (ANOVA), Bonferroni’s correction). Source data are provided as a Source Data file. f created with BioRender.com released under a Creative Commons Attribution-NonCommercial-NoDerivs 4.0 International license (https://creativecommons.org/licenses/by-nc-nd/4.0/deed.en).

References

    1. van der Steen, W. E. et al. Prediction of outcome using quantified blood volume in aneurysmal SAH. Am. J. Neuroradiol.41, 1015–1021 (2020). - PMC - PubMed
    1. Claassen, J. & Park, S. Spontaneous subarachnoid haemorrhage. Lancet400, 846–862 (2022). - PMC - PubMed
    1. Rehman, S. et al. Case-fatality and functional outcome after Subarachnoid Hemorrhage (SAH) in International Stroke Outcomes Study (INSTRUCT). J. Stroke Cerebrovasc. Dis.31, 106201 (2022). - PubMed
    1. Al-Khindi, T., Macdonald, R. L. & Schweizer, T. A. Cognitive and functional outcome after aneurysmal subarachnoid hemorrhage. Stroke41, e519–e536 (2010). - PubMed
    1. Nussbaum, E. S., Mikoff, N. & Paranjape, G. S. Cognitive deficits among patients surviving aneurysmal subarachnoid hemorrhage. A contemporary systematic review. Br. J. Neurosurg.35, 384–401 (2021). - PubMed

Publication types

Substances

LinkOut - more resources