. 2024 Sep 28;7(1):1199.
doi: 10.1038/s42003-024-06898-9.

Novel microglial transcriptional signatures promote social and cognitive deficits following repeated social defeat

Affiliations

Novel microglial transcriptional signatures promote social and cognitive deficits following repeated social defeat

Ethan J Goodman et al. Commun Biol. .

Abstract

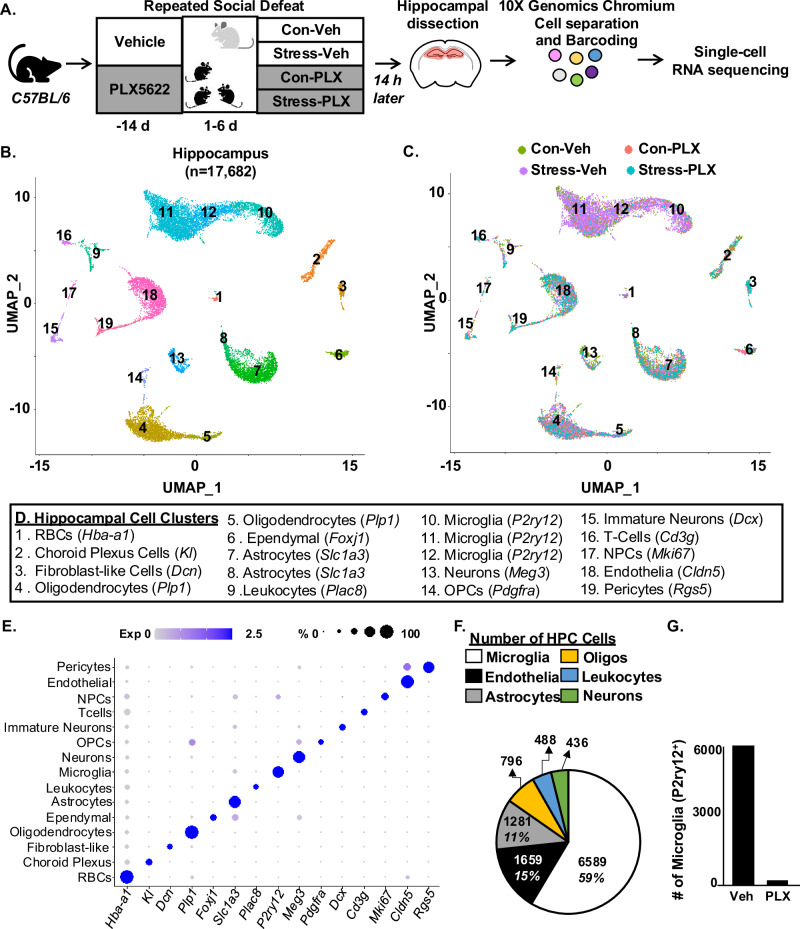
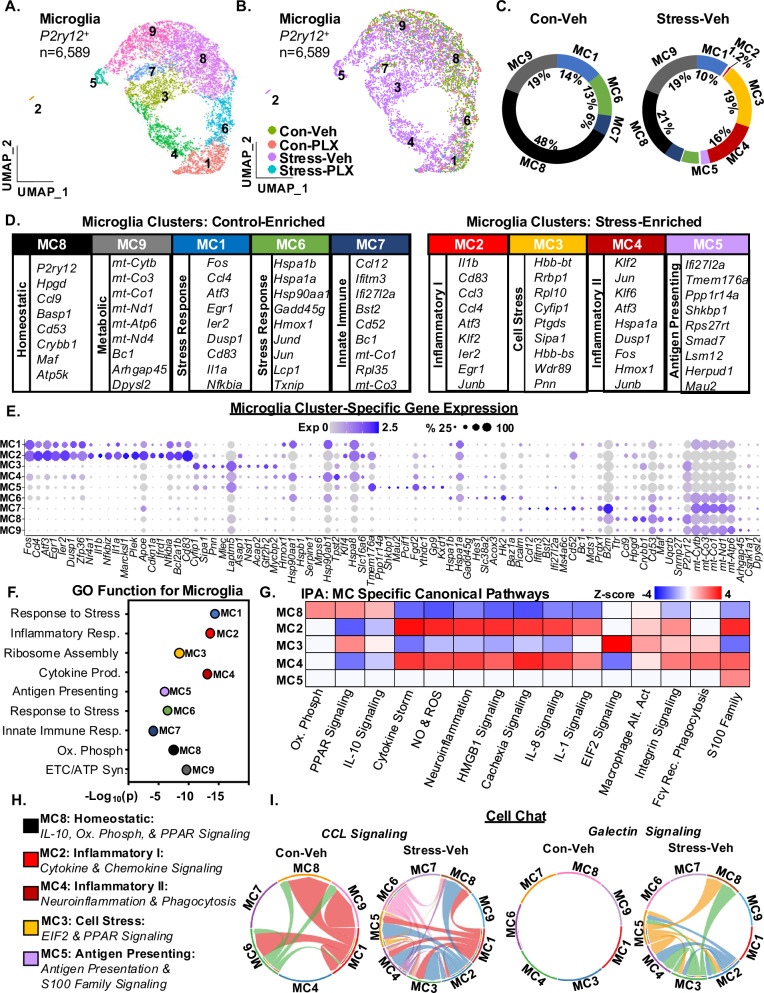
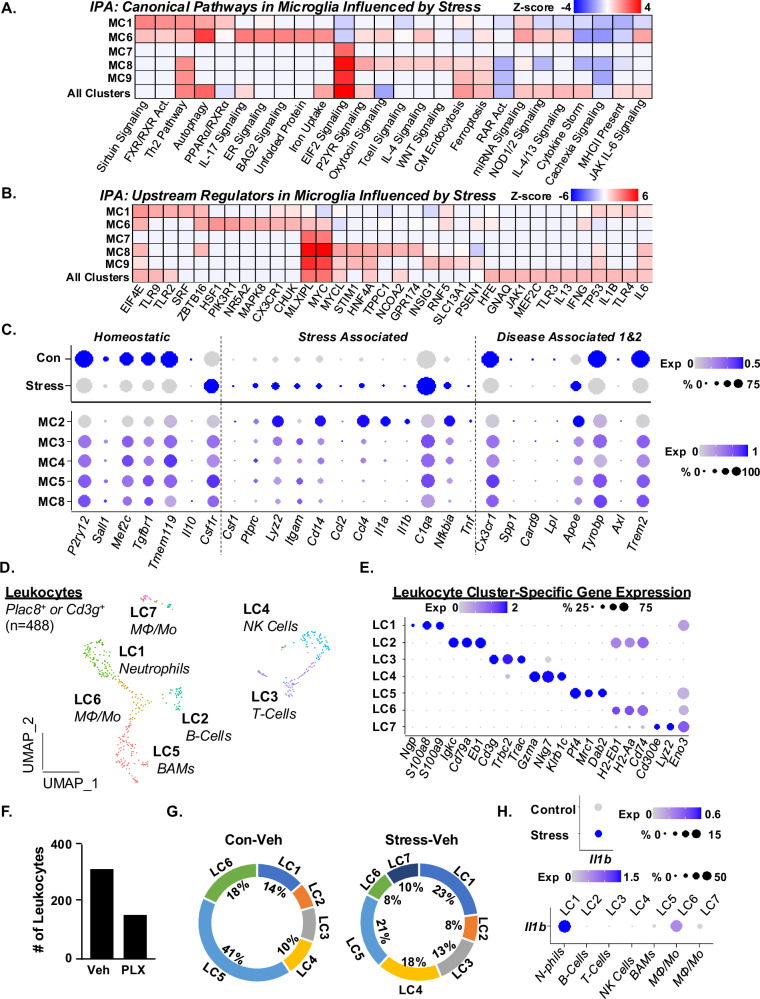
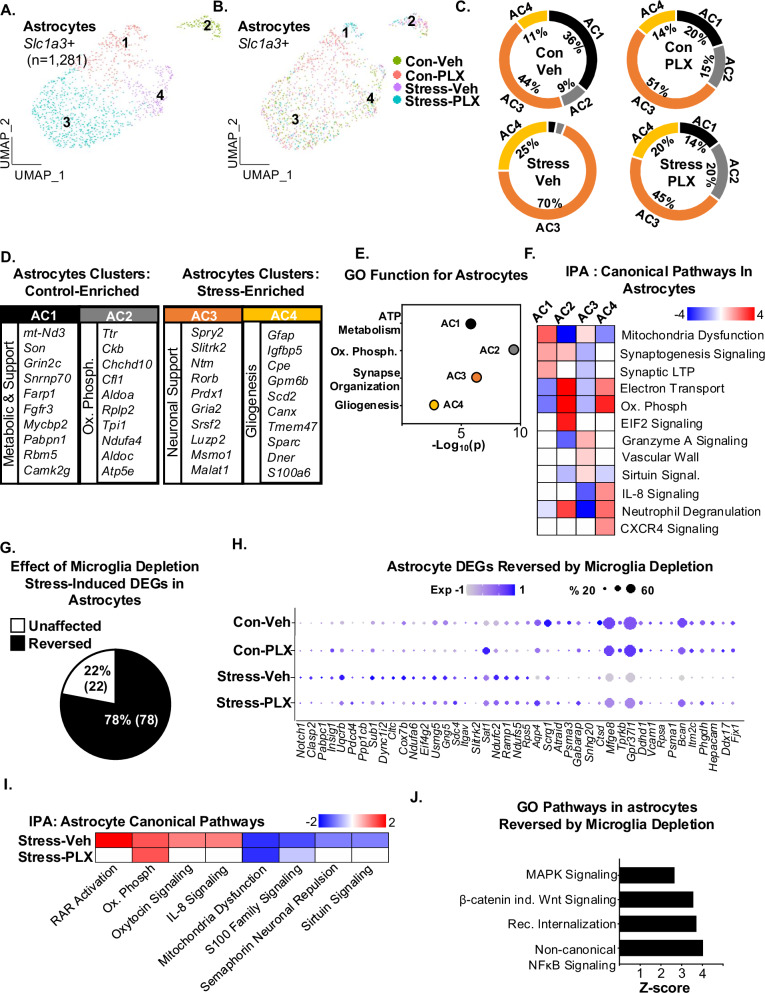
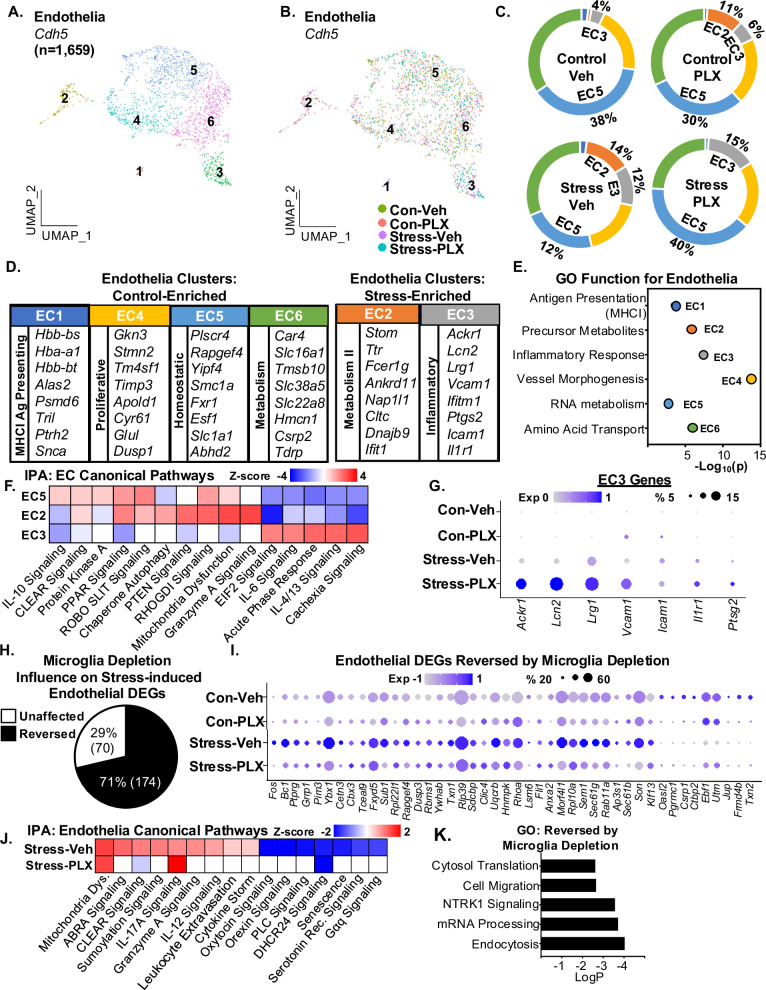
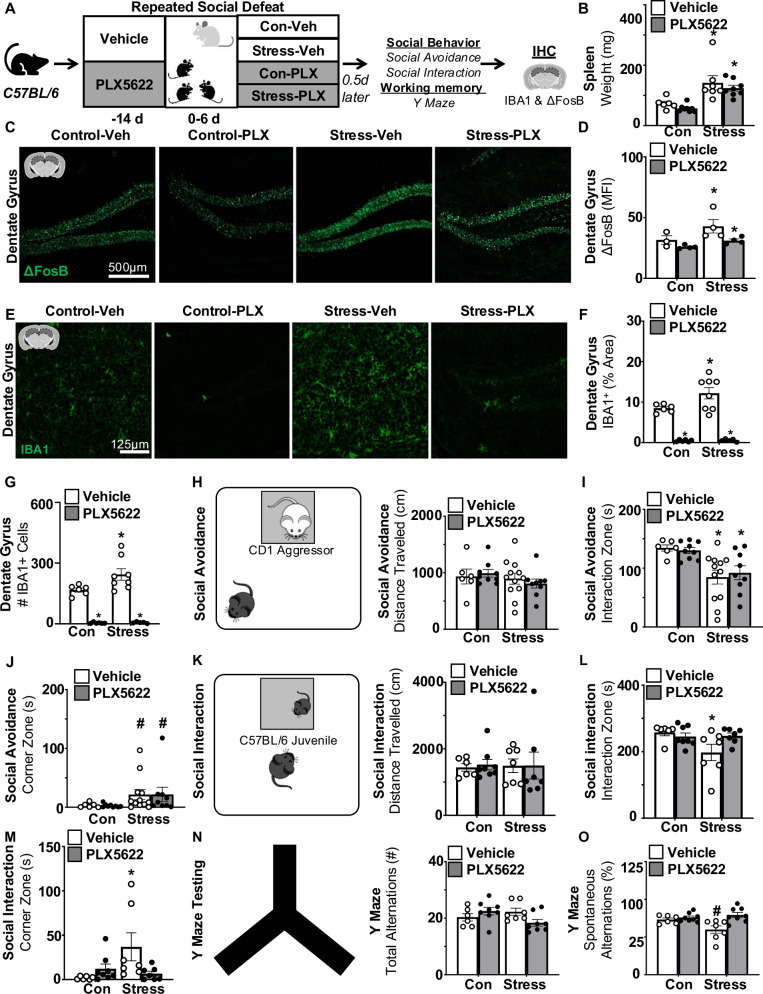
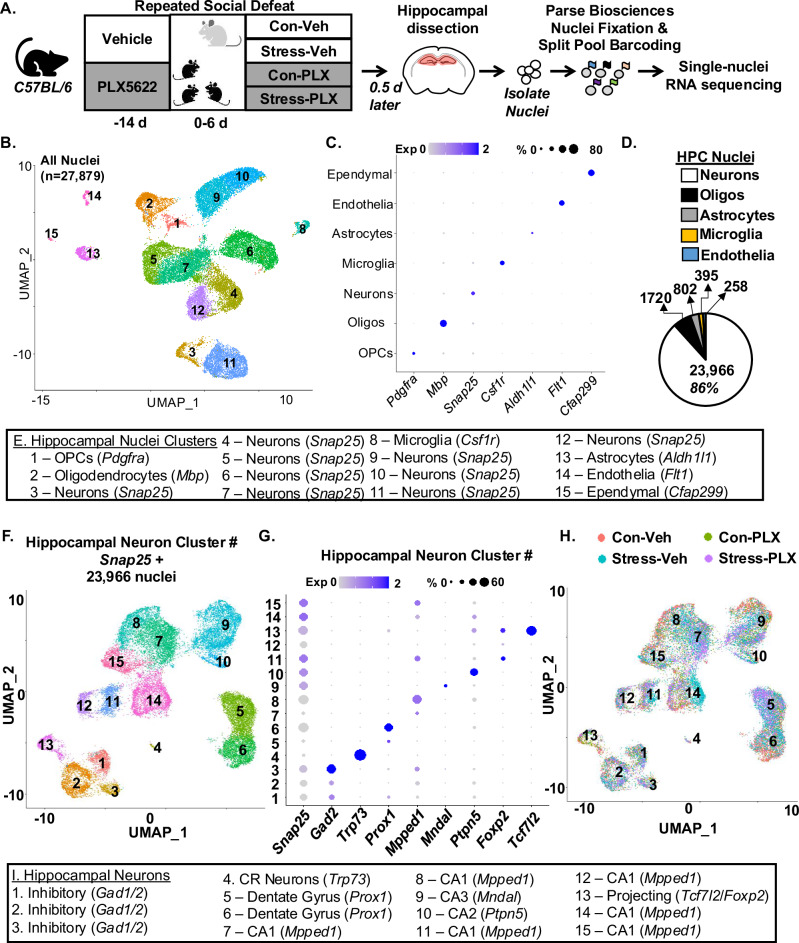
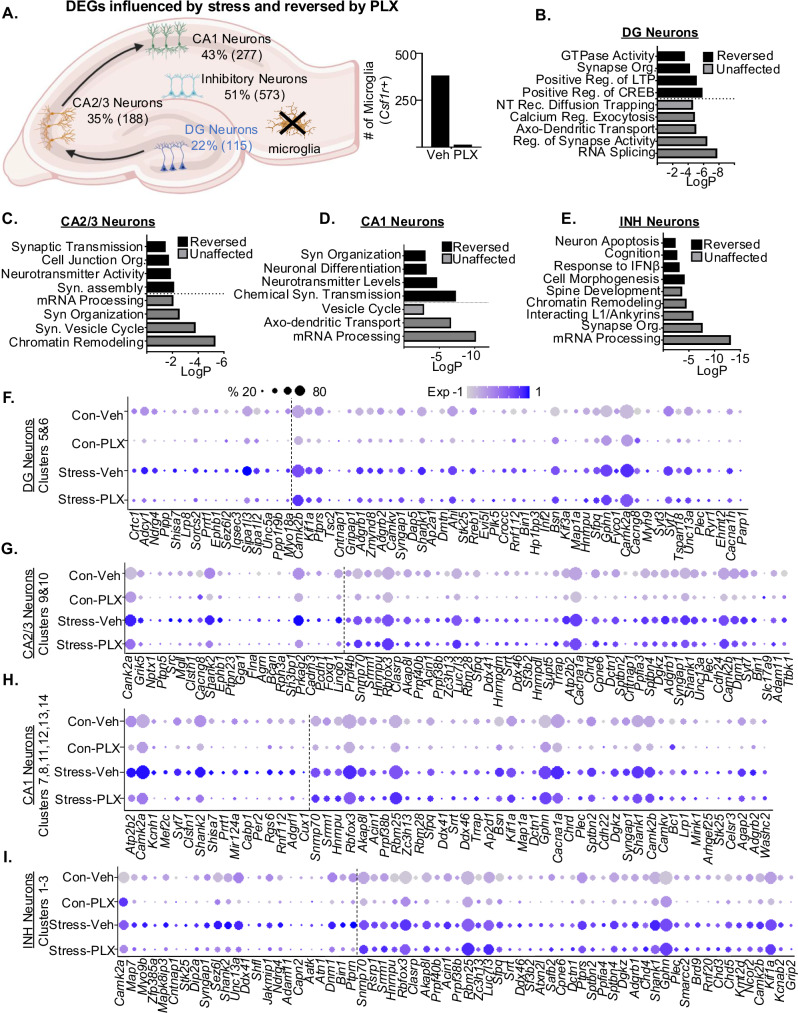
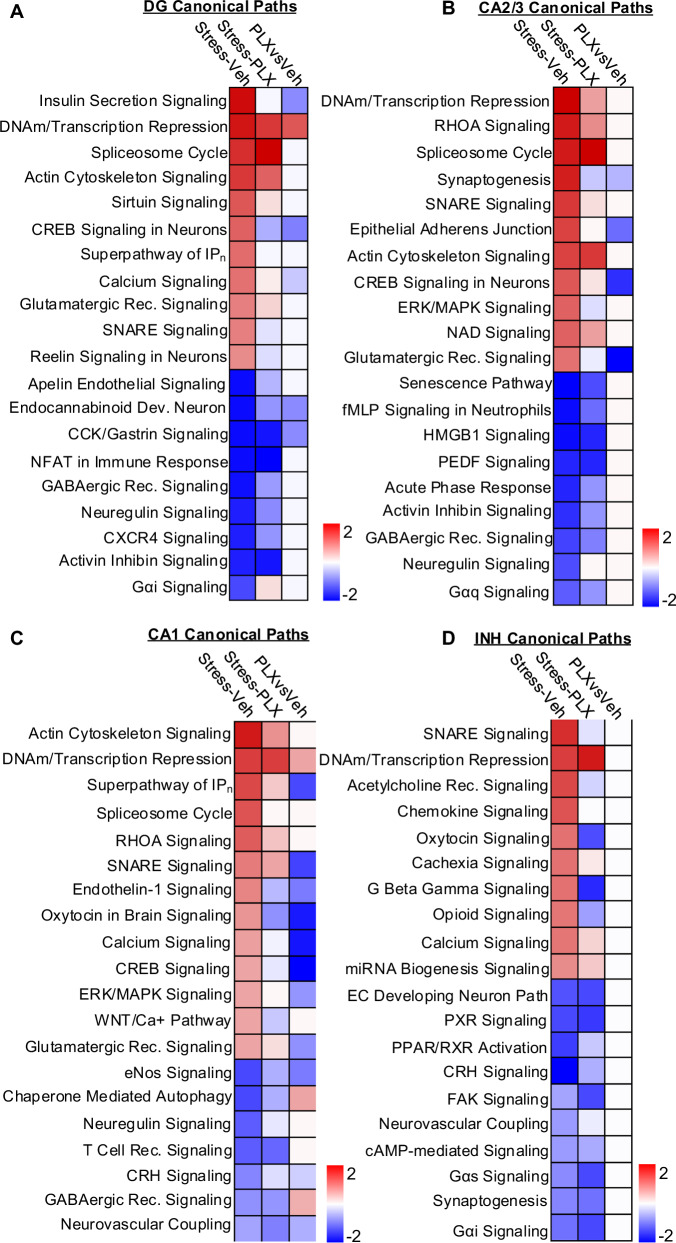
Chronic stress is associated with anxiety and cognitive impairment. Repeated social defeat (RSD) in mice induces anxiety-like behavior driven by microglia and the recruitment of inflammatory monocytes to the brain. Nonetheless, it is unclear how microglia communicate with other cells to modulate the physiological and behavioral responses to stress. Using single-cell (sc)RNAseq, we identify novel, to the best of our knowledge, stress-associated microglia in the hippocampus defined by RNA profiles of cytokine/chemokine signaling, cellular stress, and phagocytosis. Microglia depletion with a CSF1R antagonist (PLX5622) attenuates the stress-associated profile of leukocytes, endothelia, and astrocytes. Furthermore, RSD-induced social withdrawal and cognitive impairment are microglia-dependent, but social avoidance is microglia-independent. Furthermore, single-nuclei (sn)RNAseq shows robust responses to RSD in hippocampal neurons that are both microglia-dependent and independent. Notably, stress-induced CREB, oxytocin, and glutamatergic signaling in neurons are microglia-dependent. Collectively, these stress-associated microglia influence transcriptional profiles in the hippocampus related to social and cognitive deficits.


Conflict of interest statement

The authors declare no competing interests.

Figures

Fig. 1
Fig. 1. Single-cell RNA sequencing of the hippocampus after RSD.
A Male C57BL/6 mice were administered diets supplemented with Vehicle (Veh) or PLX5622 (PLX) for 14 days. Next, mice were subjected to RSD (stress) or left undisturbed (control). Mice were on diets for the duration of the experiment. Fourteen hours after RSD, mice were perfused, the hippocampus was dissected, pooled (3 mice per group), and processed for scRNAseq. Single cells were separated using a 10X Genomics Chromium controller, RNA was barcoded, and cDNA libraries were generated, sequenced, and aligned to the mouse genome. B UMAP clustering of 17,682 cells from the hippocampus resolved 19 distinct cell clusters. C The distribution of cells with UMAP clustering based on the four experimental groups (Con-Veh, Stress-Veh, Con-PLX, and Stress-PLX). D Annotation of the hippocampal cell clusters identified by cell-specific markers detected by the Conserved Marker function of Seurat. E Dot plot of relative and proportional expression of cell-specific RNA in the 19 cell clusters, including microglia (P2yr12), astrocytes (Slc1a3), endothelia (Cldn5), leukocytes (Plac8), and oligodendrocytes (Plp1). F Pie chart shows the percentage of cell-specific clusters captured and sequenced using scRNAseq. G The number of P2yr12+ microglia in PLX groups compared to vehicle groups. Clustering and differential expression were determined using Seurat in R. Pooled samples for 3 replicates and data represent two independent experiments (n = 6 mice, per group).
Fig. 2
Fig. 2. Single-cell RNA sequencing identifies unique stress-associated microglial RNA profiles after RSD.
Continuing with the scRNAseq analysis in Fig. 1, A UMAP subclustering of P2y12+ microglia (6589 cells) revealed nine distinct clusters. B The distribution of microglia with UMAP clustering based on the four experimental groups (Con-Veh, Stress-Veh, Con-PLX, and Stress-PLX). C Circle charts represent the proportion of each microglial cluster in Con-Veh and Stress-Veh groups. D The top genes expressed (Log2FC, p-adj < 0.05) in each microglia cluster. E Dot plot shows relative and proportional expression of the top genes (Log2FC, p-adj < 0.05) differentially expressed across the microglial (MC) clusters (MC1-9). F GO Function pathways for differentially expressed genes (DEG) in each MC (p-adj < 0.05) G IPA of canonical pathways of differentially expressed genes (DEG) across clusters MC2-5 and MC8 (p-adj < 0.05, z-score ≥ ±1.5). H Classification of plausible function of selected microglia clusters based on IPA and GO analyses. I CellChat analyses of CCL and galectin signaling in the microglia clusters.
Fig. 3
Fig. 3. Microglial RNA profiles after RSD are associated with the accumulation of IL-1β+ leukocytes in the hippocampus.
Continuing with the P2y12+ microglia (6589 cells) analysis in Fig. 2, A IPA of canonical pathways influenced by stress in MC1, 6–9 and all clusters (MC1-9). B IPA of upstream regulators influenced by stress in MC1, 6–9 and all clusters (MC1-9). C Dot plots of relative and proportional expression of DEGs associated with homeostatic genes, stress-associated microglia, and disease-associated microglia (DAM) across all microglia clusters and selected clusters as a function of stress. D Continuing with the scRNAseq analysis in Fig. 1, UMAP subclustering of Plac8+ or CD3g+ leukocytes (488 total cells) resolved seven distinct clusters. E Dot plot of relative and proportional expression of leukocyte-related genes in each cluster (LC1-9). F Number of Plac8+ and CD3g+ leukocytes between vehicle and PLX5622 groups combined. G Circle charts represent the proportion of each leukocyte cluster (LC) in Con-Veh and Stress-Veh groups. H Dot plots of relative and proportional expression of Il1b in leukocyte clusters as a function of stress (top) and cluster (bottom).
Fig. 4
Fig. 4. RNA profiles of astrocytes after RSD were dependent on microglia.
Continuing with the scRNAseq analysis in Fig. 1, A UMAP subclustering of Slc1a3+ astrocytes (1281 cells) shows four distinct clusters of astrocytes. B Distribution of the four astrocyte clusters within the four groups: Con-Veh, Stress-Veh, Con-PLX, and Stress-PLX. C Pie charts reflect the proportion of each astrocyte cluster of the total within the four groups. D The top genes expressed (Log2FC) in each astrocyte cluster are shown (p-adj < 0.05). E GO function for each AC. F IPA of canonical pathways of differentially expressed genes between clusters AC1-4. G Percentage of stress-induced DEG in astrocytes reversed by microglia depletion. H Dot plot shows relative and proportional expression of the top genes differentially expressed between the four groups across all astrocytes. I IPA of canonical pathways of differentially expressed genes between Stress-Veh and Stress-PLX. J GO pathways of genes influenced by stress and reversed by microglia.
Fig. 5
Fig. 5. RNA profiles of endothelia after RSD were dependent on microglia.
A Continuing with the scRNAseq analysis in Fig. 1, UMAP subclustering of Cdh5+ endothelia (1659 cells) shows six distinct clusters. B Distribution of the Cdh5+ endothelia clusters within the four groups: Con-Veh, Stress-Veh, Con-PLX, and Stress-PLX. C Pie charts reflect the proportion of each endothelia cluster of the total within the four groups. D The top genes expressed (Log2FC) in each endothelia cluster are shown (p-adj < 0.05). E GO function for each AC. F IPA of canonical pathways of differentially expressed genes between clusters EC 2,3, and 5. G Dot plot of selected genes from EC3 across all four groups. H Percentage of stress-induced DEGs in endothelial reversed by microglia depletion. I Dot plot shows relative and proportional expression of the top genes differentially expressed between the four groups across the endothelia clusters (EC1-6). J IPA of canonical pathways of differentially expressed genes between Stress-Veh and Stress-PLX in endothelia clusters. K GO pathways of differentially expressed genes between Stress-Veh and Stress-PLX.
Fig. 6
Fig. 6. Stress-induced social withdrawal and impaired spatial memory were microglia-dependent.
A Male C57BL/6 mice were administered diets supplemented with Vehicle (Veh) or PLX5622 (PLX) for 14 d. Next, mice were subjected to RSD (stress) or left undisturbed (control). Mice were on diets for the duration of the experiment. Fourteen hours after RSD, social avoidance of a CD1 aggressor, social interaction with a novel juvenile, and working memory (Y-Maze) were assessed. After testing, samples were collected. B Spleen weight 14 h after RSD (n = 6–10). C Representative images and D mean fluorescence intensity (MFI) of ΔFosB labeling in the hippocampus (n = 4). E Representative images, F percent area and G count of IBA1+ cells in the hippocampus (n = 6–8). H Social avoidance of a CD1 aggressor mouse and total distance (cm) traveled during testing (n = 6–8). I Time spent in the interaction zone with the CD1 aggressor mouse during social avoidance testing. J Time spent in the corner zone during social avoidance testing. In a separate experiment, social interaction with a novel juvenile and Y-Maze were determined. K Social interaction with a novel C57BL/6 juvenile mouse and distance total distance (cm) traveled during testing (n = 8–10). L Time spent in the interaction zone with the C57BL/6 juvenile mouse. M Time spent in the corner zone during social interaction testing. In the same mice, working memory in the Y-Maze was also determined (n = 6–10). N Y-Maze assessment and total arm alternation during testing. O The percentage of successful spontaneous alternations during Y-Maze testing. Graphs represent the mean ± SEM, and individual data points are provided. Means with (*) are significantly different from controls (p < 0.05). Means with (#) tended to be different from controls (p = 0.06).
Fig. 7
Fig. 7. Single-nuclei RNA sequencing in the hippocampus after RSD.
A Male C57BL/6 mice were administered diets supplemented with Vehicle (Veh) or PLX5622 (PLX) for 14 d. Next, mice were subjected to RSD (stress) or left undisturbed (control). Mice were on diets for the duration of the experiment. Fourteen hours after RSD, the hippocampus was dissected and pooled (3 mice per group). Nuclei were collected, fixed, barcoded and nucleus RNA profiles were determined by snRNAseq. B UMAP clustering from a total of 27,897 nuclei identified 15 unique cell clusters. C Dot plot shows the expression of cell-specific markers in the 15 cell clusters. D Pie chart showing the distribution of nuclei identities across all sequenced nuclei. E Annotation of each cell cluster based on markers detected within the ConservedMarkers function. F UMAP clustering from a total of 23,966 Snap25+ neuronal nuclei identified 15 unique neuronal clusters. G Expression of neuronal-specific markers found within the ConservedMarkers function: neuron (Snap25), inhibitory (Gad2), Cajal-Retzius (Trp73), dentate gyrus (Prox1), CA1 (Mpped1), CA3 (Mndal), CA2 (Ptpn5), projecting (Foxp2 and Tcfl2). H Neuronal cluster distribution for each group: Con-Veh, Stress-Veh, Con-PLX, and Stress-PLX. I Annotation of neuronal subtype based on the ConservedMarkers function. Clustering and differential expression were determined using uniform manifold approximation and projections (UMAP) clustering command in Seurat. Pooled samples for 3 replicates.
Fig. 8
Fig. 8. Both microglia-dependent and independent profiles of hippocampal neurons were evident after stress.
Continuing with the snRNAseq of Snap25+ neurons, differentially expressed genes (DEG) were assessed. A Hippocampal diagram with the number of (DEG) influenced by RSD and dependent on microglia in DG, CA2/3, CA1 and INH neurons. Number of microglia nuclei in snRNAseq data set for the control and PLX5622 groups are shown. B Gene Ontology (GO) function analysis for stress-induced DEGs (p-adj < 0.05) in DG neurons reversed or unaffected by microglia depletion (PLX). C GO function analysis for stress-induced DEGs (p-adj < 0.05) in CA2/3 neurons reversed or unaffected by microglia depletion (PLX). D GO function for stress-induced DEGs (p-adj < 0.05) in CA1 neurons reversed or unaffected by microglia depletion (PLX). E GO function analysis for stress-induced DEGs (p-adj < 0.05) in INH neurons reversed or unaffected by microglia depletion (PLX). Dot plot shows relative and proportional expression of stress-induced DEGs (p-adj < 0.05) that were reversed or unaffected by microglia depletion (PLX) in F DG neurons, G CA2/3 neurons, H CA1 neurons, and I INH neurons.
Fig. 9
Fig. 9. Canonical pathways enriched in hippocampal neurons after stress were both microglia-dependent and independent.
Continuing of the snRNAseq of Snap25+ neurons, DEGs (p-adj < 0.05) were used in IPA to determine significant (z-score ≥ ±1.5) canonical pathways in DG, CA2/3, CA1 and INH neurons with Stress-Veh, Stress-PLX, and Stress-PLX vs Stress-Veh comparisons. A Heatmap of significant (z-score ≥ ±1.5) canonical pathways for Stress-Veh, Stress-PLX, and Stress-PLX vs Stress-Veh in hippocampal dentate gyrus (Prox1) neurons. B Heatmap of significant (z-score ≥ ±1.5) canonical pathways for Stress-Veh, Stress-PLX, and Stress-PLX vs Stress-Veh in hippocampal CA2/3 (Ptpn5 or Mndal), neurons. C Heatmap of significant (z-score ≥ ±1.5) canonical pathways for Stress-Veh, Stress-PLX, and Stress-PLX vs Stress-Veh in hippocampal CA1 (Mpped1) neurons. D Heatmap of significant (z-score ≥ ±1.5) canonical pathways for Stress-Veh, Stress-PLX, and Stress-PLX vs Stress-Veh in hippocampal inhibitory (Gad1/2) neurons.

References

    1. Ressler, K. J. Amygdala activity, fear, and anxiety: modulation by stress. Biol. Psychiatry67, 1117–1119 (2010). - PMC - PubMed
    1. Miller, G. E. et al. Greater inflammatory activity and blunted glucocorticoid signaling in monocytes of chronically stressed caregivers. Brain Behav. Immun.41, 191–199 (2014). - PMC - PubMed
    1. Weber, M. D. et al. The influence of microglial elimination and repopulation on stress sensitization induced by repeated social defeat. Biol. Psychiatry85, 667–678 (2019). - PMC - PubMed
    1. McKim, D. B. et al. Social stress mobilizes hematopoietic stem cells to establish persistent splenic myelopoiesis. Cell Rep.25, 2552–2562.e3 (2018). - PMC - PubMed
    1. Biltz, R. G., Sawicki, C. M., Sheridan, J. F. & Godbout, J. P. The neuroimmunology of social-stress-induced sensitization. Nat. Immunol.23, 1527–1535 (2022). - PMC - PubMed

Substances