. 2024 Sep 28;7(1):1211.
doi: 10.1038/s42003-024-06909-9.

The chromatin landscape of high-grade serous ovarian cancer metastasis identifies regulatory drivers in post-chemotherapy residual tumour cells

Affiliations

The chromatin landscape of high-grade serous ovarian cancer metastasis identifies regulatory drivers in post-chemotherapy residual tumour cells

W Croft et al. Commun Biol. .

Abstract

Disease recurrence following chemotherapy is a major clinical challenge in ovarian cancer (OC), but little is known regarding how the tumour epigenome regulates transcriptional programs underpinning chemoresistance. We determine the single cell chromatin accessibility landscape of omental OC metastasis from treatment-naïve and neoadjuvant chemotherapy-treated patients and define the chromatin accessibility profiles of epithelial, fibroblast, myeloid and lymphoid cells. Epithelial tumour cells display open chromatin regions enriched with motifs for the oncogenic transcription factors MEIS and PBX. Post chemotherapy microenvironments show profound tumour heterogeneity and selection for cells with accessible chromatin enriched for TP53, TP63, TWIST1 and resistance-pathway-activating transcription factor binding motifs. An OC chemoresistant tumour subpopulation known to be present prior to treatment, and characterised by stress-associated gene expression, is enriched post chemotherapy. Nuclear receptors RORa, NR2F6 and HNF4G are uncovered as candidate transcriptional drivers of these cells whilst closure of binding sites for E2F2 and E2F4 indicate post-treated tumour having low proliferative capacity. Delineation of the gene regulatory landscape of ovarian cancer cells surviving chemotherapy treatment therefore reveals potential core transcriptional regulators of chemoresistance, suggesting novel therapeutic targets for improving clinical outcome.


Conflict of interest statement

The authors declare no competing interests.

Figures
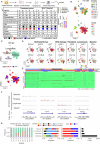
Fig. 1
Fig. 1. Chromatin landscape defined major cell types in HGSOC omental metastasis.
A Methods and cohort summary. CRS chemotherapy response score (1 = poor; 2 = moderate); Cytoreduction (R0 = removed all macroscopically visible disease; R2 = disease of min 1 cm remains following surgery); Blood CA-125 level (u/ml). Created with BioRender. B UMAP embedding of all patient-integrated scATAC data overlaid with patient label (top) and unsupervised clustering label (bottom), C UMAP embeddings overlaid with major cell lineage annotation and neo-adjuvant chemotherapy treatment (NACT). D Gene activity scores of major cell type defining genes. E Profile of copy number alterations (CNAs) detected across all cell types. F Major cell lineage aggregated chromatin accessibility profile at major cell lineage defining gene loci. G (left-to-right) Cluster composition of each sample; Sample composition, NACT treatment composition and total number of cells for each major lineage cell type.
Fig. 2
Fig. 2. Chromatin accessibility profile: peaks and enriched motif markers of major cell types in HGSOC omental metastasis.
A Single-cell chromatin accessibility profile at major lineage defining marker peaks (shown are top 20 differential peaks by cell type having adjusted p < 0.001). B Patient-cell-type average chromVar transcription factor motif activity score profile of differentially enriched cell type marker motifs (shown are top 10 motifs by cell type having adjusted p < 0.001).
Fig. 3
Fig. 3. Modulation of the chromatin accessibility landscape and transcription factor binding motif enrichments following chemotherapy.
A Proportion of total stratified by chemotherapy. Points represent the within-sample cluster fraction and p value determined by Mann–Whitney test. B Summary counts of differentially accessible chromatin (DAC) sites open/closed post chemotherapy. C Differential accessibility of chromatin sites between treatment-naïve (pre) and post chemotherapy (post) samples. Coloured points indicate DACs (adjusted p < 0.01 and absolute log2FC > 0.25). Motif sequence logos presented for the top 3 motifs enriched within open/closed peak sites. D Aggregated accessibility profile of selected DACs stratified by treatment. Tracks Y scale represents normalised fragment count. E Within patient-cell-type average transcription factor motif chromVar activity score profile of motifs identified as differentially enriched (adjusted p < 0.01). F Intersections of differentially increased gene activity (expression) with enriched motifs in pre NACT treated tumour cells (top) and post NACT-treated tumour cells (bottom). G Aggregated accessibility profile of selected transcription factors.
Fig. 4
Fig. 4. Epithelial cell hallmark gene activity module scores following chemotherapy.
Mean module scores for selected MSigDB Hallmark gene sets calculated on epithelial tumour cells for each sample and stratified by neoadjuvant chemotherapy treatment. Wilcoxon rank sum test **p < 0.01, *p < 0.05.
Fig. 5
Fig. 5. Transcriptional drivers of chemotherapy enriched stress-associated tumour cells.
A UMAP embedding of epithelial cells overlaid with sample label (upper) and cluster (lower). B Dot plot gene and motif activity profile of selected tumour genes/motifs of interest. Dot size indicates the percentage of the population showing gene/motif activity. C UMAP embedding of epithelial cells stratified by pre/post chemotherapy treatment overlaid with tumour stress signature gene activity score. D Distribution of per-cell stress score stratified by chemotherapy. E Distribution of per-sample mean stress score stratified by chemotherapy. F Significant Spearman rank correlation of per sample chromVar motif activity score with tumour stress signature gene activity score (top 6 significant +ve and −ve correlations are shown).
Fig. 6
Fig. 6. Matched pre vs. post chemotherapy tumour cell chromatin profile in a patient with comparably long progression free survival.
A UMAP embedding of all epithelial tumour cells from patient A overlaid with unsupervised clustering and pre/post chemotherapy sample label. B Cluster proportions stratified by chemotherapy treatment. C Differentially active genes and differentially enriched transcription factor binding motifs between pre vs. post chemotherapy-treated tumour cells. Differential genes (adjusted p value < 0.001 and absolute log2FC > 1); differential motifs (adjusted p value < 0.001); Top 10 significant (ranked by fold change) up/downregulated are labelled. D Hierarchical clustering of copy number alteration profile. E Intersections of differentially increased genes with differentially enriched motifs present in pre NACT treated tumour cells (left) and post NACT-treated tumour cells (right).

Similar articles

References

    1. Bowtell, D. D. et al. Rethinking ovarian cancer II: reducing mortality from high-grade serous ovarian cancer. Nat. Rev. Cancer15, 668–679 (2015). - PMC - PubMed
    1. Lisio, M. A., Fu, L., Goyeneche, A., Gao, Z. H. & Telleria, C. High-grade serous ovarian cancer: basic sciences, clinical and therapeutic standpoints. Int. J. Mol. Sci.20, 952 (2019). - PMC - PubMed
    1. Lengyel, E. Ovarian cancer development and metastasis. Am. J. Pathol.177, 1053–1064 (2010). - PMC - PubMed
    1. Ortiz, M., Wabel, E., Mitchell, K. & Horibata, S. Mechanisms of chemotherapy resistance in ovarian cancer. Cancer Drug Resist.5, 304–316 (2022). - PMC - PubMed
    1. Galluzzi, L. et al. Molecular mechanisms of cisplatin resistance. Oncogene31, 1869–1883 (2012). - PubMed