. 2024 Sep 28;14(1):22443.
doi: 10.1038/s41598-024-73325-8.

Exploring the prognostic value of T follicular helper cell levels in chronic lymphocytic leukemia

Affiliations

Exploring the prognostic value of T follicular helper cell levels in chronic lymphocytic leukemia

Rui Zhang et al. Sci Rep. .

Abstract

Chronic lymphocytic leukemia (CLL) presents with heterogeneous clinical outcomes, suggesting varied underlying pathogenic mechanisms. This study aims to elucidate the impact of T follicular helper (Tfh) cells on CLL progression and prognosis. Gene expression profile data for CLL were collected from GSE22762 and GSE39671 datasets. Patients were divided into high and low groups using Tfh levels using the optimal cutoff value based on overall survival (OS) and time-to-first treatment (TTFT). Differential expression analysis was performed between these groups, followed by co-expression network analysis and single-sample Gene Set Enrichment Analysis (ssGSEA). Marker genes of Tfh cells were used to construct prognostic models. Additionally, 40 CLL patients were recruited and categorized based on median Tfh levels. Marker gene expression was assessed using RT-qPCR and Western Blot, and immune cell levels were determined through flow cytometry. The high group showed better prognosis compared to the low group. Among the 1121 differentially expressed genes identified, five co-expression networks were constructed, with the turquoise module showing the highest correlation with Tfh cells. Genes within this module significantly participate in cytokine-cytokine receptor interaction, PI3K-Akt signaling pathway, and natural killer cell mediated cytotoxicity. Tfh cells were significantly negatively correlated with activated B cells and positively correlated with Tregs. The Random Survival Forest (RSF) model identified 10 marker genes, and further analysis using Lasso regression and nomogram selected CLEC4A, RAE1, CD84, and PRDX1 as prognostic markers. In the high group, levels of CLEC4A and RAE1 were higher than in the low group, whereas CD84 and PRDX1 were lower. Flow cytometry revealed that the level of activated B cells in the high Tfh group was significantly lower than in the low Tfh group, while the level of Tregs is significantly higher in the high Tfh group. This study seeks to contribute to a more detailed understanding of the pathogenesis of CLL, delving into the prognostic significance of Tfh.

Keywords: Chronic lymphocytic leukemia; Prognostic genes; Tfh; Time-to-first treatment.


Conflict of interest statement

The authors declare no competing interests.

Figures

Fig. 1
Fig. 1
The flowchart of this study.
Fig. 2
Fig. 2
Identification of high and low Tfh groups in CLL patients. (A) Kaplan-Meier plot showing OS for CLL patients with high (H) versus low (L) T follicular helper groups based on the optimal cutoff value determined with OS in GSE22671. (B) Kaplan-Meier plot showing OS for CLL patients with high (H) versus low (L) T follicular helper groups based on the optimal cutoff value determined with time to first treatment (TTFT) in GSE22671. (C) Kaplan-Meier plot showing OS for CLL patients with high (H) versus low (L) T follicular helper groups based on the optimal cutoff value determined with time to first treatment (TTFT) in GSE39671. (D) Volcano plots of differentially expressed genes (DEGs) between high and low Tfh groups with OS in GSE22671. (E) Volcano plots of differentially expressed genes (DEGs) between high and low Tfh groups with TTFT in GSE22671. (F) Volcano plots of differentially expressed genes (DEGs) between high and low Tfh groups with TTFT in GSE39671. (G) Venn diagram showing the overlap of DEGs associated with OS in GSE22762, TTFT in GSE22762, and TTFT in GSE39671.
Fig. 3
Fig. 3
Co-expression network analysis and biological function characterization. (A) Dendrogram obtained from hierarchical clustering using WGCNA, with branches representing genes and colors below indicating identified modules through dynamic tree cutting. (B) Heatmap of module-trait relationships. (C) GO enrichment analysis for turquoise module. The most significantly enriched biological processes (BP), cellular components (CC), and molecular functions (MF). (D) KEGG pathways enriched by genes within turquoise module.
Fig. 4
Fig. 4
Correlation of Tfh cell levels with pathway activation in CLL. (A) GSEA for the high and low Tfh group based on TTFT in GSE22671 showing enriched pathways at the top-ranked portion of the gene list. (B) GSEA for the high and low Tfh group based on TTFT in GSE39671 showing enriched pathways at the top-ranked portion of the gene list. NES normalized enrichment score, NP nominal p value. (C) Heatmap displaying the correlation coefficients between Tfh cell levels and pathways in GSE22671. (D) Heatmap displaying the correlation coefficients between Tfh cell levels and pathways in GSE39671.
Fig. 5
Fig. 5
Comparative immune cell type expression and correlation with Tfh levels in CLL. (A) Boxplots displaying the expression levels of immune cell types categorized into high and low Tfh groups based on TTFT in GSE22671. (B) Boxplots displaying the expression levels of immune cell types categorized into high and low Tfh groups based on TTFT in GSE39671. (C) Heatmap of correlation coefficients between the expression levels of different immune cell types and Tfh cell levels in GSE22671. (D) Heatmap of correlation coefficients between the expression levels of different immune cell types and Tfh cell levels in GSE39671.
Fig. 6
Fig. 6
Performance of prognostic models and correlation with clinical outcomes in CLL. (A) Bar chart comparing the performance of main machine learning models in predicting clinical outcomes for CLL. (B) Risk model constructed by ten genes of RSF in GSE22762. (C) Kaplan-Meier survival curve detailing the survival probability for the high-risk and low-risk group. HR, hazard ratios. (D) Risk model constructed by ten genes of RSF in GSE39671. (E) Kaplan-Meier survival curve detailing the survival probability for the high-risk and low-risk group. HR, hazard ratios. (F) A nomogram predicted survival probabilities at 12, 36, and 60 months based on ten genes of RSF model. (G) Calibration curves assessing the nomogram’s predictive accuracy.
Fig. 7
Fig. 7
Predictive modeling and survival analysis selecting prognostic markers. (A) Lasso coefficient profiles of prognostic markers across a range of lambda values in CLL. (B) Partial likelihood deviance plot for model tuning across different λ values. (C) Risk model constructed based on markers of Lasso model. (D) Receiver operating characteristic curves evaluating the model’s discriminative ability. AUC, area under the curve. (E) Kaplan-Meier survival plots stratified by low and high-risk groups calculated from the risk model. (F) A prognostic nomogram integrating the expression of selected markers to predict the probability of survival at 12, 36, and 60 months. (G) Calibration plots demonstrating the accuracy of the nomogram’s predictions compared to actual observed outcomes.
Fig. 8
Fig. 8
Analysis of prognostic markers in CLL. (A) Forest plot illustrating the hazard ratios and 95% confidence intervals (CIs) for prognostic markers in predicting CLL outcomes in terms of OS in GSE22671. HR, hazard ratio. (B) Forest plot illustrating the hazard ratios and 95% confidence intervals (CIs) for prognostic markers in predicting CLL outcomes in terms of TTFT in GSE39671. HR, hazard ratio. Expression of prognostic markers in high Tfh and low Tfh group in terms of OS in GSE22671 (C), TTFT in GSE22671 (D), and in GSE39671 (E). *P < 0.05, **P < 0.01, ***P < 0.001.
Fig. 9
Fig. 9
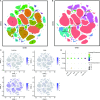
Expression mapping and immune cell landscape in scRNA-seq data in GSE165087. (A) t-SNE showing distinct cellular clusters. (B) t-SNE showing identified immune cell types. (C) Expression density maps for CLEC4A, CD84, PRDX1, and RAE1 across the t-SNE landscape. (D) Expression bubble plot for CLEC4A, CD84, PRDX1, and RAE1 across cell types.
Fig. 10
Fig. 10
The levels of prognostic markers and immune cells in 20 high Tfh patients and 20 low Tfh patients with three biological replicates. (A) The mRNA levels of prognostic markers detected by RT-qPCR. (B) The protein expression of prognostic markers detected by Western blot. Original blots are presented in Figure S2. (C) The levels of immune cells detected by flow cytometry. *P < 0.05, **P < 0.01, ***P < 0.001.

Similar articles

Cited by

References

    1. Kennedy, E. et al. TLR9 expression in chronic lymphocytic leukemia identifies a promigratory subpopulation and novel therapeutic target. Blood 137 (22), 3064–3078 (2021). - PMC - PubMed
    1. Kipps, T. J. et al. Chronic lymphocytic leukaemia. Nat. Rev. Dis. Primers 3, 16096 (2017). - PMC - PubMed
    1. Hengeveld, P. J. et al. High-throughput proteomics identifies THEMIS2 as independent biomarker of treatment-free survival in untreated CLL. Hemasphere 7 (10), e951 (2023). - PMC - PubMed
    1. Agius, R. et al. Machine learning can identify newly diagnosed patients with CLL at high risk of infection. Nat. Commun. 11 (1), 363 (2020). - PMC - PubMed
    1. Wu, X. et al. Altered T follicular helper cell subsets and function in chronic lymphocytic leukemia. Front. Oncol. 11, 674492 (2021). - PMC - PubMed

Substances

LinkOut - more resources