. 2024 Sep 28;14(1):22421.
doi: 10.1038/s41598-024-73118-z.

Single and double quantum transitions in spin-mixed states under photo-excitation

Affiliations

Single and double quantum transitions in spin-mixed states under photo-excitation

Anand Patel et al. Sci Rep. .

Abstract

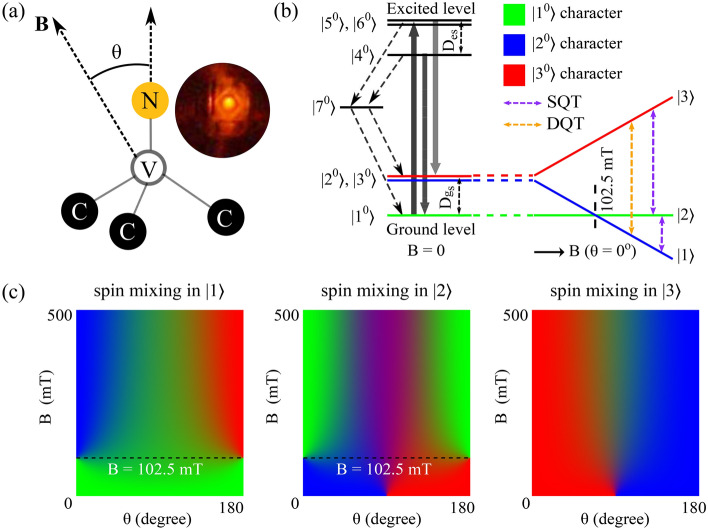
Electronic spins associated with the Nitrogen-Vacancy (NV) center in diamond offer an opportunity to study spin-related phenomena with extremely high sensitivity owing to their high degree of optical polarization. Here, we study both single- and double-quantum transitions (SQT and DQT) in NV centers between spin-mixed states, which arise from magnetic fields that are non-collinear to the NV axis. We demonstrate the amplification of the ESR signal from both these types of transition under laser illumination. We obtain hyperfine-resolved X-band ESR signal as a function of both excitation laser power and misalignment of static magnetic field with the NV axis. This, combined with our analysis using a seven-level model that incorporates thermal polarization and double quantum relaxation, allows us to comprehensively analyze the polarization of NV spins under off-axis fields. Such detailed understanding of spin-mixed states in NV centers under photo-excitation can help greatly in realizing NV-diamond platform's potential in sensing correlated magnets and biological samples, as well as other emerging applications, such as masing and nuclear hyperpolarization.


Conflict of interest statement

The authors declare no competing interests.

Figures

Fig. 1
Fig. 1
Mixing of Nitrogen Vacancy (NV) spin sub-levels in seven-level (kinetic) model used in this study. (a) Atomic configuration of the NV center with a substitutional nitrogen (N) atom in adjacent to a vacancy (V) defect in the diamond lattice. The line joining the two, called NV-axis, is used as reference for degree of NV defect misalignment (polar angle θ) with the applied magnetic field B. Inset shows the real-time (red) fluorescence image of NV-containing diamond single crystal under (green) laser illumination. (b) Schematic seven-level electronic structure of the NV center, showing optical excitation, spin-conserving radiative decay (solid lines) and nonradiative, spin-selective intersystem crossing (dashed lines) via the metastable singlet state |7. The labels with a superscript 0 represent the seven zero-field eigenstates for each spin-pure sub-level (ms=0,±1). For the simplest case of aligned magnetic fields, B(B, θ = 0), a Zeeman splitting of the ground state (degenerate) spin sub-levels is also shown, with possible SQT (violet) and DQT (orange dashed lines) between them under (resonant) microwave excitation. DQT is only weakly allowed in θ=0 case under local strain effects. (c) The calculated spin-mixing of (ground-state) spin sub-levels as a function of B(B, θ). Green, blue, and red represent the |10,|20,|30 character or |αi1|2,|αi2|2,|αi3|2 coefficients (see Eq. 2) respectively where |i is the given state.
Fig. 2
Fig. 2
Schematic for ESR spectroscopy of NV spin-mixed states under photo-excitation. (a) The (100) diamond crystal was oriented at 45 and glued to the quartz tube (yellow), which is inserted into a X-Band TE011 cylindrical cavity (blue). It can then be rotated about its axis to achieve the desired degree of NV defect misalignment (θ) with external B (see Section “Methods” for details). The induced spin-mixed states is studied by applying (resonant) microwaves (in dashed lines) in dark and under laser illumination via the optical access of the cavity. (b) Representative ESR spectra demonstrating the inversion and amplification of NV single-quantum ESR (|1|2) signal under photo-excitation.
Fig. 3
Fig. 3
Single-quantum ESR spectroscopy of NV spin-mixed states under laser illumination. (a) (Integrated) single-quantum ESR spectra of NV centers after baseline correction (in blue symbols) measured under the maximum laser intensity of 83 mW/mm2 at selected degrees (θ=0 and 70.5) of NVs orientation relative to B (see supplementary information for ESR spectra at all θ in Fig. S3). The ESR intensity is analyzed by fitting to multiple Lorentzian peaks, associated with hyperfine splitting of the electronic transition. (b) The extracted resonant fields for the SQTs at all θ (in black and blue symbols) are compared to the theoretical values (in red lines) obtained by solving the ground state Hamiltonian (Eq. 1). The error bars for the experimental data are contained within the markers (within ±10-4mT).
Fig. 4
Fig. 4
Optically-induced spin polarization of single-quantum transitions in NV centers. Spin polarization between the eigen-states of SQTs calculated from the ESR line intensities (in symbols) using Eq. (3) as a function of (a) the degree of magnetic field misalignment, θ under the highest laser intensity of 83 mW/mm2 and (b) the laser intensity for selected θ = 0o and 70.5o. The experimental values are compared to the spin polarization values (in red lines) calculated from the seven level kinetic model using Eq. (7) with parameters given in Table 1. The broken line represents thermal polarisation at room temperature (5×10⁻⁴). The error bars for the experimental data are contained within the markers (within ±2×10⁻⁴).
Fig. 5
Fig. 5
Double-quantum ESR spectroscopy of NV centers in off-axis magnetic fields. (a) (Integrated) ESR spectra under the laser illumination of 83mW/mm2, after baseline correction, of DQT between spin-mixed states at θ=20 (in blue symbols), with fitting into multiple hyperfine peaks with a Lorentzian profile. (b) The extracted resonant fields at different θ are plotted against the theoretical values (in red line) derived from the ground state Hamiltonian (Eq. 1). (c) The experimentally calculated spin polarization (in symbols) using Eq. (3) for DQT at different θ are compared to the values obtained from the kinetic calculations using Eq. (7) with parameters given in Table 1. The broken line in (c) represents thermal polarisation at room temperature (5×10⁻⁴). The error bars for the experimental data are contained within the markers (within ±3×10⁻⁵mT in (b) and ±4×10⁻⁴ in (c)).

Similar articles

References

    1. Schirhagl, R., Chang, K., Loretz, M. & Degen, C. L. Nitrogen-vacancy centers in diamond: Nanoscale sensors for physics and biology. Annu. Rev. Phys. Chem.65, 83–105 (2014). - PubMed
    1. Herbschleb, E. et al. Ultra-long coherence times amongst room-temperature solid-state spins. Nat. Commun.10, 3766 (2019). - PMC - PubMed
    1. Degen, C. L. Scanning magnetic field microscope with a diamond single-spin sensor. Appl. Phys. Lett.92, 243111 (2008).
    1. Taylor, J. M. et al. High-sensitivity diamond magnetometer with nanoscale resolution. Nat. Phys.4, 810–816 (2008).
    1. Bhallamudi, V. P. & Hammel, P. C. Nanoscale MRI. Nat. Nanotechnol.10, 104–106 (2015). - PubMed

LinkOut - more resources