Exosome-related gene identification and diagnostic model construction in hepatic ischemia-reperfusion injury
- PMID: 39341981
- PMCID: PMC11439056
- DOI: 10.1038/s41598-024-73441-5
Exosome-related gene identification and diagnostic model construction in hepatic ischemia-reperfusion injury
Abstract
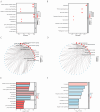
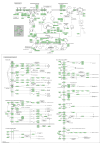
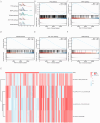
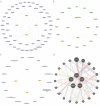
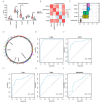
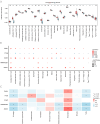
Hepatic ischemia-reperfusion injury (HIRI) may cause severe hepatic impairment, acute hepatic insufficiency, and multiorgan system collapse. Exosomes can alleviate HIRI. Therefore, this study explored the role of exosomal-related genes (ERGs) in HIRI using bioinformatics to determine the underlying molecular mechanisms and novel diagnostic markers for HIRI. We merged the GSE12720, GSE14951, and GSE15480 datasets obtained from the Gene Expression Omnibus (GEO) database into a combined gene dataset (CGD). CGD was used to identify differentially expressed genes (DEGs) based on a comparison of the HIRI and healthy control cohorts. The impact of these DEGs on HIRI was assessed through gene set enrichment analysis (GSEA) and gene set variation analysis (GSVA). ERGs were retrieved from the GeneCards database and prior studies, and overlapped with the identified DEGs to yield the set of exosome-related differentially expressed genes (ERDEGs). Functional annotations and enrichment pathways of these genes were determined using Gene Ontology (GO) and Kyoto Encyclopedia of Genes and Genomes (KEGG) analyses. Diagnostic models for HIRI were developed using least absolute shrinkage and selection operator (LASSO) regression and support vector machine (SVM) algorithms. Key genes with diagnostic value were identified from the overlap, and single-sample gene-set enrichment analysis (ssGSEA) was conducted to evaluate the immune infiltration characteristics. A molecular regulatory interaction network was established using Cytoscape software to elucidate the intricate regulatory mechanisms of key genes in HIRI. Finally, exosome score (Es) was obtained using ssGSEA and the HIRI group was divided into the Es_High and Es_Low groups based on the median Es. Gene expression was analyzed to understand the impact of all genes in the CGD on HIRI. Finally, the relative expression levels of the five key genes in the hypoxia-reoxygenation (H/R) model were determined using quantitative real-time PCR (qRT-PCR). A total of 3810 DEGs were identified through differential expression analysis of the CGD, and 61 of these ERDEGs were screened. Based on GO and KEGG enrichment analyses, the ERDEGs were mainly enriched in wound healing, MAPK, protein kinase B signaling, and other pathways. GSEA and GSVA revealed that these genes were mainly enriched in the TP53, MAPK, TGF[Formula: see text], JAK-STAT, MAPK, and NFKB pathways. Five key genes (ANXA1, HNRNPA2B1, ICAM1, PTEN, and THBS1) with diagnostic value were screened using the LASSO regression and SVM algorithms and their molecular interaction network was established using Cytoscape software. Based on ssGSEA, substantial variations were found in the expression of 18 immune cell types among the groups (p < 0.05). Finally, the Es of each HIRI patient was calculated. ERDEGs in the Es_High and Es_Low groups were enriched in the IL18, TP53, MAPK, TGF[Formula: see text], and JAK-STAT pathways. The differential expression of these five key genes in the H/R model was verified using qRT-PCR. Herein, five key genes were identified as potential diagnostic markers. Moreover, the potential impact of these genes on pathways and the regulatory mechanisms of their interaction network in HIRI were revealed. Altogether, our findings may serve as a theoretical foundation for enhancing clinical diagnosis and elucidating underlying pathogeneses.
Keywords: Diagnostic marker; Exosome; GEO; Hepatic ischemia-reperfusion injury; Immune microenvironment.
© 2024. The Author(s).
Conflict of interest statement
The authors declare no competing interests.
Figures






Similar articles
-
Identification and validation of potential diagnostic signature and immune cell infiltration for HIRI based on cuproptosis-related genes through bioinformatics analysis and machine learning.Front Immunol. 2024 Apr 16;15:1372441. doi: 10.3389/fimmu.2024.1372441. eCollection 2024. Front Immunol. 2024. PMID: 38690269 Free PMC article.
-
Gene signatures associated with exosomes as diagnostic markers of postpartum depression and their role in immune infiltration.Front Endocrinol (Lausanne). 2025 Jul 17;16:1542327. doi: 10.3389/fendo.2025.1542327. eCollection 2025. Front Endocrinol (Lausanne). 2025. PMID: 40747300 Free PMC article.
-
Comprehensive analysis of cuproptosis-related genes involved in immune infiltration and their use in the diagnosis of hepatic ischemia-reperfusion injury: an experimental study.Int J Surg. 2025 Jan 1;111(1):242-256. doi: 10.1097/JS9.0000000000001893. Int J Surg. 2025. PMID: 38935114 Free PMC article.
-
JUN and ATF3 in Gout: Ferroptosis-related potential diagnostic biomarkers.Heliyon. 2024 Oct 30;10(22):e39957. doi: 10.1016/j.heliyon.2024.e39957. eCollection 2024 Nov 30. Heliyon. 2024. PMID: 39619595 Free PMC article. Review.
-
Reversible Fluorescent Probes for Dynamic Imaging of Liver Ischemia-Reperfusion Injury.Acc Chem Res. 2024 Sep 3;57(17):2594-2605. doi: 10.1021/acs.accounts.4c00449. Epub 2024 Aug 20. Acc Chem Res. 2024. PMID: 39164205 Review.
Cited by
-
Unraveling the molecular mechanisms of paclitaxel in high-grade serous ovarian cancer through network pharmacology.Sci Rep. 2025 May 12;15(1):16445. doi: 10.1038/s41598-025-00658-3. Sci Rep. 2025. PMID: 40355485 Free PMC article.
-
A machine learning model and identification of immune infiltration for chronic obstructive pulmonary disease based on disulfidptosis-related genes.BMC Med Genomics. 2025 Jan 8;18(1):7. doi: 10.1186/s12920-024-02076-2. BMC Med Genomics. 2025. PMID: 39780155 Free PMC article.
-
Discovery of Endothelial-Monocyte Crosstalk in Ischemic-Reperfusion Injury Following Liver Transplantation Based on Integration of Single-Cell RNA and Transcriptome RNA Sequencing.J Cell Mol Med. 2025 Feb;29(4):e70336. doi: 10.1111/jcmm.70336. J Cell Mol Med. 2025. PMID: 39993960 Free PMC article.
-
Understanding the complex role of exosomes in intestinal ischemia-reperfusion injury: from pathogenesis to protection.Front Pharmacol. 2025 Apr 15;16:1533628. doi: 10.3389/fphar.2025.1533628. eCollection 2025. Front Pharmacol. 2025. PMID: 40303926 Free PMC article. Review.
-
Development of an immune scoring system based on exosome-related gene expression for prognosis and treatment response prediction in breast cancer.Discov Oncol. 2025 May 30;16(1):957. doi: 10.1007/s12672-025-02702-0. Discov Oncol. 2025. PMID: 40445462 Free PMC article.
References
-
- Søreide, J. A. & Deshpande, R. Post hepatectomy liver failure (PHLF)—Recent advances in prevention and clinical management. Eur. J. Surg. Oncol. 47 (2), 216–224 (2021). - PubMed
-
- Cannistrà, M. et al. Hepatic ischemia reperfusion injury: a systematic review of literature and the role of current drugs and biomarkers. Int. J. Surg. 33 (Suppl 1), S57–S70 (2016). - PubMed
-
- Pegtel, D. M. & Gould, S. J. Exosomes. Annu. Rev. Biochem. 88: 487–514. (2019). - PubMed
-
- Ozansoy, M., Mikati, H., Velioglu, H. A. & Yulug, B. Exosomes A missing link between chronic systemic inflammation and Alzheimer’s disease. Biomed. Pharmacother. 159, 114161 (2023). - PubMed
MeSH terms
Substances
Grants and funding
LinkOut - more resources
Full Text Sources
Research Materials
Miscellaneous

