. 2024 Sep 28;7(1):1208.
doi: 10.1038/s42003-024-06823-0.

Full-length single-cell BCR sequencing paired with RNA sequencing reveals convergent responses to pneumococcal vaccination

Affiliations

Full-length single-cell BCR sequencing paired with RNA sequencing reveals convergent responses to pneumococcal vaccination

Duncan M Morgan et al. Commun Biol. .

Abstract

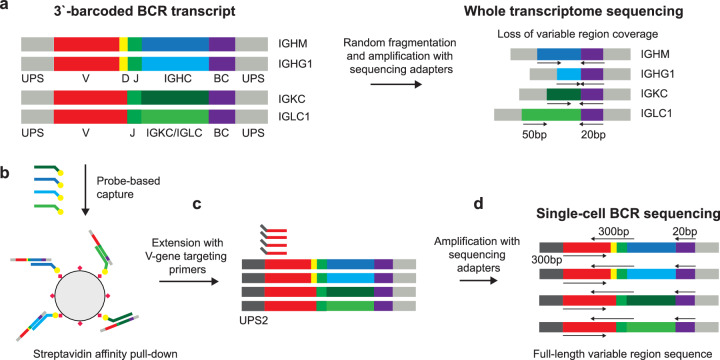
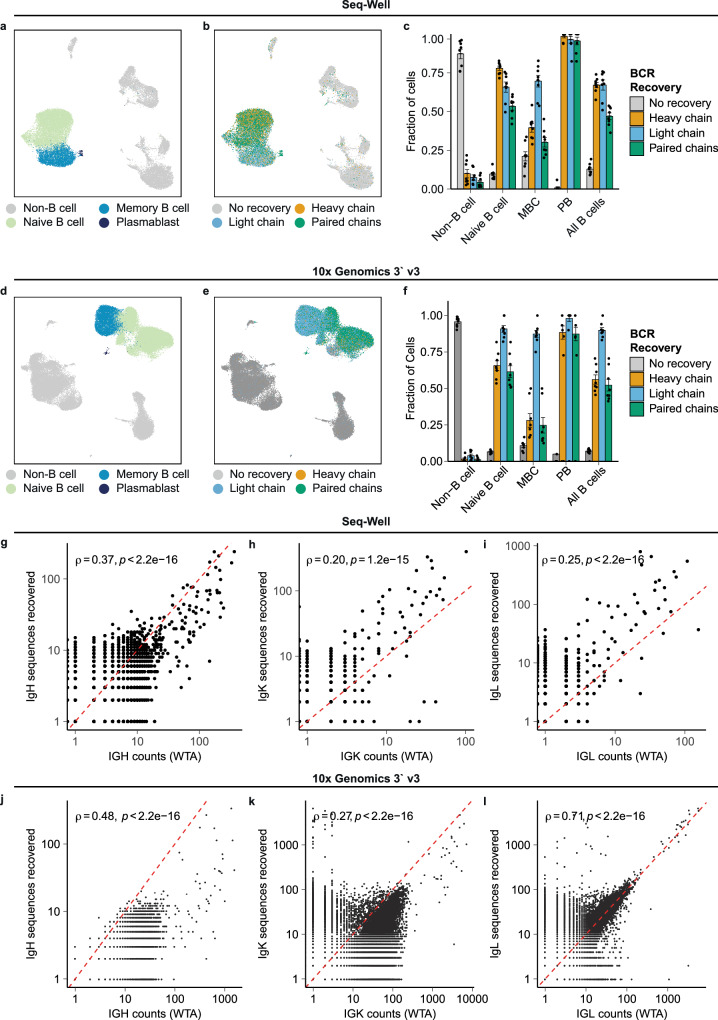
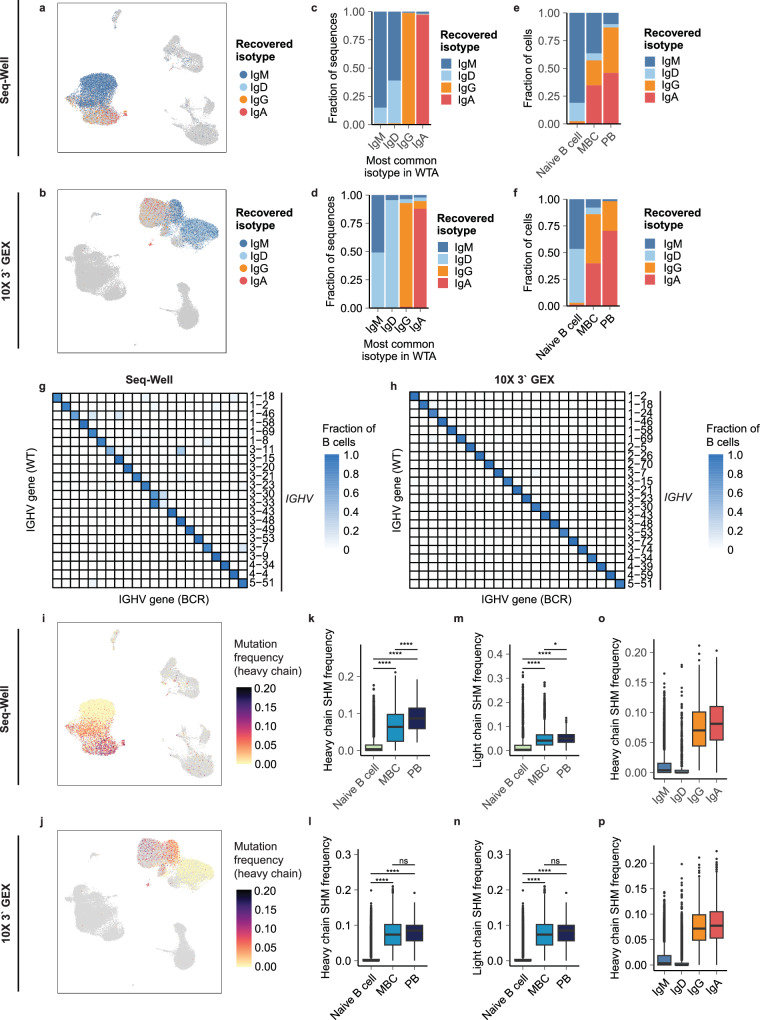
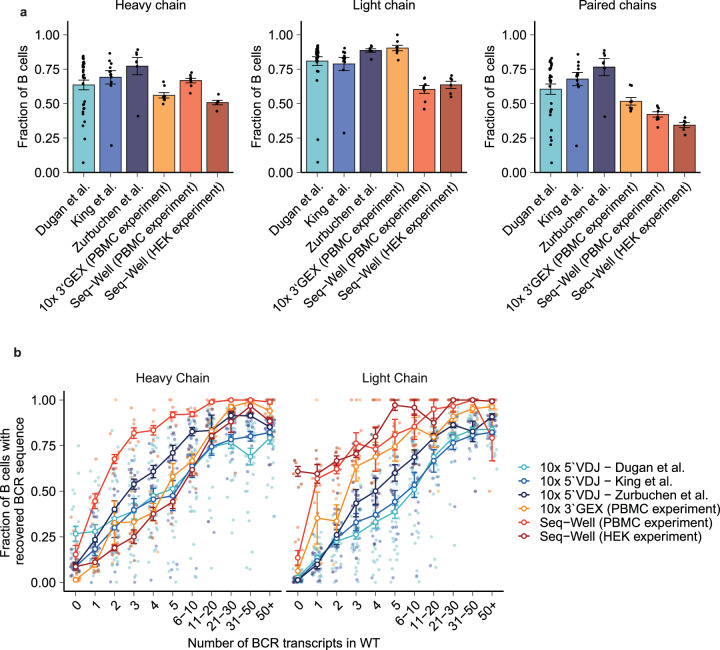
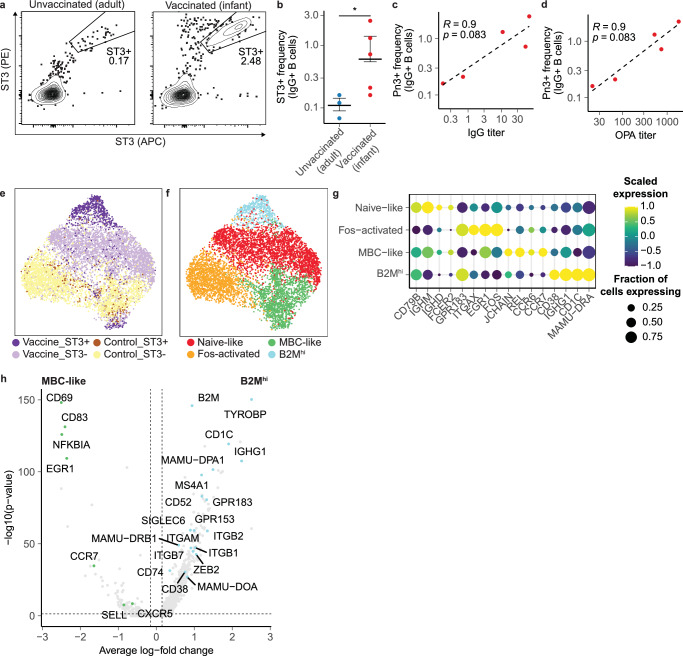
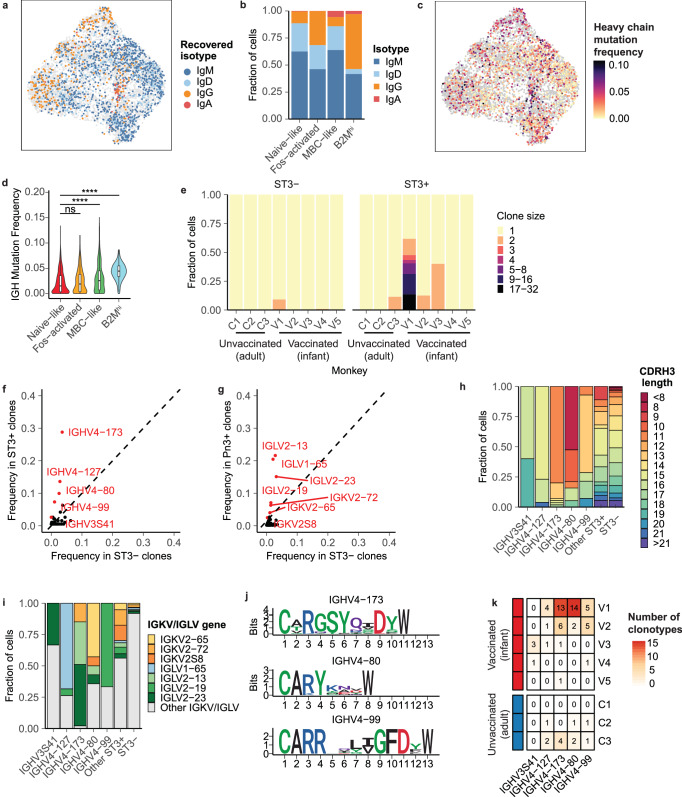
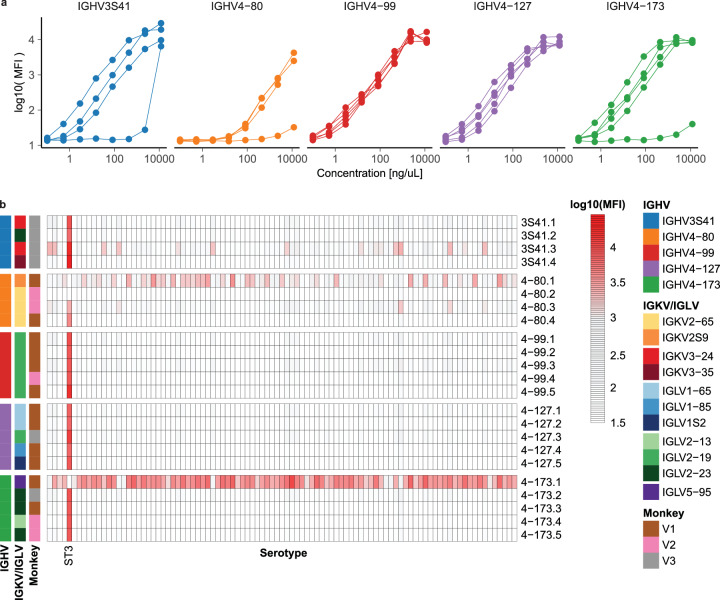
Single-cell RNA sequencing (scRNA-seq) can resolve transcriptional features from individual cells, but scRNA-seq techniques capable of resolving the variable regions of B cell receptors (BCRs) remain limited, especially from widely-used 3'-barcoded libraries. Here, we report a method that can recover paired, full-length variable region sequences of BCRs from 3'-barcoded scRNA-seq libraries. We first verify this method (B3E-seq) can produce accurate, full-length BCR sequences. We then apply this method to profile B cell responses elicited against the capsular polysaccharide of Streptococcus pneumoniae serotype 3 (ST3) by glycoconjugate vaccines in five infant rhesus macaques. We identify BCR features associated with specificity for the ST3 antigen which are present in multiple vaccinated monkeys, indicating a convergent response to vaccination. These results demonstrate the utility of our method to resolve key features of the B cell repertoire and profile antigen-specific responses elicited by vaccination.


Conflict of interest statement

The authors declare the following competing interests: J.C.L. has interests in Sunflower Therapeutics PBC, Honeycomb Biotechnologies, OneCyte Biotechnologies, SQZ Biotech, Alloy Therapeutics, QuantumCyte, Amgen, and Repligen (these interests are reviewed and managed under Massachusetts Institute of Technology’s policies for potential conflicts of interest); in addition, he receives sponsored research support at Massachusetts Institute of Technology from Amgen, the Bill and Melinda Gates Foundation, Biogen, Pfizer, Sartorius, Mott Corp, TurtleTree, Takeda, and Sanofi, and his spouse is an employee of Sunflower Therapeutics PBC. J.K., M.M., S.S., L.J., N.S., I.K., and L.C. are employees of Pfizer and may, as a consequence, be shareholders. Pfizer was involved in the design, analysis, and interpretation of the data in this research study, the writing of this report, and the decision to publish. SUP consults for Mabylon and Buhlmann and conducts a clinical trial for Regeneron. The other authors declare no competing interests.

Figures

Fig. 1
Fig. 1. Workflow of recovering BCR sequences from 3‘-barcoded single-cell gene expression sequencing libraries.
a For 3‘-barcoded scRNA-seq libraries, the random fragmentation leads to a substantial loss of coverage of the BCR variable region. b In our approach, BCR transcripts are enriched from cDNA products using probe-based affinity capture with oligonucleotides targeting the constant regions of BCR isotypes. c This enrichment product is then modified by primer extension with hybrid UPS2/V-gene targeting primers and amplified with sequencing adapters to produce a size-defined sequencing library containing the full length of the BCR variable region as well as the single-cell cellular barcode and UMI. d During sequencing, one read is used to capture the cellular barcode and UMI, and two overlapping reads in opposite directions are used to capture the full length of the BCR variable region, which can be assembled in silico and matched to single-cell transcriptomes using the corresponding cellular barcode.
Fig. 2
Fig. 2. Recovery of full-length, paired BCR sequence from human peripheral blood mononuclear cells.
a UMAP of cell phenotypes present in human PBMC prepared using Seq-Well (n = 24,806 cells). b UMAP of BCR recovery from single cells prepared using Seq-Well. c Fraction of cells with no recovery, recovery of heavy chain, recovery of light chain, and paired recovery using Seq-Well (n = 8 samples). d UMAP of cell phenotypes present in human PBMC prepared using 10x Genomics 3‘ v3 (n = 50,877 cells). e UMAP of BCR recovery from single cells prepared using 10x Genomics 3‘ v3. f Fraction of cells with no recovery, recovery of heavy chain, recovery of light chain, and paired recovery using 10x Genomics 3‘ v3 (n = 8 samples). fi Correlation between the number of counts mapping to the IGH/IGK/IGL locus and the number of functional heavy chain or light chain molecules recovered from Seq-Well libraries. Spearman’s correlation coefficient and the associated p-value are shown. jl Correlation between the number of counts mapping to the IGH/IGK/IGL locus and the number of functional heavy chain or light chain molecules recovered from 10x Genomics libraries. Spearman’s correlation coefficient and the associated p value are shown. For (c, f), error bars are mean ± standard error of the mean.
Fig. 3
Fig. 3. Concordance between single-cell whole transcriptome and BCR libraries.
UMAP of isotypes of BCR heavy chain sequences recovered from single-cell libraries prepared by Seq-Well (a) and 10x Genomics 3‘ GEX (b), respectively. c, d Distribution of recovered BCR isotypes among B cells binned by the most common Ig constant region transcript present in WT. c is for Seq-Well-prepared samples, and (d) for 10x Genomics 3‘ GEX. All cells shown have at minimum 3 counts of transcript detected in the WTA product. sotypes of BCR heavy chain sequences recovered from single-cell libraries, grouped by phenotypes assigned in single-cell gene expression data from Seq-Well (e) and 10x Genomics 3‘ GEX (f), respectively. All genes shown have at least two transcripts recovered in both WTA and BCR libraries. g, h Heat map comparing most common heavy chain V gene segments in WT libraries and V-genes of recovered BCR sequences. Heavy chain somatic mutation frequency overlaid onto UMAP of cells prepared by Seq-Well (i) and 10x Genomics 3‘ GEX (j), respectively. k, l Somatic mutation frequency of heavy chain BCR sequences grouped by B cell phenotypes. m, n Somatic mutation frequency of light chain BCR sequences grouped by B cell phenotypes. k, m are for Seq-Well-prepared samples, and (n) for 10x Genomics 3‘ GEX. o, p Somatic mutation frequency of BCR sequences grouped by B cell isotypes. P values are calculated using a two-sided Wilcoxon rank-sum test and are adjusted using Bonferroni correction. ns p > 0.05, *p < = 0.05, **p <= 0.01, ***p <= 0.001, ****p <= 0.0001.
Fig. 4
Fig. 4. Accuracy and sensitivity of the approach.
a UMAP of transcriptional phenotypes present in B cell-enriched PBMC with spike-in of U6-transfected HEK cell line. b Dot plot showing scaled expression and the fraction of cells expressing B cell marker genes. c UMAP of BCR recovery. d Fraction of BCR recovered from each transcriptional phenotype. e Relationship of heavy and light chain sequences recovered from HEK cells to U6 BCR. f Cell phenotypes with recovery of U6 BCR. Correlation between IGHV (g) and IGKV/IGLV (h) frequency in recovered BCR from single cells and BCR from 5‘-RACE bulk sequencing. Pearson’s correlation coefficient and the associated p value are shown.
Fig. 5
Fig. 5. Comparison of BCR recovery to 5‘-barcoded single-cell platforms.
a Rates of recovery of heavy chain, light chain, and paired chain BCR from either 5‘- or 3‘-barcoded datasets. Each point represents a single experimental replicate. b Relationship of the average probability of BCR recovery and the number of heavy chain or light chain transcripts enumerated in whole transcriptome sequencing. Each jitter point represents a reaction lane of 10x Chromium or Seq-Well array. The error bars are mean ± standard error of the mean.
Fig. 6
Fig. 6. Transcriptional features of ST3-reactive and non-ST3-reactive B cells elicited by vaccination.
a Representative staining of ST3-reactive B cells from unvaccinated and vaccinated samples, gated on IgG+ B cells (Live CD3- CD19+ CD20+ IgG+). b Frequency of ST3-reactive IgG+ B cells in vaccinated and unvaccinated monkeys. The P value is calculated using a one-sided Wilcoxon rank-sum test. *p <= 0.05. Correlation between ST3-reactive IgG+ B cells and ST3-specific IgG (c) and OPA (d) titers. Spearman’s correlation and the associated p value are shown. UMAP of single-cell transcriptomes colored by sort fraction (e) and cell phenotype (f). g Dot plot showing scaled expression and percent of cells expressing B cell marker genes in each transcriptional phenotype. h Volcano plot of differentially expressed transcripts between B2Mhi and MBC-like cells. P values are calculated using a two-sided Wilcoxon rank-sum test and are adjusted using Bonferroni correction.
Fig. 7
Fig. 7. Clonotypic features of ST3-reactive B cells.
a UMAP colored by isotype of recovered BCR. b Isotypes recovered from B cell phenotypes. c UMAP colored by frequency of somatic mutation. d Frequency of somatic mutation in heavy chain sequences recovered from each phenotype. P-values are calculated with a two-sided Wilcoxon rank-sum test and are adjusted with Bonferroni correction. e Clonal sizes of ST3-reactive and ST3- B cells. Frequency of IGHV (f) and IGKV/IGLV (g) genes among ST3+ cells from vaccinated monkeys and all ST3- cells. Genes highlighted in red are statistically significantly enriched in the ST3+ fraction (p < 0.001, p values calculated using a two-sided chi-squared test and are adjusted using Bonferroni correction). h CDRH3 junction lengths of ST3-reactive cells using IGHV genes statistically associated with ST3-reactive cells. i IGKV/IGLV gene pairings lengths of ST3-reactive cells using IGHV genes statistically associated with ST3-reactive cells. j Logo plots of CDRH3 junctions of ST3-reactive clonotypes using IGHV4-173, IGHV4-80, and IGHV4-99. k Number of clonotypes with each V-gene recovered from each vaccinated and unvaccinated monkey.
Fig. 8
Fig. 8. Convergent BCR sequences exhibit specific binding to ST3.
a Plots of recombinant Rhesus-murine chimeric antibodies binding to ST3 as a function of concentration and IGHV gene. Each line represents an antibody selected from a single clone. b Heatmap of antibody binding to 93 different pneumococcal serotypes as a function of IGHV gene family and monkey. The values are shown for MFI measured with 2.3 µg/L of antibody by Luminex. The full list of serotypes evaluated is provided in the Supplementary Data 2.

References

    1. Jung, D. & Alt, F. W. Unraveling V(D)J recombination: insights into gene regulation. Cell116, 299–311 (2004). - PubMed
    1. De Silva, N. S. & Klein, U. Dynamics of B cells in germinal centres. Nat. Rev. Immunol.15, 137–148 (2015). - PMC - PubMed
    1. Mesin, L., Ersching, J. & Victora, G. D. Germinal center B cell dynamics. Immunity45, 471–482 (2016). - PMC - PubMed
    1. Lu, L. L., Suscovich, T. J., Fortune, S. M. & Alter, G. Beyond binding: antibody effector functions in infectious diseases. Nat. Rev. Immunol.18, 46–61 (2018). - PMC - PubMed
    1. Suan, D., Sundling, C. & Brink, R. Plasma cell and memory B cell differentiation from the germinal center. Curr. Opin. Immunol.45, 97–102 (2017). - PubMed

MeSH terms

Substances