. 2024 Sep 28;14(1):22521.
doi: 10.1038/s41598-024-73548-9.

Multidisciplinary assessment of seasonal ground displacements at the Hatfield Moors gas storage site in a peat bog landscape

Affiliations

Multidisciplinary assessment of seasonal ground displacements at the Hatfield Moors gas storage site in a peat bog landscape

Gabriele Fibbi et al. Sci Rep. .

Abstract

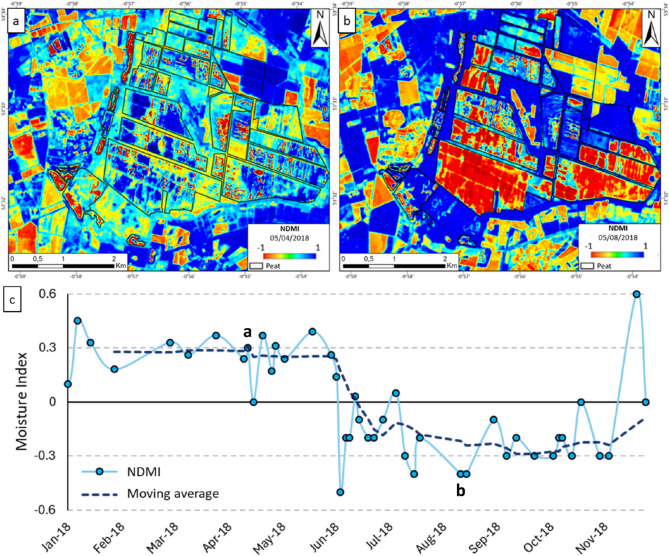
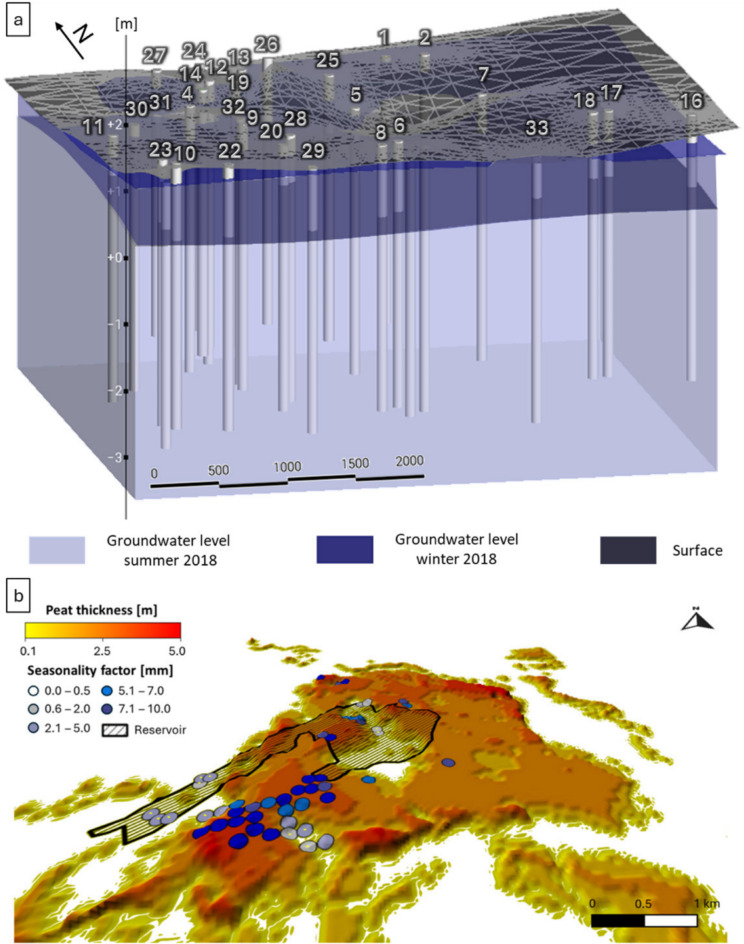
The study aims to analyse ground displacement conditions observed over an Underground Gas Storage (UGS) site located at Hatfield Moors (United Kingdom), with a focus on understanding its implications for decarbonization efforts. The location serves as an active onshore storage site and was used as an analogy to assess ground motion implications around Carbon Capture and Storage (CCS) by the British Geological Survey (BGS) as part of the SENSE (Assuring integrity of CO2 storage sites through ground surface monitoring) project. Given the value of continuous and real-time monitoring of ground movements induced by gas storage activities, the study leverages satellite Interferometric Synthetic Aperture Radar (InSAR) data to assess the environmental impact of UGS operations. Using free and open-source Sentinel-1 satellite data, ground motion patterns over Hatfield Moors are analysed, highlighting displacements ranging from - 5.0 to -10.0 mm/year within the peat bog. In addition, the Time Series (TS) of ground displacement from January 2018 to December 2022 reveals a seasonality in ground motion, with uplift observed in late winter and subsidence in late summer, showing a periodicity of approximately 1 year and a magnitude of +/-10.0 mm. Through in-depth analysis, the study highlights the need to understand the underlying causes of ground fluctuations at gas storage sites. This paper shows that InSAR has the versatility to integrate seamlessly with different monitoring tools and methodologies, opening avenues for comprehensive and holistic analyses. Cross-correlation analyses further elucidate temporal relationships between different datasets by evaluating InSAR time series, UGS injection/withdrawal data and piezometric data. This involves decomposing the TS into distinct components, including trend, seasonality and residuals. The case of Hatfield Moors shows a significant discrepancy between the UGS data and the InSAR TS, while also demonstrating a clear correlation between the groundwater data and the InSAR TS. By integrating insights from geology, hydrology and remote sensing technologies, the study navigates the complexities inherent in areas of overlapping phenomena. Accurate interpretation is essential for informed decision making, particularly at sites such as Hatfield Moors, where the convergence of natural peat motion and storage operations highlights the need for interdisciplinary analysis to understand the underlying causes of ground fluctuation.


Conflict of interest statement

The authors declare no competing interests.

Figures

Fig. 1
Fig. 1
Localization of the area of interest. Overview and location of the reservoirs, faults, piezometers, and injection wells beneath the Hatfield site. Sources of the background map: Esri, DigitalGlobe, GeoEye, i-cubed, USDA FSA, USGS, AEX, Getmapping, Aerogrid, IGN, IGP, swisstopo, and the GIS User Community. The map was generated using ESRI ArcGIS PRO 3.3.0 (https://www.esri.com/en-us/arcgis/products/arcgis-pro/overview).
Fig. 2
Fig. 2
Geological setting. Lithological map (a) and cross-section (b) (60x vertical exaggeration) showing the superficial deposits and shallow bedrock of Hatfield Moors. Lithological description of SE70NW/9 borehole (c). Contains British Geological Survey materials ©UKRI 2024. Contains OS data © Crown copyright and database rights 2024. OS AC0000824781 EUL. The map was generated using ESRI ArcGIS PRO 3.3.0 (https://www.esri.com/en-us/arcgis/products/arcgis-pro/overview).
Fig. 3
Fig. 3
Schematic workflow for identifying and understanding the factors contributing to the seasonal ground displacement observed at Hatfield Moors.
Fig. 4
Fig. 4
InSAR-observed ground displacement in Hatfield Moors. Ascending (a) and descending (b) average velocity maps of ground displacement in the Hatfield Moors area and location of ground equipment. Sources of the background map: Esri, DigitalGlobe, GeoEye, i-cubed, USDA FSA, USGS, AEX, Getmapping, Aerogrid, IGN, IGP, swisstopo, and the GIS User Community. The map was generated using ESRI ArcGIS PRO 3.3.0 (https://www.esri.com/en-us/arcgis/products/arcgis-pro/overview).
Fig. 5
Fig. 5
Vertical and horizontal component of ground displacement in Hatfield Moors. Vertical (a) and horizontal (b) average velocity maps of ground displacement in the Hatfield Moors area and location of ground equipment. Negative values for horizontal movement indicate movement to the west, while positive values indicate movement to the east. The average TS of estimated ground displacement in vertical (c) and horizontal (d) components for the selected MPs inside the peat, which are enclosed within the two white circles shown in (a) and (b). The average TS of estimated ground displacement in vertical (e) and horizontal (f) components for the selected MPs outside the peat, which are enclosed within the two green circles shown in (a) and (b). The red line represents the regression curve. The map was generated using ESRI ArcGIS PRO 3.3.0 (https://www.esri.com/en-us/arcgis/products/arcgis-pro/overview).
Fig. 6
Fig. 6
Temporal cross-correlation analysis between InSAR data and smoothed UGS data. Cross-correlation analysis between the TS of ground surface displacement derived from InSAR data (in blue) and the cumulative injection and extraction curve (in red). The cross-correlation result is highlighted in black.
Fig. 7
Fig. 7
Temporal correlation between seasonal variations in groundwater levels (a) and InSAR TS (b). Peaks in rainfall data and groundwater levels correspond to winter seasons, while troughs correspond to summer periods, showing a clear correlation with the observed satellite data trends.
Fig. 8
Fig. 8
Temporal cross-correlation analysis between InSAR TS and groundwater level in the peat bog. Cross-correlation analysis between the TS of the ground surface displacement derived from InSAR data (in blue) and the TS of the groundwater level in the peat bog (in red). The cross-correlation result is highlighted in black.
Fig. 9
Fig. 9
Normalised difference moisture index analysis. NDMI analysis of two Sentinel-2 images acquired on 5 April 2018 (a) and 5 August 2018 (b). TS of the NDMI for the year 2018 using only images with a cloud coverage < 25% (c). The images from panels a and b are marked in the TS. The TS of the NDMI represents the average for the peat bog area. Contains modified Copernicus Sentinel data. The map was generated using ESRI ArcGIS PRO 3.3.0 (https://www.esri.com/en-us/arcgis/products/arcgis-pro/overview).
Fig. 10
Fig. 10
3D groundwater model and spatial correlation between seasonal ground displacement and peat thickness. The 2018 groundwater model incorporating piezometric data from wells close to the Hatfield Moors peat bog (a). The model was generated using Seequent Leapfrog Geo 2021.2.5 (https://www.seequent.com/products-solutions/leapfrog-geo/). The seasonality factor of MPs within the Hatfield Moors reservoir as a function of peat thickness (b). The map was generated using Golden Software Surfer 27.2.282 (https://www.goldensoftware.com/products/surfer/).
Fig. 11
Fig. 11
Seasonal trend chart. InSAR trend at the top, groundwater trend in middle and injection/withdrawal trend at the bottom. The chart highlights months with peak and trough values, facilitating the visualization of correlations between different datasets.

References

    1. Wang, Z. et al. Flux and influencing factors of CO2 outgassing in a karst spring-fed creek: Implications for carbonate weathering-related carbon sink assessment. J. Hydrol.596, 125710. 10.1016/j.jhydrol.2020.125710 (2021).
    1. Yang, D., Zhang, H. & Li, J. Changes in concentrations of fine and coarse particles under the CO2 induced global warming. Atmos. Res.230, 104637. 10.1016/j.atmosres.2019.104637 (2019).
    1. Rhodes, C.J. The 2015 Paris climate change conference: COP21. Sci. Prog.99, 97–104. 10.3184/003685016X14528569315192 (2016). - PMC - PubMed
    1. European Environmental Agency. European Union Emission Inventory Report 1990–201 under the UNECE Convention on Long-Range Transboundary Air Pollution (LRTAP). European Environmental Agency (EEA) Technical Report No 9; European Environmental Agency: Copenhagen, Denmark (2019).
    1. International Energy Agency (IEA). Global CO2 emissions rebounded to their highest level in History in 2021 (2022). CO Global (2022).

LinkOut - more resources