. 2024 Sep 28;21(1):56.
doi: 10.1186/s12014-024-09507-3.

Biomarker discovery in progressive supranuclear palsy from human cerebrospinal fluid

Affiliations

Biomarker discovery in progressive supranuclear palsy from human cerebrospinal fluid

Yura Jang et al. Clin Proteomics. .

Abstract

Background: Progressive supranuclear palsy (PSP) is a neurodegenerative disorder often misdiagnosed as Parkinson's Disease (PD) due to shared symptoms. PSP is characterized by the accumulation of tau protein in specific brain regions, leading to loss of balance, gaze impairment, and dementia. Diagnosing PSP is challenging, and there is a significant demand for reliable biomarkers. Existing biomarkers, including tau protein and neurofilament light chain (NfL) levels in cerebrospinal fluid (CSF), show inconsistencies in distinguishing PSP from other neurodegenerative disorders. Therefore, the development of new biomarkers for PSP is imperative.

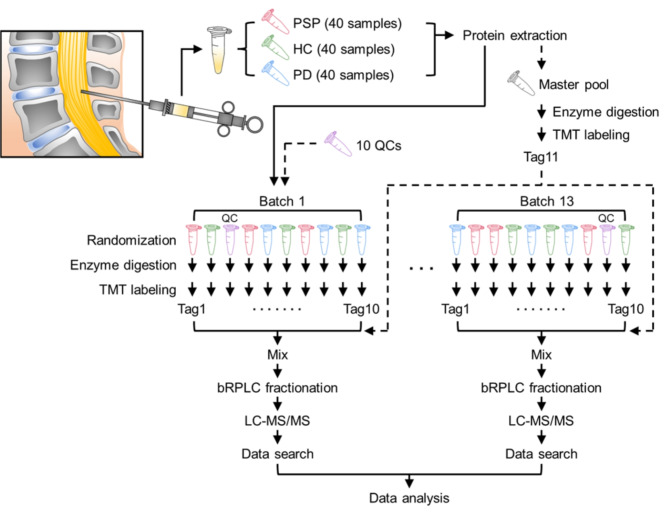
Methods: We conducted an extensive proteome analysis of CSF samples from 40 PSP patients, 40 PD patients, and 40 healthy controls (HC) using tandem mass tag-based quantification. Mass spectrometry analysis of 120 CSF samples was performed across 13 batches of 11-plex TMT experiments, with data normalization to reduce batch effects. Pathway, interactome, cell-type-specific enrichment, and bootstrap receiver operating characteristic analyses were performed to identify key candidate biomarkers.

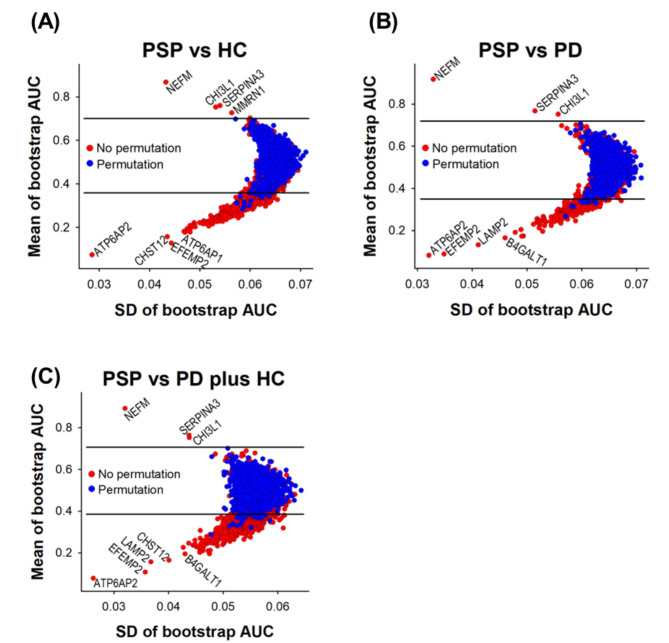
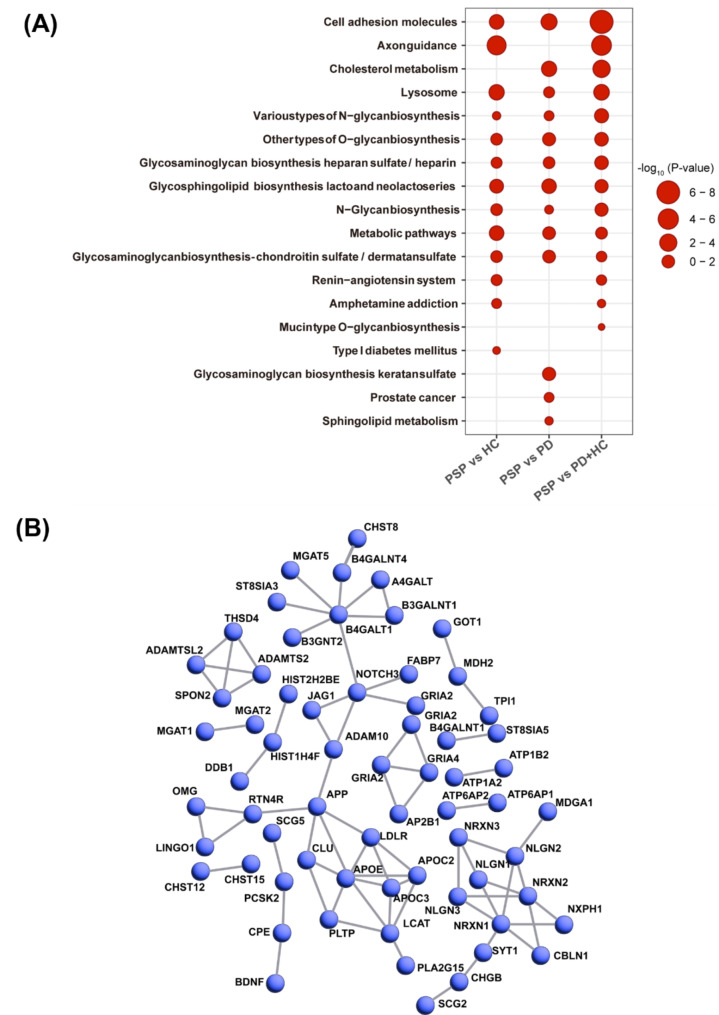
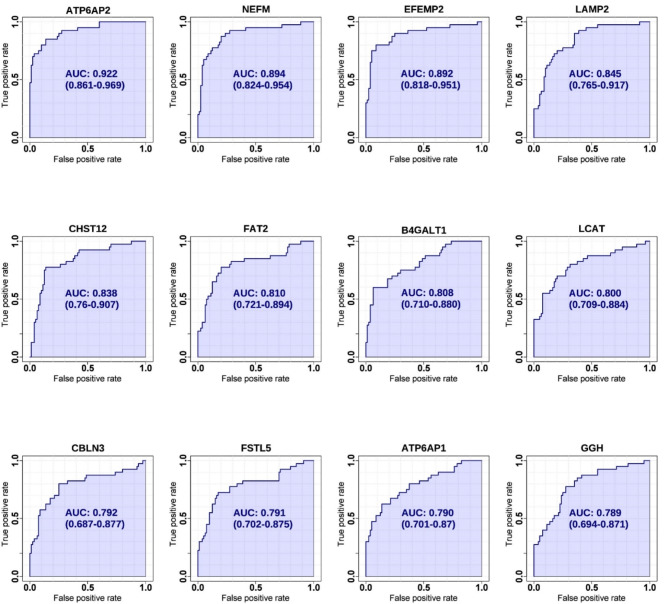
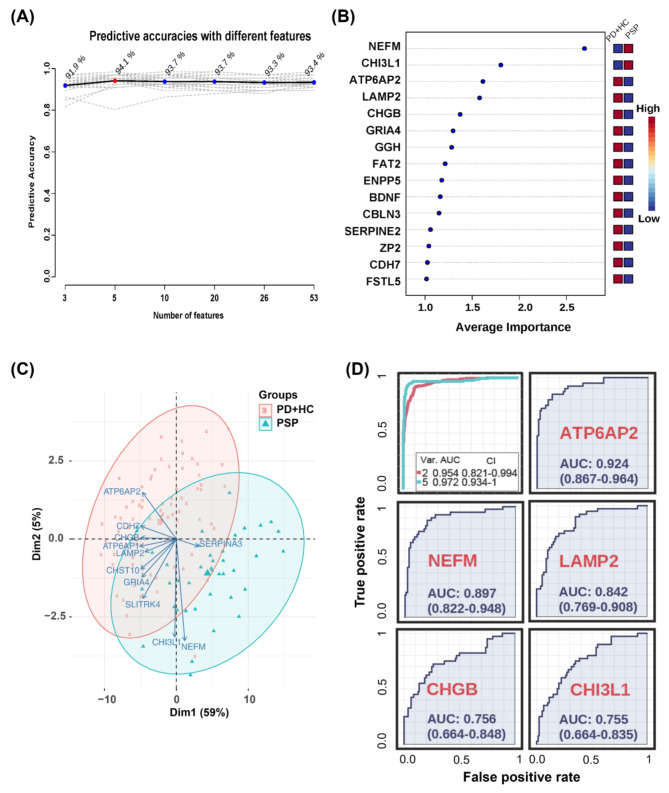
Results: We identified a total of 3,653 unique proteins. Our analysis revealed 190, 152, and 247 differentially expressed proteins in comparisons of PSP vs. HC, PSP vs. PD, and PSP vs. both PD and HC, respectively. Gene set enrichment and interactome analysis of the differentially expressed proteins in PSP CSF showed their involvement in cell adhesion, cholesterol metabolism, and glycan biosynthesis. Cell-type enrichment analysis indicated a predominance of neuronally-derived proteins among the differentially expressed proteins. The potential biomarker classification performance demonstrated that ATP6AP2 (reduced in PSP) had the highest AUC (0.922), followed by NEFM, EFEMP2, LAMP2, CHST12, FAT2, B4GALT1, LCAT, CBLN3, FSTL5, ATP6AP1, and GGH.

Conclusion: Biomarker candidate proteins ATP6AP2, NEFM, and CHI3L1 were identified as key differentiators of PSP from the other groups. This study represents the first large-scale use of mass spectrometry-based proteome analysis to identify cerebrospinal fluid (CSF) biomarkers specific to progressive supranuclear palsy (PSP) that can differentiate it from Parkinson's disease (PD) and healthy controls. Our findings lay a crucial foundation for the development and validation of reliable biomarkers, which will enhance diagnostic accuracy and facilitate early detection of PSP.

Keywords: Biomarkers; Cerebrospinal fluid; Mass spectrometry; Progressive supranuclear palsy; Proteomics.


Conflict of interest statement

The authors declare no competing interests.

Figures

Fig. 1
Fig. 1
Experimental strategy for the proteomic study of the CSF samples from PSP patients, PD patients, and HC individuals. Thirteen batches of 11-plex TMT experiments were conducted to analyze the proteome of human CSF samples from 40 PSP patients, 40 PD patients, and 40 HC individuals. Master pool (MP) and QC samples were prepared by combining an equal amount of protein from all 120 CSF samples. MP was added to each batch after labeling with Tag 11 in one tube. QC was split into 10 aliquots and processed in 10 of 13 batches separately. TMT tags for individual samples and QC were determined by randomization. The proteins were digested with Lys-C and trypsin, followed by TMT labeling and prefractionation into 24 fractions prior to mass spectrometry analysis. Proteins were identified by conducting a database search of the acquired mass spectra
Fig. 2
Fig. 2
Bootstrap ROC plots of the CSF proteins identified from PSP patients, PD patients, and HC individuals. Bootstrap ROC analyses were conducted to estimate variations of resampling. To calculate q-values, bootstrap ROC analyses after permutation of the comparison groups were conducted too. The differentially expressed proteins with a q-value < 0.01 are shown at the outside of the upper and lower horizontal lines. The proteins on the upper and lower side of the q-value line are up- and down-regulated in PSP compared to HC (A), in PSP compared to PD (B) and in PD compared to PD plus HC (C), respectively
Fig. 3
Fig. 3
Interactome analysis of differentially expressed proteins. Bubble plot illustrating the –log10 (P values) derived from KEGG pathway analysis conducted on the pool of differentially expressed proteins. The vertical axis delineates the pathway names, while the horizontal axis represents the comparative analysis (A). STRING PPI analysis was conducted to estimate the connectivity of the differentially expressed proteins with a q-value < 0.01 in PSP compared to the group of HC plus PD. All active interaction sources, including text mining, experiments, databases, co-expression, neighborhood, gene fusion, and co-occurrence, were used with a 0.9 of the highest confidence threshold as a minimum required interaction score. Network edges were set to confidence, which indicates data strength based on thickness. The network contains 241 nodes with 76 edges. (average node degree: 0.63, average local clustering coefficient: 0.178, and PPI enrichment P-value < 1 × 10− 16). We selected to hide disconnected nodes in the network (B)
Fig. 4
Fig. 4
ROC analysis of 12 representative proteins with the highest AUCs between PSP vs. PD plus HC. The discriminating capabilities of candidate PSP biomarkers were estimated by comparing PSP to PD plus HC using ROC analysis. ROC curves were generated by bootstrapping. The values in the parenthesis show the lower and upper AUC values of 95% confidence interval. The values in the parenthesis show the lower and upper AUC values of a 95% confidence interval. The X-axis denotes a false positive rate (1-specificity), and the Y-axis denotes a true positive rate (sensitivity)
Fig. 5
Fig. 5
Multivariate ROC analysis and predictive accuracy. The differentially expressed proteins of PSP-specific biomarker candidates were compared with HC plus PD. (A) The accuracy for predicting PSP as the number of features increased is shown. (B) The top 15 significant features affecting the discrimination of PSP from PD plus HC are shown with their average importance values, which are equivalent to the mean of Variable Importance in Projection (VIP) scores. (C) PCA-biplot analysis for the top 53 differential proteins between PSP vs. PD plus HC was conducted. The representative upregulated and downregulated proteins among 53 proteins are shown on the PCA-biplot. (D) Multivariate ROC analyses were conducted using 2 and 5 features. Var. indicates the number of features used. CI indicates confidence interval. Individual ROCs for 5 proteins used for the multivariate ROC are shown too.

Similar articles

Cited by

References

    1. Boxer AL, Yu JT, Golbe LI, Litvan I, Lang AE, Hoglinger GU. Advances in progressive supranuclear palsy: new diagnostic criteria, biomarkers, and therapeutic approaches. Lancet Neurol. 2017;16(7):552–63. - PMC - PubMed
    1. Wagshal D, Sankaranarayanan S, Guss V, Hall T, Berisha F, Lobach I, et al. Divergent CSF tau alterations in two common tauopathies: Alzheimer’s disease and progressive supranuclear palsy. J Neurol Neurosurg Psychiatry. 2015;86(3):244–50. - PMC - PubMed
    1. Scherling CS, Hall T, Berisha F, Klepac K, Karydas A, Coppola G, et al. Cerebrospinal fluid neurofilament concentration reflects disease severity in frontotemporal degeneration. Ann Neurol. 2014;75(1):116–26. - PMC - PubMed
    1. Magdalinou NK, Paterson RW, Schott JM, Fox NC, Mummery C, Blennow K, et al. A panel of nine cerebrospinal fluid biomarkers may identify patients with atypical parkinsonian syndromes. J Neurol Neurosurg Psychiatry. 2015;86(11):1240–7. - PMC - PubMed
    1. Rojas JC, Karydas A, Bang J, Tsai RM, Blennow K, Liman V, et al. Plasma neurofilament light chain predicts progression in progressive supranuclear palsy. Ann Clin Transl Neurol. 2016;3(3):216–25. - PMC - PubMed

LinkOut - more resources