. 2024 Sep 28;25(1):894.
doi: 10.1186/s12864-024-10818-w.

Complete mitochondrial genome assembly of Juglans regia unveiled its molecular characteristics, genome evolution, and phylogenetic implications

Affiliations

Complete mitochondrial genome assembly of Juglans regia unveiled its molecular characteristics, genome evolution, and phylogenetic implications

Hang Ye et al. BMC Genomics. .

Abstract

Background: The Persian walnut (Juglans regia), an economically vital species within the Juglandaceae family, has seen its mitochondrial genome sequenced and assembled in the current study using advanced Illumina and Nanopore sequencing technology.

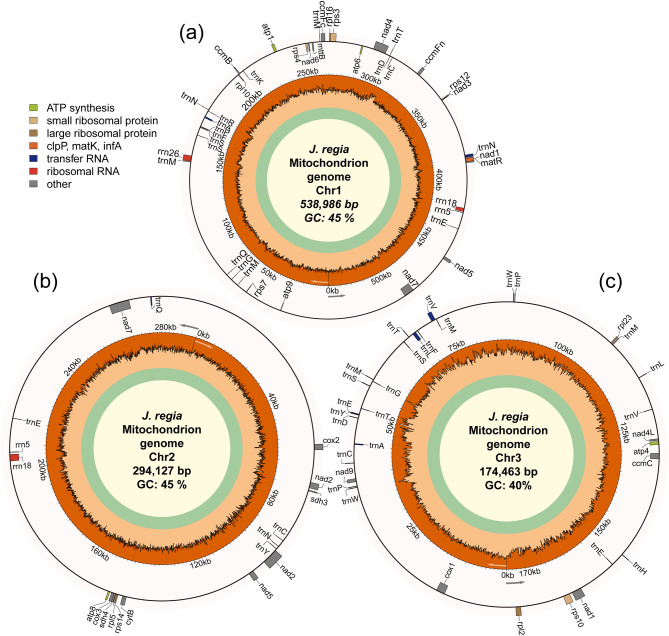
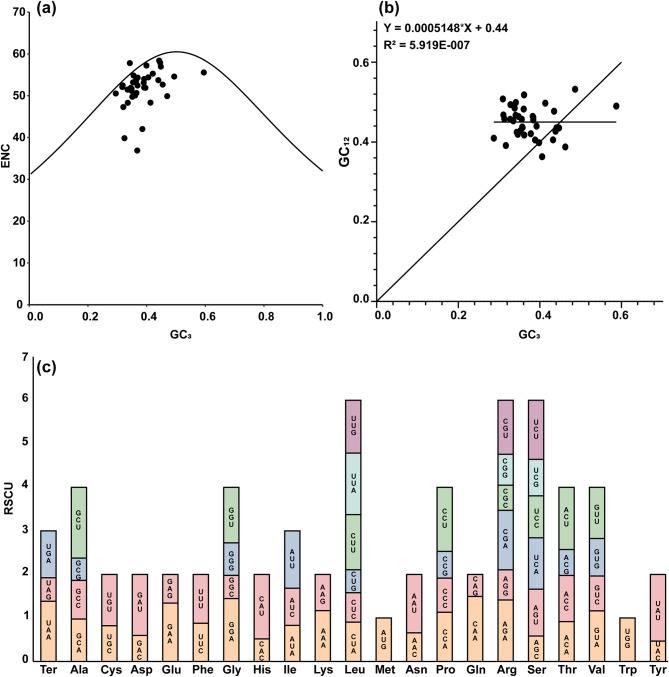
Results: The 1,007,576 bp mitogenome of J. regia consisted of three circular chromosomes with a 44.52% GC content encoding 39 PCGs, 47 tRNA, and five rRNA genes. Extensive repetitive sequences, including 320 SSRs, 512 interspersed, and 83 tandem repeats, were identified, contributing to genomic complexity. The protein-coding sequences (PCGs) favored A/T-ending codons, and the codon usage bias was primarily shaped by selective pressure. Intracellular gene transfer occurred among the mitogenome, chloroplast, and nuclear genomes. Comparative genomic analysis unveiled abundant structure and sequence variation among J. regia and related species. The results of selective pressure analysis indicated that most PCGs underwent purifying selection, whereas the atp4 and ccmB genes had experienced positive selection between many species pairs. In addition, the phylogenetic examination, grounded in mitochondrial genome data, precisely delineated the evolutionary and taxonomic relationships of J. regia and its relatives. We identified a total of 539 RNA editing sites, among which 288 were corroborated by transcriptome sequencing data. Furthermore, expression profiling under temperature stress highlighted the complex regulation pattern of 28 differently expressed PCGs, wherein NADH dehydrogenase and ATP synthase genes might be critical in the mitochondria response to cold stress.

Conclusions: Our results provided valuable molecular resources for understanding the genetic characteristics of J. regia and offered novel perspectives for population genetics and evolutionary studies in Juglans and related woody species.

Keywords: Juglans regia; Comparative analysis; Mitochondrial genome; Temperature stress.


Conflict of interest statement

The authors declare no competing interests.

The authors declare that they have no competing interests.

Figures

Fig. 1
Fig. 1
Circular map of the J. regia mitogenome, consists of chromosome 1 (a), chromosome 2 (b) and chromosome 3 (c). Genes belonging to different functional groups are color-coded. Genes those shown on the outside and inside of the circle are transcribed clockwise and counterclockwise, respectively. The dark orange region in the inner circle represents the GC content
Fig. 2
Fig. 2
Analysis of repeat fragments from the J. regia mitogenome. (a), (b), and (c): The number of simple sequence repeats (SSRs) in three chromosomes of J. regia mitogenome. The “Mono”, “Di”, “Tri”, “Tetra”, “Penta”, and “Hexa” correspond to monomeric, dimeric, trimeric, tetrameric, pentameric and hexameric SSRs, respectively. (d), (e) and (f): The number of long repeats in three chromosomes of J. regia mitogenome. The count of long repeats is indicated by TR (tandem repeats), FR (forward repeats), RR (reverse repeats), PR (palindromic repeats), and CR (complementary repeats), respectively
Fig. 3
Fig. 3
The landscape of codon usage bias in the J. regia mitogenome. (a) The ENC plot of protein coding genes in the J. regia mitogenome. (b) The analysis of neutrality plot of protein coding genes in the J. regia mitogenome. (c) Relative synonymous codon usage (RSCU) in the J. regia mitogenome
Fig. 4
Fig. 4
The newly assembled complete chloroplast genome (a) and DNA transfer analysis (b) of J. regia. The orange, pink and green lines between the arcs correspond to the homologous genomic fragments between mitochondrial chromosome 1, 2, and 3 and the chloroplast genome, respectively
Fig. 5
Fig. 5
Phylogenetic analysis (a) and collinearity analysis (b) between J. regia and related species. The order of the species from top to bottom in the collinearity is consist with the phylogenetic tree. The pink line represents collinear block while the orange line indicated the inversion region
Fig. 6
Fig. 6
Selective pressure of shared protein coding genes in J. regia and related species. (a) The x-axis represents the Ks (synonymous substitutions) value, while the y-axis represents the Ka (non-synonymous substitutions) value. Pink dots represent gene pairs under positive selection (Ka/Ks > 1), and orange dots represents gene pairs under purifying selection (Ka/Ks < 1). (b) Overall distribution pattern of the Ka/Ks value of each shared gene
Fig. 7
Fig. 7
The RNA editing distribution pattern in protein coding genes of J. regia. (a) The number of predicted RNA editing sites in each protein coding genes. (b) The editing frequency distribution obtained from transcriptome data. (c) The venn plot showed a total of 539 RNA editing sites were predicted, with 288 supported by transcriptome validation. (d) An example for changes of local sequence of nucleotide (1351 bp to 1377 bp) and amino acid (451 aa to 459 aa) in nad4. (e) An example for changes of local sequence of nucleotide (562 bp to 576 bp) and amino acid (188 aa to 192 aa) in ccmB
Fig. 8
Fig. 8
The expression profile of protein coding genes of J. regia. (a) Expression patterns of mitochondrial protein coding genes in different tissues. Expression patterns of mitochondrial protein coding genes under abiotic stress treatment include (b) 5 ℃, 8 ℃, and 22 ℃ treatment for cultivar ‘DGM’, ‘HR’, ‘ZJ’, ‘LL’ and ‘LY’. (c) 4 ℃ treatment to leaf tissues for 0 h, 3 h, 6 h, 12 h and 24 h. (d) The number of differently expressed genes in treatment (b) and (c). (e) The UpSet plot of differently expressed genes in different compassion
Fig. 9
Fig. 9
Construction of the maximum likelihood tree based on the 38 species

Similar articles

References

    1. Song YG, Fragnière Y, Meng HH, Li Y, Bétrisey S, Corrales A, Manchester S, Deng M, Jasińska AK, Văn Sâm H, et al. Global biogeographic synthesis and priority conservation regions of the relict tree family Juglandaceae. J Biogeogr. 2020;47(3):643–57.
    1. Shiono T, Kusumoto B, Yasuhara M, Kubota Y. Roles of climate niche conservatism and range dynamics in woody plant diversity patterns through the Cenozoic. Glob Ecol Biogeogr. 2018;27(7):865–74.
    1. Bai WN, Yan PC, Zhang BW, Woeste KE, Lin K, Zhang DY. Demographically idiosyncratic responses to climate change and rapid pleistocene diversification of the walnut genus Juglans (Juglandaceae) revealed by whole-genome sequences. New Phytol. 2018;217(4):1726–36. - PubMed
    1. Bai WN, Wang WT, Zhang DY. Phylogeographic breaks within Asian butternuts indicate the existence of a phytogeographic divide in East Asia. New Phytol. 2016;209(4):1757–72. - PubMed
    1. Bai WN, Wang WT, Zhang DY. Contrasts between the phylogeographic patterns of chloroplast and nuclear DNA highlight a role for pollen-mediated gene flow in preventing population divergence in an east Asian temperate tree. Mol Phylogenet Evol. 2014;81:37–48. - PubMed

LinkOut - more resources