

Do small effects matter more in vulnerable populations? an investigation using Environmental influences on Child Health Outcomes (ECHO) cohorts
- PMID: 39342237
- PMCID: PMC11438038
- DOI: 10.1186/s12889-024-20075-x
Do small effects matter more in vulnerable populations? an investigation using Environmental influences on Child Health Outcomes (ECHO) cohorts
Abstract
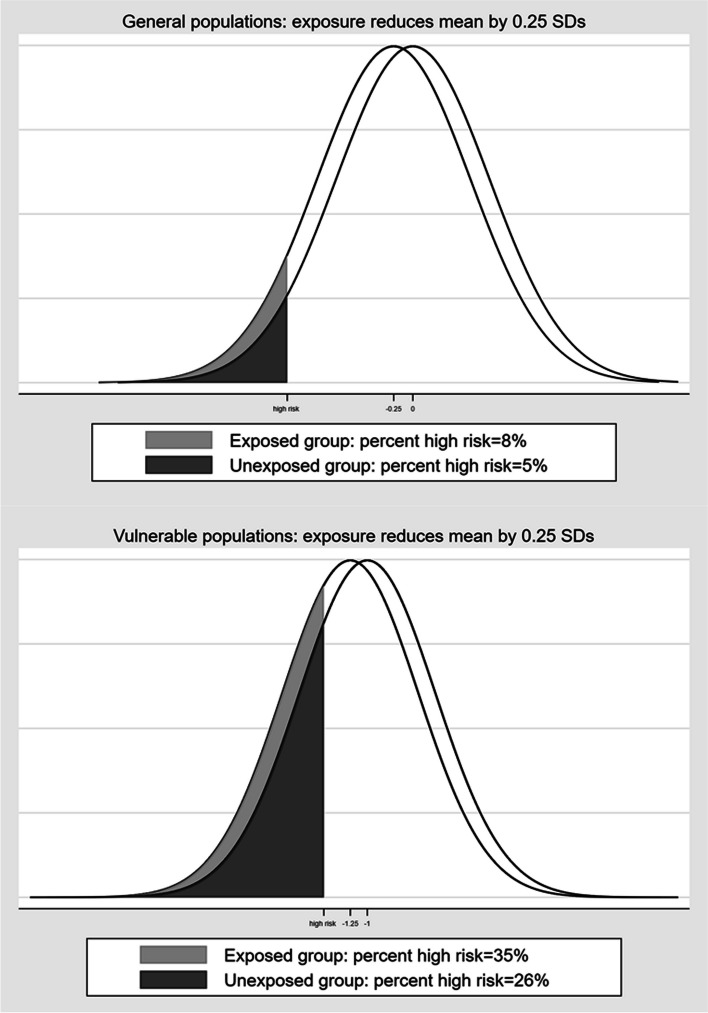
Background: A major challenge in epidemiology is knowing when an exposure effect is large enough to be clinically important, in particular how to interpret a difference in mean outcome in unexposed/exposed groups. Where it can be calculated, the proportion/percentage beyond a suitable cut-point is useful in defining individuals at high risk to give a more meaningful outcome. In this simulation study we compute differences in outcome means and proportions that arise from hypothetical small effects in vulnerable sub-populations.
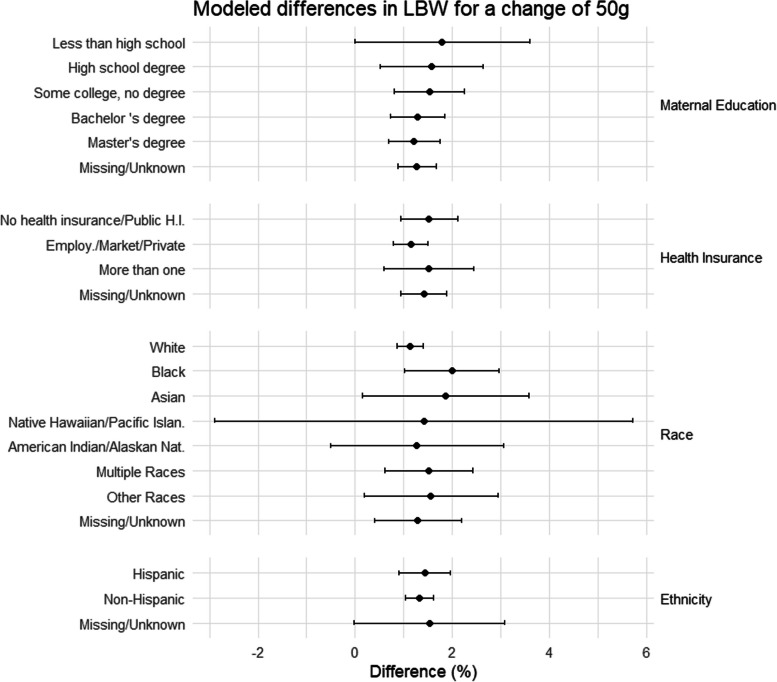
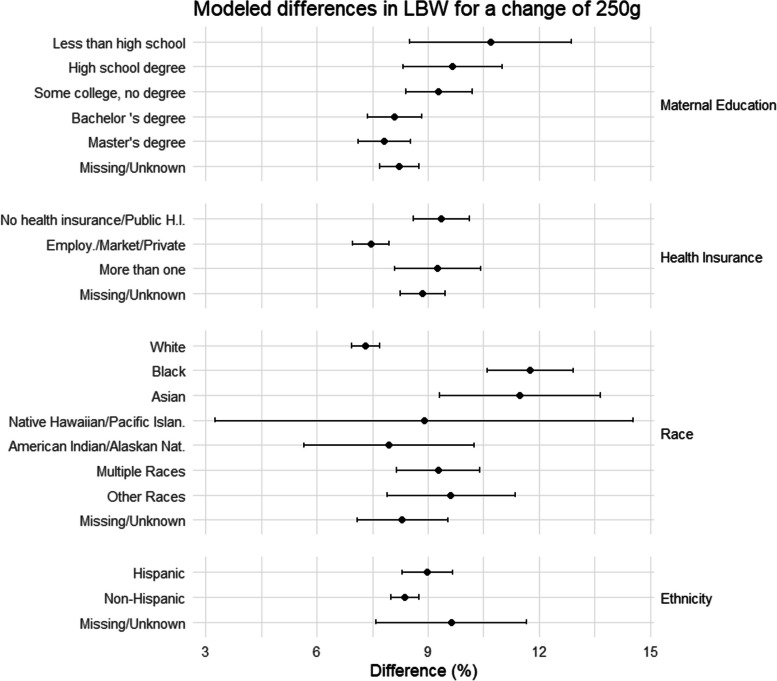
Methods: Data from over 28,000 mother/child pairs belonging to the Environmental influences on Child Health Outcomes Program were used to examine the impact of hypothetical environmental exposures on mean birthweight, and low birthweight (LBW) (birthweight < 2500g). We computed mean birthweight in unexposed/exposed groups by sociodemographic categories (maternal education, health insurance, race, ethnicity) using a range of hypothetical exposure effect sizes. We compared the difference in mean birthweight and the percentage LBW, calculated using a distributional approach.
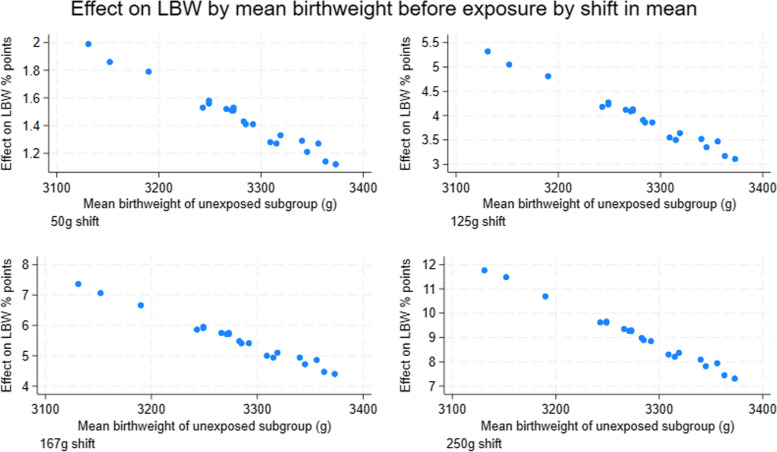
Results: When the hypothetical mean exposure effect was fixed (at 50, 125, 167 or 250g), the absolute difference in % LBW (risk difference) was not constant but varied by socioeconomic categories. The risk differences were greater in sub-populations with the highest baseline percentages LBW: ranging from 3.1-5.3 percentage points for exposure effect of 125g. Similar patterns were seen for other mean exposure sizes simulated.
Conclusions: Vulnerable sub-populations with greater baseline percentages at high risk fare worse when exposed to a small insult compared to the general population. This illustrates another facet of health disparity in vulnerable individuals.
Keywords: Child health outcome; Environmental exposure; Health disparities; Pregnancy outcomes; Social determinants of health.
© 2024. The Author(s).
Conflict of interest statement
The authors declare no competing interests.
Figures


References
-
- Cohen J. Statistical power analysis for the behavioral sciences. 2nd ed. Hillsdale, N.J.: L. Erlbaum Associates; 1988.
-
- Organisation WH. Low birth weight. https://www.who.int/data/nutrition/nlis/info/low-birth-weight. Accessed 21 Sept 2024.
-
- Peacock JL, Sauzet O, Ewings SM, Kerry SM. Dichotomising continuous data while retaining statistical power using a distributional approach. Stat Med. 2012;31(26):3089–103. 10.1002/sim.5354. - PubMed
Publication types
MeSH terms
Grants and funding
- UH3 OD023248/OD/NIH HHS/United States
- UH3 OD023275/OD/NIH HHS/United States
- UH3 OD023249/OD/NIH HHS/United States
- UH3 OD023305/OD/NIH HHS/United States
- UH3 OD023271/OD/NIH HHS/United States
- UG3 OD023271/OD/NIH HHS/United States
- UH3 OD023272/OD/NIH HHS/United States
- UH3 OD023332/OD/NIH HHS/United States
- UH3 OD023318/OD/NIH HHS/United States
- UH3 OD023279/OD/NIH HHS/United States
- U2C OD023375/OD/NIH HHS/United States
- UH3 OD023244/OD/NIH HHS/United States
- UH3 OD023253/OD/NIH HHS/United States
- UH3 OD023349/OD/NIH HHS/United States
- UH3 OD023285/OD/NIH HHS/United States
- UH3 OD023287/OD/NIH HHS/United States
- UH3 OD023365/OD/NIH HHS/United States
- UH3 OD023288/OD/NIH HHS/United States
- UH3 OD023337/OD/NIH HHS/United States
- U24 OD023382/OD/NIH HHS/United States
- UG3 OD035528/OD/NIH HHS/United States
- UH3 OD023389/OD/NIH HHS/United States
- UH3 OD023286/OD/NIH HHS/United States
- P30 ES001247/ES/NIEHS NIH HHS/United States
- UH3 OD023290/OD/NIH HHS/United States
- UH3 OD023342/OD/NIH HHS/United States
- UH3 OD023251/OD/NIH HHS/United States
- UH3 OD023282/OD/NIH HHS/United States
- UH3 OD023328/OD/NIH HHS/United States
- UH3 OD023289/OD/NIH HHS/United States
- UH3 OD023268/OD/NIH HHS/United States
- U24 OD023319/OD/NIH HHS/United States
- UH3 OD023313/OD/NIH HHS/United States
