

Construction of machine learning diagnostic models for cardiovascular pan-disease based on blood routine and biochemical detection data
- PMID: 39342281
- PMCID: PMC11439295
- DOI: 10.1186/s12933-024-02439-0
Construction of machine learning diagnostic models for cardiovascular pan-disease based on blood routine and biochemical detection data
Abstract
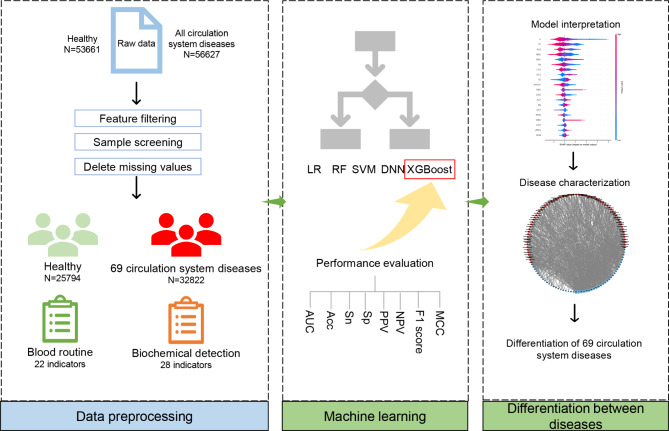
Background: Cardiovascular disease, also known as circulation system disease, remains the leading cause of morbidity and mortality worldwide. Traditional methods for diagnosing cardiovascular disease are often expensive and time-consuming. So the purpose of this study is to construct machine learning models for the diagnosis of cardiovascular diseases using easily accessible blood routine and biochemical detection data and explore the unique hematologic features of cardiovascular diseases, including some metabolic indicators.
Methods: After the data preprocessing, 25,794 healthy people and 32,822 circulation system disease patients with the blood routine and biochemical detection data were utilized for our study. We selected logistic regression, random forest, support vector machine, eXtreme Gradient Boosting (XGBoost), and deep neural network to construct models. Finally, the SHAP algorithm was used to interpret models.
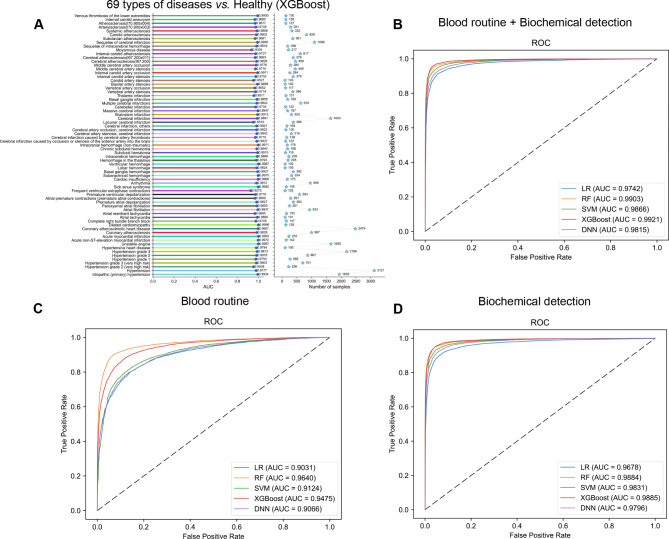
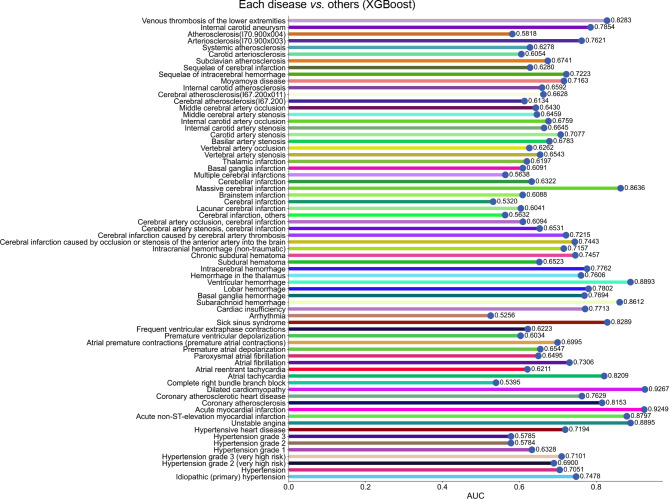
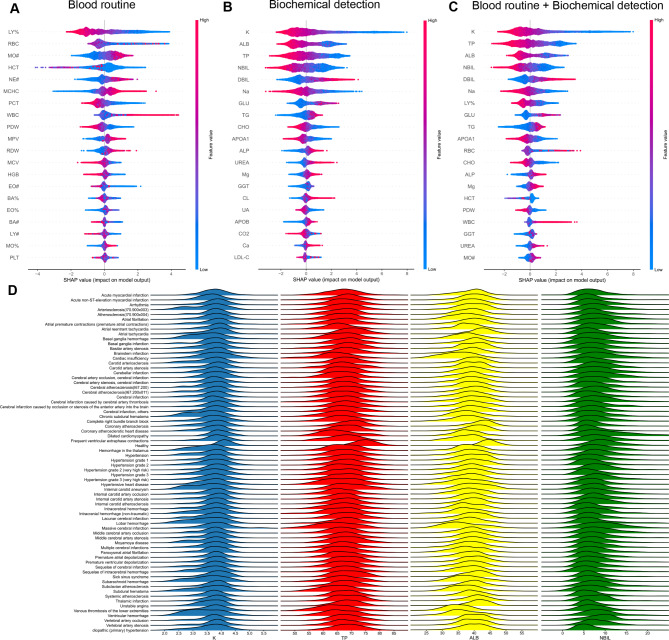
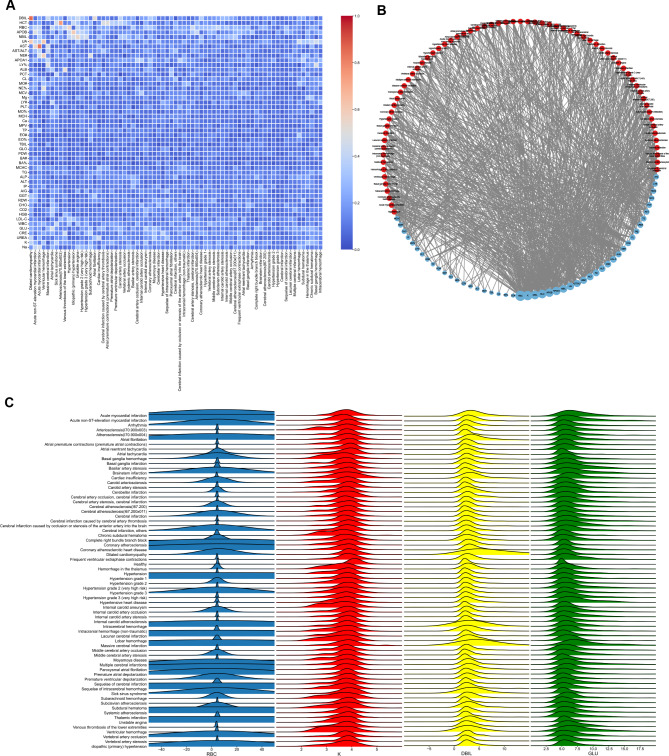
Results: The circulation system disease prediction model constructed by XGBoost possessed the best performance (AUC: 0.9921 (0.9911-0.9930); Acc: 0.9618 (0.9588-0.9645); Sn: 0.9690 (0.9655-0.9723); Sp: 0.9526 (0.9477-0.9572); PPV: 0.9631 (0.9592-0.9668); NPV: 0.9600 (0.9556-0.9644); MCC: 0.9224 (0.9165-0.9279); F1 score: 0.9661 (0.9634-0.9686)). Most models of distinguishing various circulation system diseases also had good performance, the model performance of distinguishing dilated cardiomyopathy from other circulation system diseases was the best (AUC: 0.9267 (0.8663-0.9752)). The model interpretation by the SHAP algorithm indicated features from biochemical detection made major contributions to predicting circulation system disease, such as potassium (K), total protein (TP), albumin (ALB), and indirect bilirubin (NBIL). But for models of distinguishing various circulation system diseases, we found that red blood cell count (RBC), K, direct bilirubin (DBIL), and glucose (GLU) were the top 4 features subdividing various circulation system diseases.
Conclusions: The present study constructed multiple models using 50 features from the blood routine and biochemical detection data for the diagnosis of various circulation system diseases. At the same time, the unique hematologic features of various circulation system diseases, including some metabolic-related indicators, were also explored. This cost-effective work will benefit more people and help diagnose and prevent circulation system diseases.
Keywords: Biochemical detection; Blood routine; Cardiovascular disease; Circulation system disease; Machine learning; Metabolic indicator.
© 2024. The Author(s).
Conflict of interest statement
The authors declare no competing interests.
Figures
References
-
- Cheng X, Manandhar I, Aryal S, et al. Application of artificial intelligence in cardiovascular medicine. Compr Physiol. 2021;11(4):2455–66. - PubMed
-
- Lindstrom M, DeCleene N, Dorsey H, et al. Global burden of cardiovascular diseases and risks collaboration, 1990–2021. J Am Coll Cardiol. 2022;80(25):2372–425. - PubMed
-
- The W. Report on cardiovascular health and diseases in China 2022: an updated summary. Biomed Environ Sci. 2023;36(8):669–701. - PubMed
Publication types
MeSH terms
Substances
Grants and funding
LinkOut - more resources
Full Text Sources
Miscellaneous
