. 2024 Sep 28;24(1):325.
doi: 10.1186/s12935-024-03512-0.

M1 macrophage-derived exosomal microRNA-29c-3p suppresses aggressiveness of melanoma cells via ENPP2

Affiliations

M1 macrophage-derived exosomal microRNA-29c-3p suppresses aggressiveness of melanoma cells via ENPP2

Byoungha An et al. Cancer Cell Int. .

Abstract

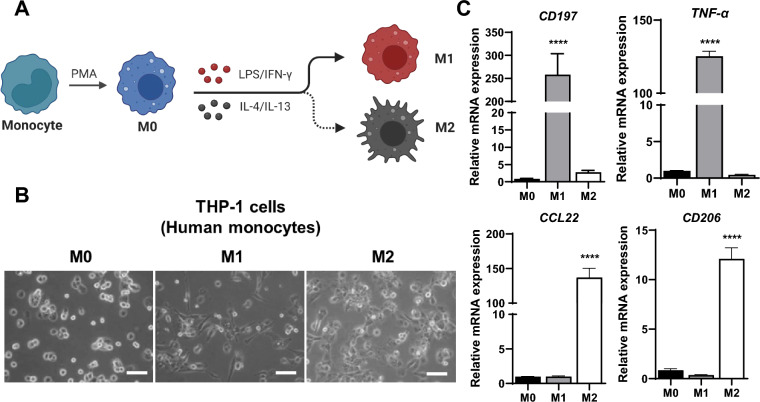
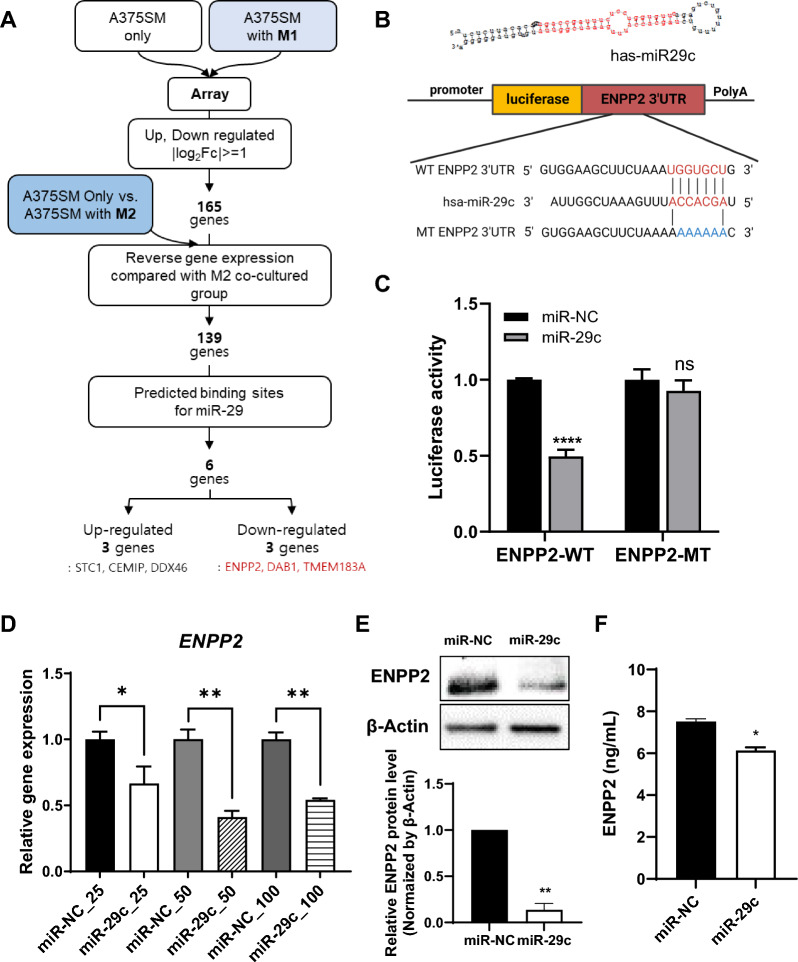
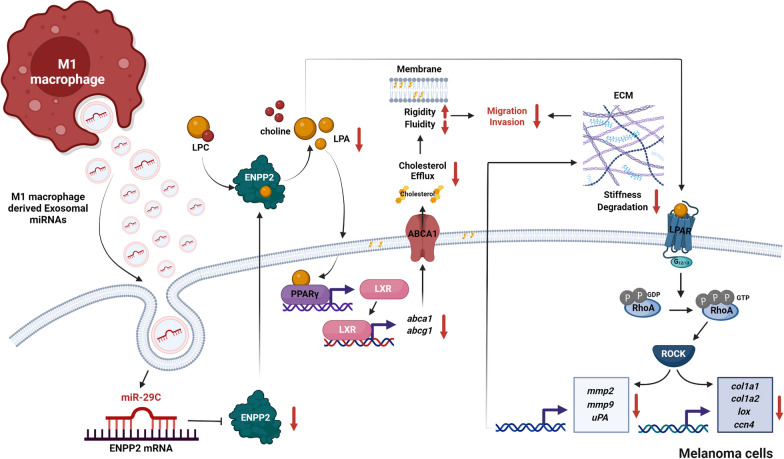
In the tumor microenvironment, macrophages play crucial roles resulting in tumor suppression and progression, depending on M1 and M2 macrophages, respectively. In particular, macrophage-derived exosomes modulate the gene expression of cancer cells by delivering miRNAs which downregulate specific genes. The communication between macrophages and cancer cells is especially important in immunogenic tumors such as melanoma, where the cancer pogression is significantly influenced by the surrounding immune cells. In this study, we identified that M1 macrophages secrete exosomal miR-29c-3p in the co-culture system with melanoma cells. Simultaneously, ENPP2, the target of miR-29c-3p, decreased in the melanoma cells which are co-cultured with M1 macrophages. Additionally, we observed that the reduction of ENPP2 alleviates melanoma cell migration and invasion, due to the changes of cholesterol metabolism and ECM remodeling. Based on these findings, we demonstrated that M1 macrophages suppress aggressiveness of melanoma cells via exosomal miR-29c-3p-mediated knock-down of ENPP2 in cancer cells.

Keywords: ENPP2; Exosomal miR-29c-3p; M1 macrophage; Melanoma; Tumor microenvironment.


Conflict of interest statement

The authors declare no competing interests.

Figures

Fig. 1
Fig. 1
Identification of monocyte-derived M1 and M2 macrophages. A Scheme showing the process from monocyte differentiation to macrophage polarization. B Morphology of M0, M1 and M2 macrophages (Scale bar: 50 μm). C The relative mRNA expression of macrophage phenotype marker genes in M0, M1 and M2 macrophages detected by RT-qPCR. Results were depicted as means ± S.D. (N = 3). ***P < 0.001
Fig. 2
Fig. 2
The miR-29c-3p was validated as a key M1 macrophage-derived exosomal miRNA in the co-culture system with melanoma cells. A The schematic experimental design of co-culture system. The A375SM cells were cultured in the lower chamber while M1 and M2 type of macrophages were cultured respectively in the Transwell insert for 3 days. B The size distribution of macrophage derived exosomes was analyzed by DLS. C The exosomal markers CD63 was detected in cell and exosome lysates with western blotting. The 15 μg protein of each cell and exosome lysate was used. D Heatmap of 30 differentially expressed miRNAs which is derived from M1 or M2 macrophages after co-culture with A375SM cells. R program was used, and the color gradation bar indicates the log2[fold change] value. E Volume plot for differentially expressed miRNA in exosomes derived from M1 macrophages after co-culture with A375SM cells. F The relative miR-29c-3p expression in exosomes derived from M0, M1 and M2 macrophages, was analyzed by miRNA RT-qPCR. Results were depicted as means ± S.D. (N = 3). ***P < 0.001, ****P < 0.00001
Fig. 3
Fig. 3
ENPP2 was predicted as a target gene of M1 macrophage-derived exosomal miR-29c-3p in melanoma cells. A The flowchart to select the target genes of M1 macrophage-derived exosomal miR-29c-3p. B The schematic diagram represents the predicted miR-29c binding site in ENPP2 3’-UTR (WT ENPP2 3’UTR) and the mutated miR-29c binding site (MT ENPP2 3’UTR) is demonstrated below. C Dual luciferase reporter assay was conducted on A375SM cells after co-transfection with miR-29c mimics or miR-NC and ENPP2 3’-UTR WT vector or ENPP2 3’-UTR MT vector. D The A375SM cells were transfected with 25, 50 and 100 pmol/well of miR-29c-3p or miR-NC then were examined for ENPP2 mRNA expression level by RT-qPCR. E The protein level of ENPP2 were detected by western blot and F ELISA assay. After transfection of miR-29c-3p mimics or miR-NC (50 pmol/well) for 48 h, cells and conditioned medium were collected to conduct western blot and ELISA assay, respectively. The β-Actin was used as a loading control of western blot. Results were depicted as means ± S.D. (N = 3). *P < 0.05, **P < 0.01
Fig. 4
Fig. 4
Knock-down of ENPP2 inhibited migration and invasion of melanoma cells. A The mRNA expression level of ENPP2 was examined by RT-qPCR in A375SM cells which were transfected with 25 pmol/well of si-NC or siENPP2 for 48 h. B The protein level of ENPP2 were detected by western blot and C ELISA assay. After transfection of si-NC or siENPP2 (25 pmol/well) for 48 h, cells and conditioned medium were collected to conduct western blot and ELISA assay, respectively. The β-Actin was used as a loading control for western blot. D Scratch wound healing assay in the A375SM cells transfected with si-NC or siENPP2. The distance of cell-free wound was photographed and measured at the 0 h, 24 h and 48 h after scratch (Scale bar:100 μm). E Migration and invasion of A375SM cells transfected with si-NC or siENPP2 were examined by transwell assay (Scale bar: 200 μm). Results were depicted as means ± S.D. (N = 3). *P < 0.05, **P < 0.01, ***P < 0.001
Fig. 5
Fig. 5
Knock-down of ENPP2 accumulated the cholesterol in melanoma cells. A RT-qPCR was conducted to examine the mRNA expression levels of cholesterol homeostasis related genes in A375SM cells which were transfected with 25 or 100 pmol/well of miR-29c-3p for 48 h. The miR-NC transfected cells was used as a negative control. B The mRNA expression levels of ABCA1 and ABCG1 were examined by RT-qPCR in A375SM cells which were transfected with 25 pmol/well of si-NC or siENPP2 for 48 h. C After transfection of si-NC or siENPP2 (25 pmol/well) for 48 h cells were harvested to measure the protein expression levels of ABCA1 and ABCG1 with western blot. The β-Actin was used as a loading control. D PPI interaction network among genes associated with ENPP2 and cholesterol transporters, ABCA1 and ABCG1, was predicted with STRING. E The mRNA expression levels of LXRα/β were determined with RT-qPCR. A375SM cells transfected with 25 pmol/well of siENPP2 for 48 h were subjected to the experiment and si-NC transfected group was used as the negative control. F The protein expression levels of LXRα/β were analyzed by western blot after transfection with siENPP2 or si-NC for 48 h. In both group, 25 pmol/well of siRNA were transfected. As a loading control, β-actin was used. G Filipin staining of A375SM cells transfected for 48 h with 25 pmol/well of siENPP2 or si-NC. (Scale bar: 50 μm) Results were depicted as means ± S.D. (N = 3). *P < 0.05, **P < 0.01, ***P < 0.001
Fig. 6
Fig. 6
Knock-down of ENPP2 modulated the ECM composition and remodeling. A Active RhoA was examined by the RhoA pull down assay in A375SM cells transfected for 48 h with siENPP2 or si-NC (25 pmol/well). The pull-down samples were subjected to Western blot for analyzing active RhoA, while total cell lysates were used to identify the levels of total RhoA and loading control, β-actin. B, C The relative mRNA expression of each gene was determined by RT-qPCR in A375SM cells transfected with 25 pmol/well of siENPP2 or si-NC for 48 h. D The components within each ECM were detected by immunofluorescence staining (Scale bar: 100 μm): Collagen type 1 (green), Actin (red), DAPI (Blue). Results were depicted as means ± S.D. (N = 3). **P < 0.01, ***P < 0.001, ****P < 0.0001
Fig. 7
Fig. 7
Bioinformatic analysis in mouse melanoma models. A Volcano plots of GSE29074 datasets. Each dot represents one gene and ENPP2 was labeled. Block dots mean no significant DEGs between normal group and melanoma group, the blue dots represent down-regulated genes and the red dots indicates up-regulated genes. B The relative ENPP2 expression between normal and melanoma groups in GSE29074 datasets. C DAVID functional GO analysis of BP and D CC with GSE29074 datasets. E The venn diagram indicating DEGs of GSE29074 and GSE7929. F Survival analysis with TCGA public datasets of 439 skin cutaneous melanoma patients. ***P < 0.001
Fig. 8
Fig. 8
The mechanism diagram of M1 macrophage-derived exosomal miR-29c-3p in melanoma cells. The M1 macrophages secrete exosomal miRNAs while they are resident in the TME of melanoma. Among the exosomal miRNAs, miR-29c-3p is the key M1 macrophage-derived exosomal miRNA and down-regulate ENPP2 in melanoma cells when it is delivered by exosome to the melanoma cells. The reduction of ENPP2 leads to cholesterol accumulation and ECM remodeling of melanoma cells, which eventually relieves the migration and invasion. The figure was created by BioRender

References

    1. Siegel R, Miller K, Fuchs H, Jemal A. Cancer statistics, 2020. Ca Cancer J Clin. 2020;70(1):7–30. - PubMed
    1. Koshenkov VP, Broucek J, Kaufman HL. Surgical Management of Melanoma. Cancer Treat Res. 2016;167:149–79. - PubMed
    1. Falcone I, Conciatori F, Bazzichetto C, Ferretti G, Cognetti F, Ciuffreda L, Milella M. Tumor microenvironment: implications in melanoma resistance to targeted therapy and immunotherapy. Cancers. 2020;12(10):2870. - PMC - PubMed
    1. Tucci M, Passarelli A, Mannavola F, Felici C, Stucci LS, Cives M, Silvestris F. Immune system evasion as hallmark of melanoma progression: the role of dendritic cells. Front Oncol. 2019;9:1148. - PMC - PubMed
    1. Azizi E, Carr AJ, Plitas G, Cornish AE, Konopacki C, Prabhakaran S, Nainys J, Wu K, Kiseliovas V, Setty M. Single-cell map of diverse immune phenotypes in the breast tumor microenvironment. Cell. 2018;174(5):1293–308. - PMC - PubMed

LinkOut - more resources