. 2024 Sep 28;21(1):246.
doi: 10.1186/s12974-024-03234-0.

Exercise training upregulates CD55 to suppress complement-mediated synaptic phagocytosis in Parkinson's disease

Affiliations

Exercise training upregulates CD55 to suppress complement-mediated synaptic phagocytosis in Parkinson's disease

Hongkai Yao et al. J Neuroinflammation. .

Abstract

The primary pathological change in Parkinson's disease (PD) is the progressive degeneration of dopaminergic neurons in the substantia nigra. Additionally, excessive microglial activation and synaptic loss are also typical features observed in PD samples. Exercise trainings have been proven to improve PD symptoms, delay the disease progression as well as affect excessive microglial synaptic phagocytosis. In this study, we established a mouse model of PD by injecting mouse-derived α-synuclein preformed fibrils (M-α-syn PFFs) into the substantia nigra, and demonstrated that treadmill exercise inhibits microglial activation and synaptic phagocytosis in striatum. Using RNA-Seq and proteomics, we also found that PD involves excessive activation of the complement pathway which is closely related to over-activation of microglia and abnormal synaptic function. More importantly, exercise training can inhibit complement levels and complement-mediated microglial phagocytosis of synapses. It is probably triggered by CD55, as we observed that CD55 in the striatum significantly increased after exercise training and up-regulation of that molecule rescued motor deficits of PD mice, accompanied with reduced microglial synaptic phagocytosis in the striatum. This research elucidated the interplay among microglia, complement, and synapses, and analyzed the effects of exercise training on these factors. Our work also suggested CD55 as a complement-relevant candidate molecule for developing therapeutic strategies of PD.

Keywords: CD55; Complement pathway; Microglia; Parkinson’s disease; Proteomics and RNA-seq analysis; Synapses.


Conflict of interest statement

The authors declare no competing interests.

Figures
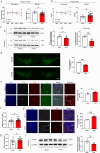
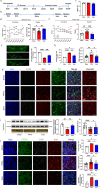
Fig. 1
Fig. 1
Behavioral and pathological changes in the PFF-induced PD mouse model. a Results of rotarod test in Sham and PFFs groups over time and at day21 (Sham group n = 8, PFFs group n = 21). b Results of poles test in Sham and PFFs groups over time and at day21. (Sham group n = 10, PFFs group n = 22) c Western blot showing the expression of TH protein in the substantia nigra (SN) and striatum. (n = 6 per group) d Representative images of immunostaining and relative quantitative analysis of dopamine neurons in the substantia nigra. Scale bar = 1000 μm. (n = 4 per group) e, f Representative images of immunostaining and relative quantitative analysis of active microglia in the substantia nigra. Scale bar = 20 μm. (n = 4 per group) (n = 20 per group from 4 mice each group) g, h Representative images of immunostaining and relative quantitative analysis of active microglia in the striatum. Scale bar = 20 μm. (n = 4 per group) (n = 20 per group from 4 mice each group) i Results of western blot analysis for the striatal expression of PSD95 protein in Sham and PFFs group. (n = 6 per group) All data are presented as mean ± SD. Statistical analysis was performed using unpaired two-tailed t-tests
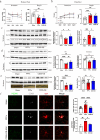
Fig. 2
Fig. 2
Exercise training pattern and behavioral, pathological evaluation. a Experimental paradigm of exercise training. b Exercise training pattern. c Analysis of mouse body weight. (n = 7 per group) (d) Results of rotarod test among three groups over time and the last of exercise training (Day49). (Sham group n = 11, PFFs group n = 10, Exer group n = 11) e Results of poles test among three groups over time and at the last day of exercise training (Day49). (Sham group n = 10, PFFs group n = 11, Exer group n = 11) f Representative images of immunostaining and relative quantitative analysis of dopamine neurons in the substantia nigra. Scale bar = 1000 μm. (n = 4 per group) g Representative images of immunostaining and relative quantitative analysis of dopamine neurons and microglia in the substantia nigra. Scale bar = 20 μm. (n = 4 per group) (n = 20 per group from 4 mice each group) i Western blot and Golgi staining results of striatal PSD95 expression and spine density in the striatum. (n = 6 per group) (n = 18 per group from 3 mice each group) j Representative images of immunostaining and relative quantitative analysis of phagocytic function of microglia in the striatum. Scale bar = 20 μm. (n = 4 per group) (n = 20 per group from 4 mice each group) (n = 4 per group) All data are presented as mean ± SD. Statistical analysis was performed using one-way ANOVA
Fig. 3
Fig. 3
Proteomic and RNA-Seq data analysis revealed the protective effect of exercise and de-regulated complement pathway after exercise. a PCA plot of RNA-Seq data for three groups. b Volcano plot of DEGs. c PFFs group vs Sham group up-regulated genes enrichment pathway. d Exer group vs PFFs group down-regulated genes enrichment pathway. e Differential expression proteins in the substantia nigra of three groups. f GSEA showing the significant changed pathway in the substantia nigra of Sham group vs PFFs group and PFFs group vs Exer group. g Relative expression of proteins associated with “Complement and Coagulation cascades” pathway in the substantia nigra of three groups. h Differential expression proteins in the striatum of three groups. i Heatmap of relative expression of proteins associated with “Complement and Coagulation cascades” pathway in the striatum of three groups
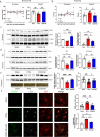
Fig. 4
Fig. 4
Exercise training suppressed complement C3 and C1q levels and inhibited complement-induced phagocytic function of microglia. Level of serum C3 (a) (Sham group n = 6, PFFs group n = 5, Exer group n = 7) and C1q (b) (Sham group n = 5, PFFs group n = 7, Exer group n = 7) concentration measured by Elisa. The correlation of latency of rotarod test and serum C3 (c) and C1q (d) concentration. e Western blot showing the expression of TH protein and complement C3α in the substantia nigra. (n = 6 per group) f Western blot showing the expression of TH protein and complement C3α in the striatum. (n = 6 per group) g Immunofluorescence results and relative quantitative analysis of C1q and microglia co-localization in the striatum. Scale bar = 20 μm. (n = 20 per group from 4 mice each group) h Level of DA concentration measured by Elisa in the striatum. i Western blot showing the expression of CD55 protein in the striatum. (n = 6 per group) All data are presented as mean ± SD. Statistical analysis was performed using one-way ANOVA
Fig. 5
Fig. 5
Behavioral and pathological evaluation of AAV treatment experiment. a The latency time of the rotarod test and pole test in Sham, PFFs, and CD55-OE groups over time and at day21. (Sham group n = 8, PFFs group n = 7, CD55-OE group n = 11) b Time of the pole test in the three groups over time and at day21. (Sham group n = 9, PFFs group n = 8, CD55-OE group n = 11) c Results of western blot for the expression of CD55 and complement C3α in the striatum. (n = 6 per group) d Results of western blot for the expression of TH protein in the substantia nigra and striatum. (n = 6 per group) e Results of western blot for the expression of PSD95 protein in the striatum and spine density count in the striatum. (n = 6 per group) (n = 18 per group from 3 mice each group) f Changes in microglial states and synaptic engulfment function in the striatum among Sham, PFFs, and CD55-OE groups. Scale bar = 10 μm. (n = 15 per group from 3 mice each group) (n = 3per group) All data are presented as mean ± SD. Statistical analysis was performed using one-way ANOVA
Fig. 6
Fig. 6
Behavioral and pathological evaluation of AAV pre-treatment experiment. a The latency time of the rotarod test and pole test in Sham, PFFs, and CD55-OE groups over time and at day21. (Sham group n = 7, PFFs group n = 6, CD55-OE group n = 8) b Time of the pole test in the three groups over time and at day21. (Sham group n = 8, PFFs group n = 6, CD55-OE group n = 7) c Results of western blot for the expression of CD55 and complement C3α in the striatum. (n = 5 per group) d Results of western blot for the expression of TH protein in the substantia nigra and striatum. (n = 5 per group) e Results of western blot for the expression of PSD95 protein in the striatum and spine density count in the striatum. (n = 5 per group) (n = 18 per group from 3 mice each group) f Changes in microglial states and synaptic engulfment function in the striatum among Sham, PFFs, and CD55-OE groups. Scale bar = 10 μm. (n = 15 per group from 3 mice each group) (n = 3per group) All data are presented as mean ± SD. Statistical analysis was performed using one-way ANOVA
Fig. 7
Fig. 7
Proteomics analysis of CD55-OE-AAV pre-treatment group revealed the protective effects of CD55 and potential shared pathways between CD55-AAV overexpression and exercise intervention. a PCA analysis of Sham, PFFs and CD55-OE groups. b Volcano plot of DE Proteins between pairs of groups. c Results of “complement activation pathway” from GSEA of three groups. d Different expression module of three groups and relative pathway enrichment. e Exercise and CD55-OE-AAV common up-regulated GSEA pathway. f Exercise and CD55-OE-AAV common down-regulated GSEA pathway

Similar articles

Cited by

References

    1. Dorsey ER, Elbaz A, Nichols E, Abd-Allah F, Abdelalim A, Adsuar JC, et al. Global, regional, and national burden of Parkinson’s disease, 1990–2016: a systematic analysis for the Global Burden of Disease Study 2016. Lancet Neurol. 2018;17(11):939–53. - PMC - PubMed
    1. Olanow CW, Tatton WG. Etiology and pathogenesis of Parkinson’s disease. Annu Rev Neurosci. 1999;22:123–44. - PubMed
    1. Samii A, Nutt JG, Ransom BR. Parkinson’s disease. Lancet. 2004;363(9423):1783–93. - PubMed
    1. Hayes MT. Parkinson’s disease and parkinsonism. Am J Med. 2019;132(7):802–7. - PubMed
    1. Lees AJ, Hardy J, Revesz T. Parkinson’s disease. Lancet. 2009;373(9680):2055–66. - PubMed

LinkOut - more resources