. 2024 Sep 28;21(1):243.
doi: 10.1186/s12974-024-03241-1.

SIRT6 modulates lesion microenvironment in LPC induced demyelination by targeting astrocytic CHI3L1

Affiliations

SIRT6 modulates lesion microenvironment in LPC induced demyelination by targeting astrocytic CHI3L1

Jingyi Du et al. J Neuroinflammation. .

Abstract

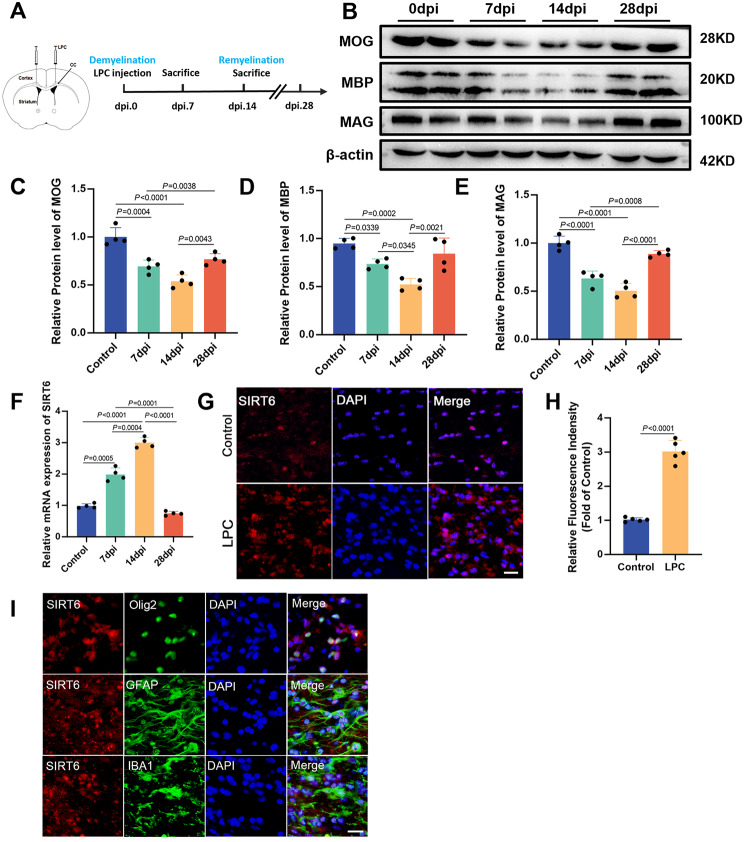
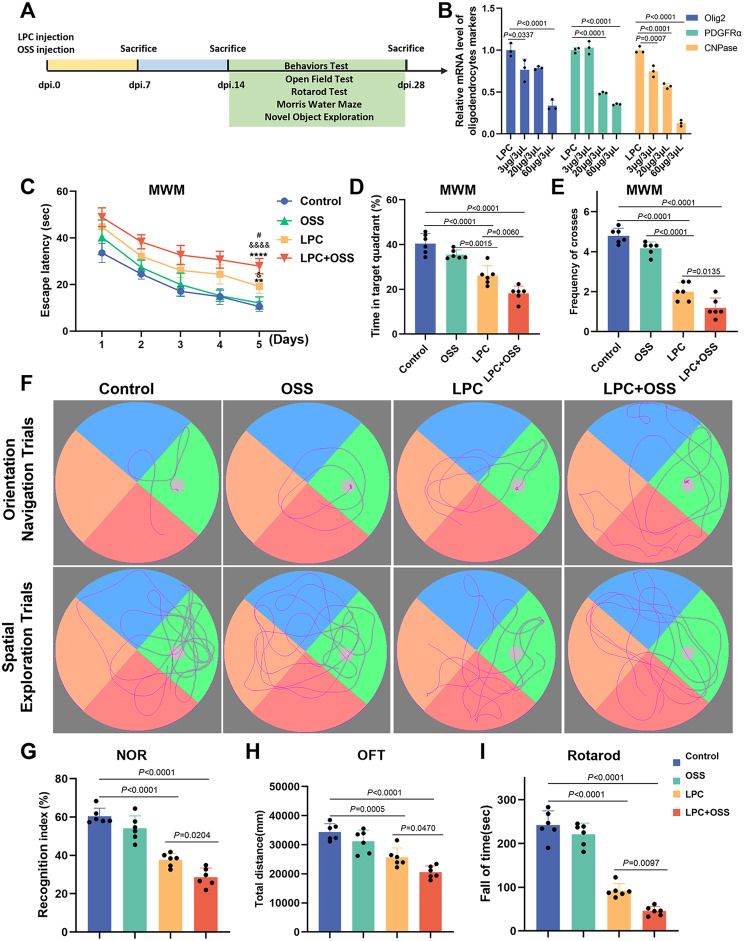
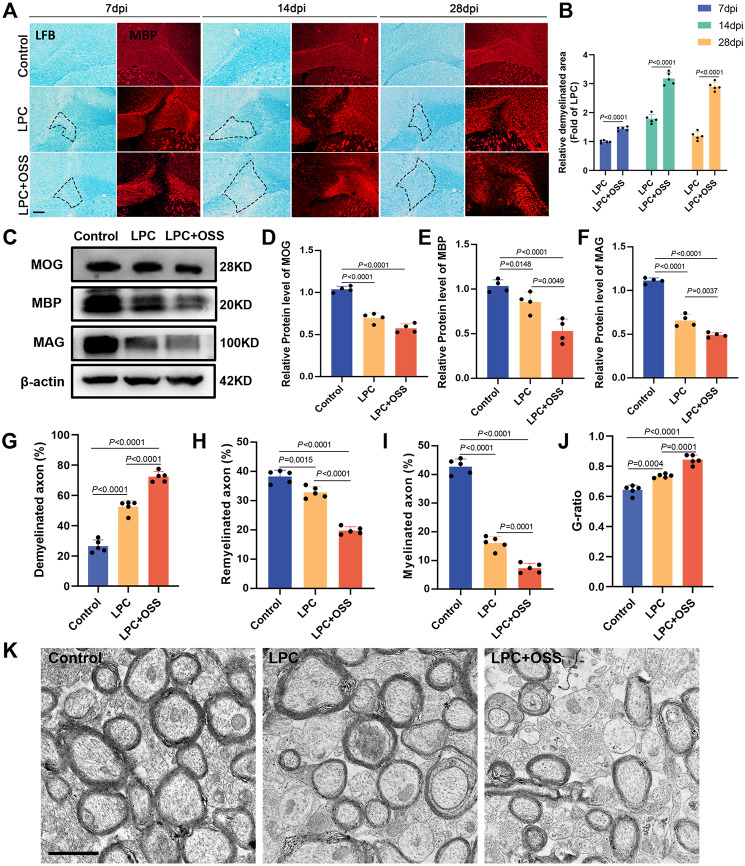
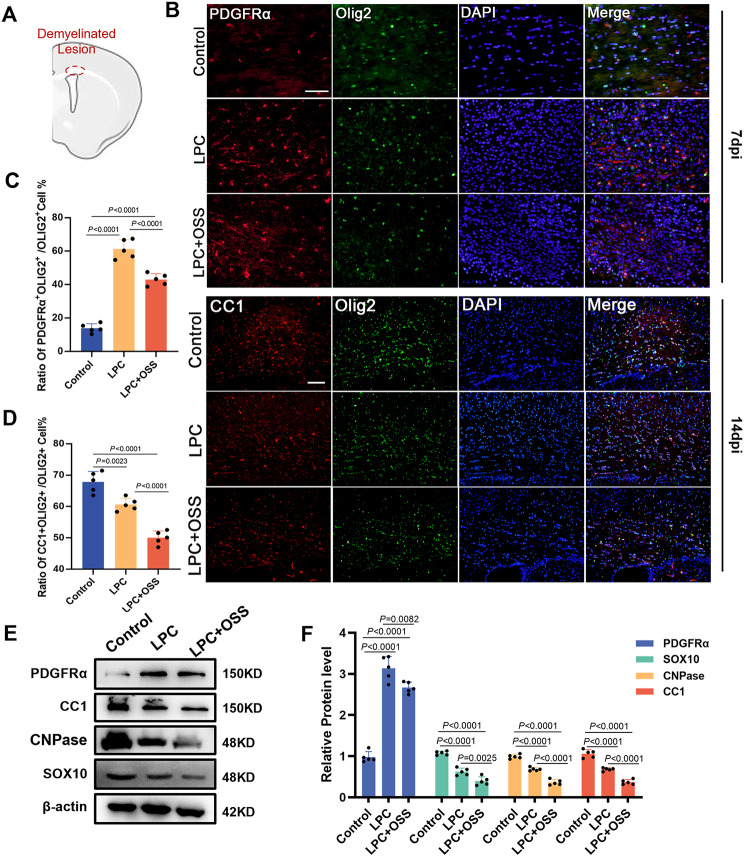
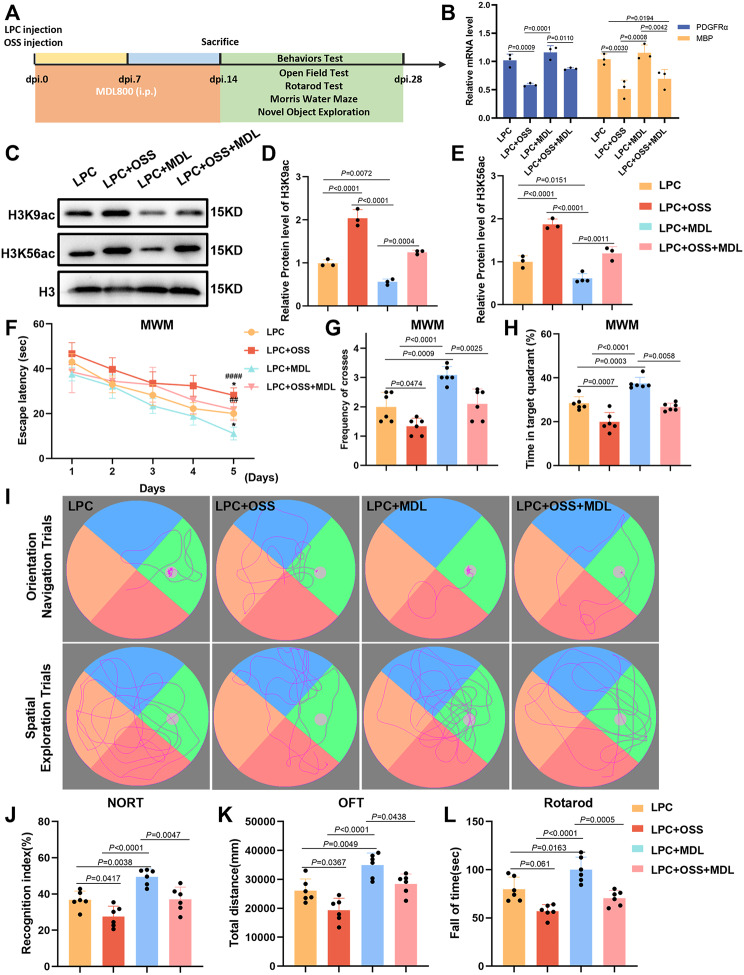
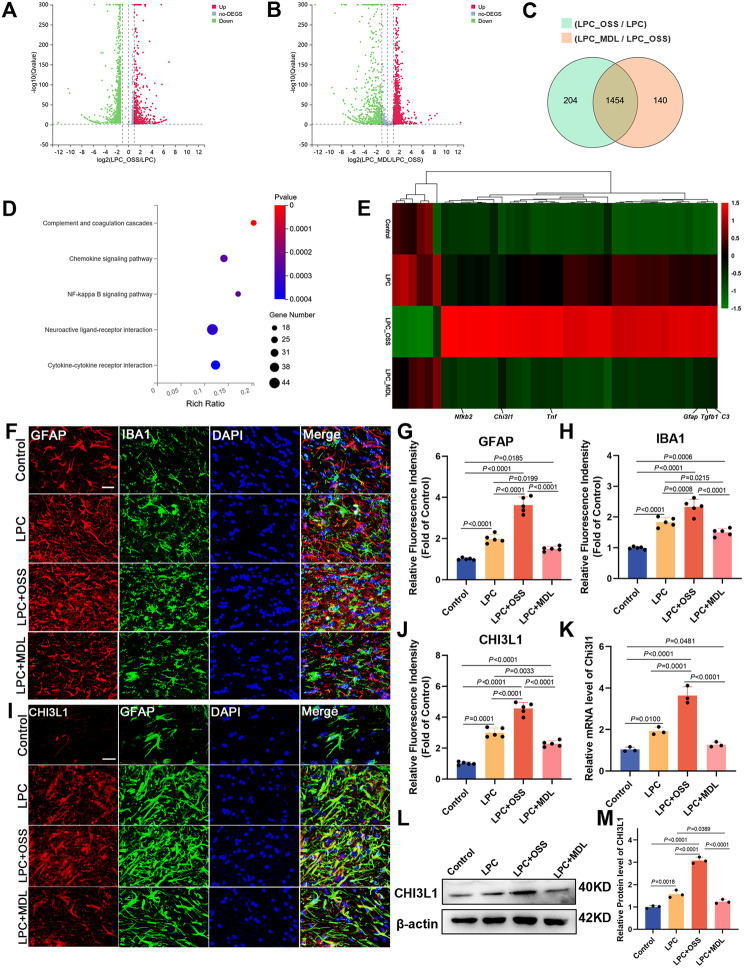
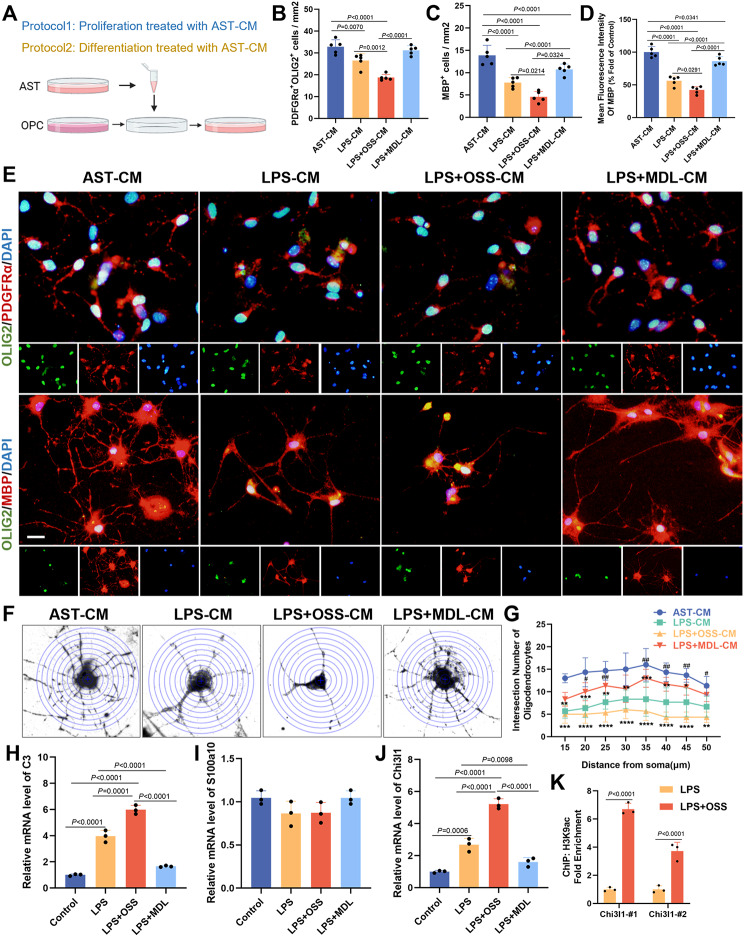
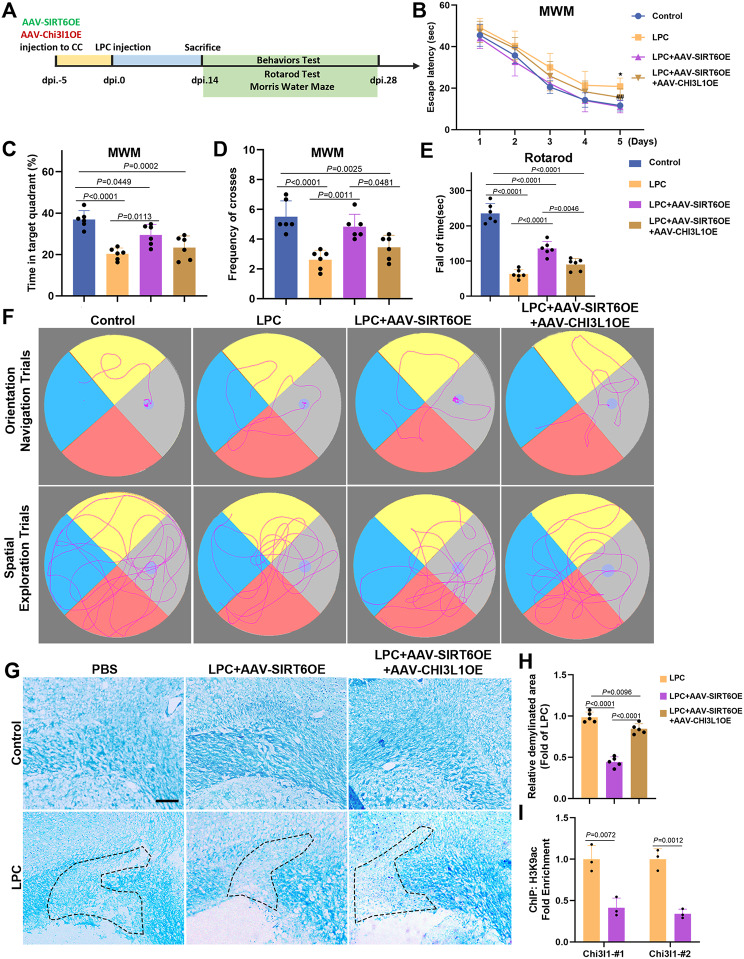
Demyelination occurs widely in the central nervous system (CNS) neurodegenerative diseases, especially the multiple sclerosis (MS), which with a complex and inflammatory lesion microenvironment inhibiting remyelination. Sirtuin6 (SIRT6), a histone/protein deacetylase is of interest for its promising effect in transcriptional regulation, cell cycling, inflammation, metabolism and longevity. Here we show that SIRT6 participates in the remyelination process in mice subjected to LPC-induced demyelination. Using pharmacological SIRT6 inhibitor or activator, we found that SIRT6 modulated LPC-induced damage in motor or cognitive function. Inhibition of SIRT6 impaired myelin regeneration, exacerbated neurological deficits, and decreased oligodendrocyte precursor cells (OPCs) proliferation and differentiation, whereas activation of SIRT6 reversed behavioral performance in mice, demonstrating a beneficial effect of SIRT6. Importantly, based on RNA sequencing analysis of the corpus callosum tissues, it was further revealed that SIRT6 took charge in regulation of glial activation during remyelination, and significant alterations in CHI3L1 were obtained, a glycoprotein specifically secreted by astrocytes. Impaired proliferation and differentiation of OPCs could be induced in vitro using supernatants from reactive astrocyte, especially when SIRT6 was inhibited. Mechanistically, SIRT6 regulates the secretion of CHI3L1 from reactive astrocytes by histone-H3-lysine-9 acetylation (H3K9Ac). Adeno-associated virus-overexpression of SIRT6 (AAV-SIRT6-OE) in astrocytes improved remyelination and functional recovery after LPC-induced demyelination, whereas together with AAV-CHI3L1-OE inhibits this therapeutic effect. Collectively, our data elucidate the role of SIRT6 in remyelination and further reveal astrocytic SIRT6/CHI3L1 as the key regulator for improving the remyelination environment, which may be a potential target for MS therapy.

Keywords: Astrocyte; CHI3L1; Multiple sclerosis; Remyelination; SIRT6.


Conflict of interest statement

The authors declare no competing interests.

Figures

Fig. 1
Fig. 1
Changes in SIRT6 in the corpus callosum at 0, 7, 14, 28 days post-last injury in LPC mice A Schematic depicting the experimental approach and timeline. Mice were subjected to bilateral LPC injection into CC. At 0, 7, 14, 28 dpi after LPC injection, mouse tissue was collected for histopathological, biochemical analyses. B Representative images of western blotting of MOG, MBP, MAG and β-actin at 0, 7, 14, 28 dpi after LPC injection. C-E Quantification of protein expressions of MOG (C), MBP (D), MAG (E) (one-way ANOVA with Tukey’s multiple-comparison test, n = 4 per group). F Expressions of mRNA of SIRT6 at 0, 7, 14, 28 dpi after LPC injection (one-way ANOVA with Tukey’s multiple-comparison test, n = 4 per group). G SIRT6 immunofluorescence staining of corpus callosum tissue sections showed a significant increase of SIRT6-positive cells at 14 dpi in LPC mice. Red: SIRT6, Blue: DAPI, scale bar = 25 μm. H Quantitative analysis of SIRT6 relative fluorescence intensity (two-tailed unpaired Student’s t-test, n = 5 per group). I Immunostaining of SIRT6 (red) or OLIG2 (green), GFAP (green), IBA1 (green) and DAPI (blue) in CC at 14 dpi after LPC injury, scale bar = 25 μm. Data: P < 0.05 is statistically significant. All values are denoted as the mean ± SD
Fig. 2
Fig. 2
Behavioral tests on motor and cognitive function of LPC mice with SIRT6 inhibitor treatment A Schematics of treatment strategies. The SIRT6 selective inhibitor OSS_128167 was bilaterally injected into the ventricle after LPC injection into CC, and behavioral tests were conducted between 14 ~ 28 dpi. Tissues were collected for histopathological, biochemical analyses at 7, 14, 28 dpi. B Olig2, PDGFRα, and CNPase mRNA levels were measured at 14 dpi in demyelinated lesions by qPCR (one-way ANOVA with Tukey’s multiple-comparison test, n = 3 per group). C Escape latencies of the four groups of mice during training days of the Morris water maze (MWM) (two-way ANOVA). D Time of mice spent in the target quadrant in the probe trial of the MWM. E Number of platform crossings during the probe test in the MWM task. F Representative swim trajectories of each group in orientation navigation trials and spatial exploration trials. G Preference index of the novel object. H, I Evaluation of motor function using OFT and Rotarod test in four groups of mice. Statistical analysis was performed using one-way ANOVA and followed by Tukey’s multiple comparisons test, n = 6 per group. Data: P < 0.05 is statistically significant. All values are denoted as the mean ± SD
Fig. 3
Fig. 3
SIRT6 inhibitor exacerbated white matter damage after LPC A Representative images of LFB staining (blue) and MBP immunofluorescence staining (red) in demyelinated lesions at 7, 14, 28 dpi, scale bar = 100 μm. Demyelinated areas were outlined by dashed black lines. B Quantification of demyelinated areas of LFB staining (two-tailed unpaired Student’s t-test, n = 5 per group). C-F Western blotting of MOG, MBP, and MAG in Control, LPC and LPC + OSS group (C), corresponding statistical analysis for protein expressions of MOG (D), MBP (E), and MAG (F) were shown (one-way ANOVA with Tukey’s multiple-comparison test, n = 4 per group). G-K Representative images of transmission electron microscopy in demyelinated lesions (K) and quantification of axons that are myelinated, demyelinated, and remyelinated (%) (G-I) and G-ratio (J), scale bar = 1 μm (one-way ANOVA with Tukey’s multiple-comparison test, n = 5 per group). Data: P < 0.05 is statistically significant. All values are denoted as the mean ± SD
Fig. 4
Fig. 4
OPCs regeneration program was impaired with lower proliferation and differentiation in LPC + OSS group A Schematic diagram of the demyelinating region after LPC injection. B Immunostaining of PDGFRα (red) / OLIG2 (green) / DAPI (blue) at 7 dpi and CC1 (red) / OLIG2 (green) / DAPI (blue) in CC at 14 dpi after LPC injury. PDGFRα: scale bar = 50 μm; CC1: scale bar = 100 μm. C Quantitative analysis of PDGFRα and OLIG2 double-positive cells within lesions (one-way ANOVA with Tukey’s multiple-comparison test, n = 5 per group). D Quantitative analysis of CC1 relative fluorescence intensity (one-way ANOVA with Tukey’s multiple-comparison test, n = 5 per group). E, F Representative images for western blotting of PDGFRα, CC1, CNPase, SOX10 and β-actin in Control and LPC-demyelination group treated by PBS or OSS_128167 (E), statistical analyses of corresponding protein expressions were shown in F (one-way ANOVA with Tukey’s multiple-comparison test, n = 5 per group). Data: P < 0.05 is statistically significant; one-way ANOVA. All values are denoted as the mean ± SD
Fig. 5
Fig. 5
MDL800 improved remyelination and motor and cognitive impairment A Schematics of treatment strategies. Based on above experiment, the MDL treatment group was added. MDL800 was administered continuously by intraperitoneal injection (10 mg/kg) for 14 days after LPC injection, and behavioral tests were conducted between 14 ~ 28 dpi. B Quantification of mRNA expressions of remyelination-related markers MBP and PDGFRα (one-way ANOVA with Tukey’s multiple-comparison test, n = 3 per group). C-E Western blotting analysis of SIRT6 substrates H3K9ac and H3K56ac in demyelinated lesions in CC of four groups (C), corresponding statistical analysis for H3K9ac (D) and H3K56ac (E) were shown (one-way ANOVA with Tukey’s multiple-comparison test, n = 3 per group). F-I The MWM test was conducted and representative swim trajectories of each group (I). The escape latency at training days 1–5 (F) (two-way ANOVA). In the probe test, the number of platform crossings (G) and the time spent in target quadrant (H) were compared among groups (one-way ANOVA with Tukey’s multiple-comparison test, n = 6 per group). J NOR test measuring the time percentage exploring familiar or new objects (one-way ANOVA with Tukey’s multiple-comparison test, n = 6 per group). K Open field test measuring the distance traveled, and the rotarod challenge of motor ability in four groups (L) (one-way ANOVA with Tukey’s multiple-comparison test, n = 6 per group). Data: P < 0.05 is statistically significant. All values are denoted as the mean ± SD
Fig. 6
Fig. 6
RNA-sequencing analysis revealed that SIRT6 played critical roles in astrocytes activation in LPC-induced demyelination A Volcanic map showed the changes in gene expression in the LPC mice vs. LPC + OSS mice. The threshold was set to |log2 (fold change)| ≥1 and Q value < 0.05. B Volcanic map showed the changes in gene expression in the LPC + MDL mice vs. LPC + OSS mice. Green represents downregulation, and red represents upregulation. C Venn diagram of DEGs between LPC vs. LPC + OSS and LPC + MDL vs. LPC + OSS. D Bubble plots of the KEGG enrichment analysis of overlapped DEGs, and bubble sizes represented the numbers of enriched genes. E Heatmap analysis of DEGs associated with the five key pathways among groups, with red represented high expression and green represented low expression for gene expression level. F-H Representative immunofluorescence images of astrogliosis and microgliosis (F), and quantitative analysis of GFAP positive cells (G) and Iba1 positive cells (H) (one-way ANOVA with Tukey’s multiple-comparison test, n = 5 per group). Scale bar = 25 μm. I Representative immunofluorescence images of co-localization of CHI3L1 with GFAP. Scale bar = 25 μm. J Quantitative analysis of SIRT6 relative fluorescence intensity (one-way ANOVA with Tukey’s multiple-comparison test, n = 5 per group). K CHI3L1 mRNA level was measured at 14 dpi in demyelinated lesions by qPCR (one-way ANOVA with Tukey’s multiple-comparison test, n = 3 per group). L-M Representative images for western blotting of CHI3L1 and β-actin in Control and LPC-demyelination group treated by PBS, OSS_128167 or MDL800 (L), statistical analysis of CHI3L1 expressions was shown in M (one-way ANOVA with Tukey’s multiple-comparison test, n = 3 per group). Data: P < 0.05 is statistically significant; one-way ANOVA. All values are denoted as the mean ± SD
Fig. 7
Fig. 7
SIRT6 regulated astrocytes phenotypes and function in vitro A Experimental protocol diagram. Primary astrocytes were used to collect AST-CM with PBS, LPS, LPS + OSS or LPS + MDL, as supplements to primary OPCs cultures in proliferation or differentiation stages. B-E Representative immunofluorescence images of PDGFRα (red) / OLIG2 (green) / DAPI (blue) and MBP (red) / OLIG2 (green) / DAPI (blue) (E), and quantitative analysis of PDGFRα and OLIG2 double-positive cells (B) and MBP positive cells (C, D) (one-way ANOVA with Tukey’s multiple-comparison test, n = 5 per group). Scale bar = 20 μm. F Representative MBP-labeled oligodendrocytes were reconstructed for Sholl analysis with superimposed concentric circles at 5 μm intervals. G Intersection numbers with the concentric circles were shown among groups. H-J Quantification of mRNA expressions of C3, S100a10 and CHI3L1 in primary astrocytes among groups (one-way ANOVA with Tukey’s multiple-comparison test, n = 3 per group). K ChIP assay was performed to detect the enrichment of H3K9ac at the gene promoter regions of CHI3L1 (two-tailed unpaired Student’s t-test, n = 3 per group). Data: P < 0.05 is statistically significant. All values are denoted as the mean ± SD
Fig. 8
Fig. 8
SIRT6 regulated remyelination and functional recovery via CHI3L1 in LPC induced demyelination A Schematics of treatment strategies. Transfection of astrocytes with AAV9 inducing astrocyte-specific GFaABC1D promoter-driven SIRT6 overexpression or CHI3L1 overexpression, with stereotaxical injection into CC, 5 days prior to exposure to LPC injuries in 8-week-old C57BL/6 mice. Behavioral tests were conducted between 14 ~ 28 dpi. Tissues were collected for histopathological, biochemical analyses at 14 dpi. B-D The MWM test was conducted. The escape latency at training days 1–5 (B) (Two-way ANOVA). In the probe test, the time spent in target quadrant (C) and the number of platform crossings (D) were compared among groups (one-way ANOVA with Tukey’s multiple-comparison test, n = 6 per group). E Rotarod test (one-way ANOVA with Tukey’s multiple-comparison test, n = 6 per group). F Representative swim trajectories of each group in orientation navigation trials and spatial exploration trials. G Representative images of LFB staining (blue) in demyelinated lesions in Control and LPC mice treated by PBS, AAV-SIRT6OE or AAV-SIRT6OE + AAV-CHI3L1OE, scale bar = 100 μm. H Statistical analysis for demyelinated areas (one-way ANOVA with Tukey’s multiple-comparison test, n = 5 per group). I ChIP-qPCR analysis to determine the histone acetylation of CHI3L1 promoter in AAV infected CC (two-tailed unpaired Student’s t-test, n = 3 per group). Data: P < 0.05 is statistically significant. All values are denoted as the mean ± SD

Similar articles

References

    1. Woo MS, Engler JB, Friese MA. The neuropathobiology of multiple sclerosis. Nat Rev Neurosci. 2024;25(7):493–513. - PubMed
    1. Højsgaard Chow H, Schreiber K, Magyari M, Ammitzbøll C, Börnsen L, Romme Christensen J, et al. Progressive multiple sclerosis, cognitive function, and quality of life. Brain Behav. 2018;8(2):e00875. - PMC - PubMed
    1. Bachmann H, Vandemoortele B, Vermeirssen V, Carrette E, Vonck K, Boon P, Raedt R, et al. Vagus nerve stimulation enhances remyelination and decreases innate neuroinflammation in lysolecithin-induced demyelination. Brain Stimul. 2024;17(3):575–87. - PubMed
    1. McMurran CE, Zhao C, Franklin RJM. Toxin-based models to investigate demyelination and remyelination. Methods Mol Biol. 2019;1936:377–96. - PubMed
    1. Korotkov A, Seluanov A, Gorbunova V. Sirtuin 6: linking longevity with genome and epigenome stability. Trends Cell Biol. 2021;31(12):994–1006. - PMC - PubMed

LinkOut - more resources