. 2024 Sep 28;21(1):245.
doi: 10.1186/s12974-024-03214-4.

AIBP controls TLR4 inflammarafts and mitochondrial dysfunction in a mouse model of Alzheimer's disease

Affiliations

AIBP controls TLR4 inflammarafts and mitochondrial dysfunction in a mouse model of Alzheimer's disease

Yi Sak Kim et al. J Neuroinflammation. .

Abstract

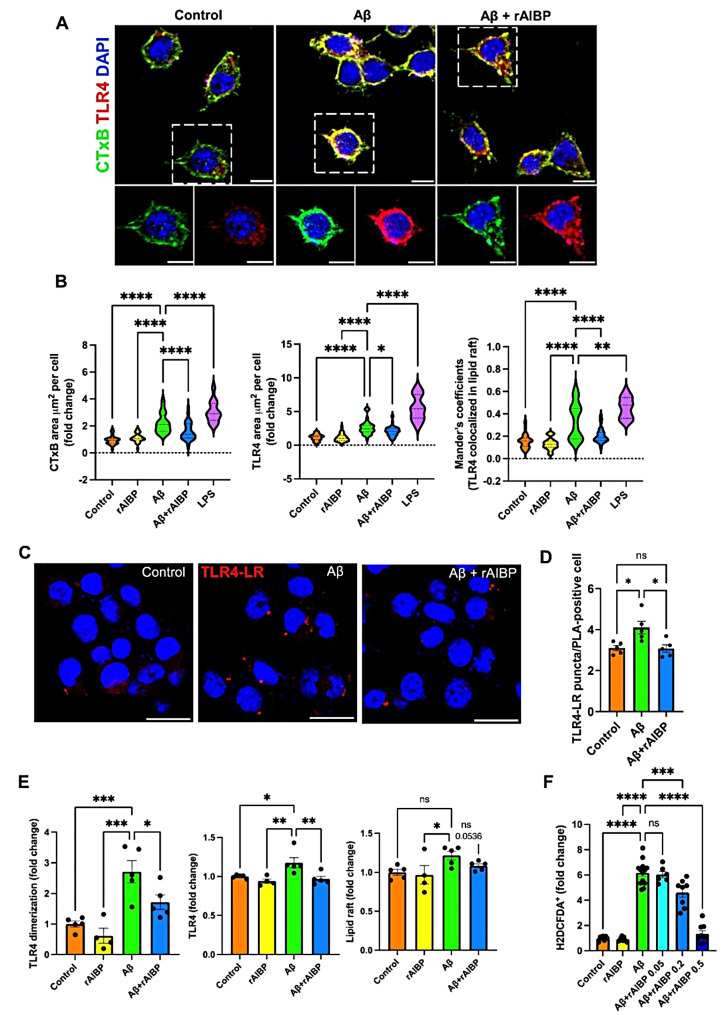
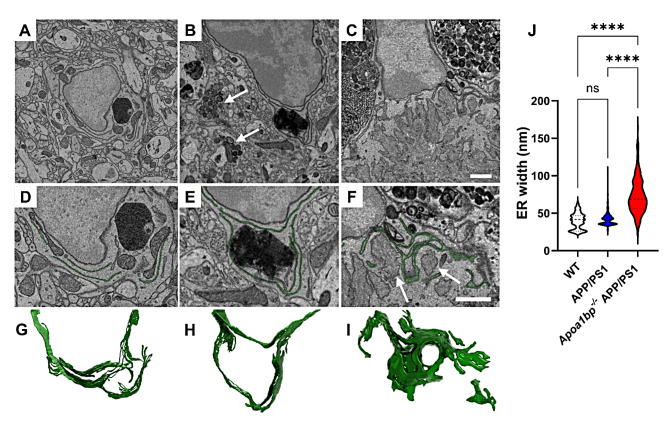
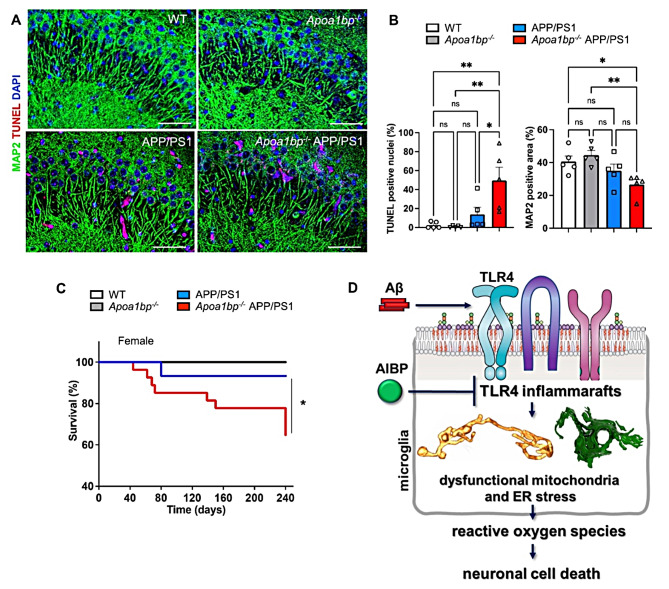
Microglia-driven neuroinflammation plays an important role in the development of Alzheimer's disease. Microglia activation is accompanied by the formation and chronic expression of TLR4 inflammarafts, defined as enlarged and cholesterol-rich lipid rafts serving as an assembly platform for TLR4 dimers and complexes of other inflammatory receptors. The secreted apoA-I binding protein (APOA1BP or AIBP) binds TLR4 and selectively targets cholesterol depletion machinery to TLR4 inflammaraft-expressing inflammatory, but not homeostatic microglia. Here we demonstrated that amyloid-beta (Aβ) induced formation of TLR4 inflammarafts in microglia in vitro and in the brain of APP/PS1 mice. Mitochondria in Apoa1bp-/- APP/PS1 microglia were hyperbranched and cupped, which was accompanied by increased reactive oxygen species and the dilated endoplasmic reticulum. The size and number of Aβ plaques and neuronal cell death were significantly increased, and the animal survival was decreased in Apoa1bp-/-APP/PS1 compared to APP/PS1 female mice. These results suggest that AIBP exerts control of TLR4 inflammarafts and mitochondrial dynamics in microglia and plays a protective role in Alzheimer's disease associated oxidative stress and neurodegeneration.

Keywords: AIBP; Alzheimer’s disease; Inflammaraft; Lipid rafts; Microglia; Mitochondria; Neuroinflammation; Oxidative stress; TLR4.


Conflict of interest statement

Y.I.M., S.-H.C. and W.-K.J. are inventors listed in patent applications related to the topic of this paper. Y.I.M. is scientific co-founder of Raft Pharmaceuticals LLC. The terms of this arrangement have been reviewed and approved by the University of California, San Diego in accordance with its conflict of interest policies. Other authors declare that they have no competing interests.

Figures

Fig. 1
Fig. 1
AIBP protects microglia against Aβ-induced TLR4 inflammarafts and oxidative stress. BV-2 cells were incubated with rAIBP for 2 h before a 24-h exposure to Aβ (7PA2-conditioned media containing 300 pM Aβ42) or control (CHO-conditioned media). The rAIBP concentrations were 0.5 µg/ml in panels A-E, and 0.05, 0.2, or 0.5 µg/ml in panel F. See also Figure S1A. (A and B) Colocalization of TLR4 and lipid rafts. Immunostaining with CTxB-FITC (lipid raft; green), anti-TLR4 antibody (red), and DAPI (nuclei; blue). As a positive control, BV-2 cells were incubated with 100 ng/ml LPS. Manders’ overlap coefficients were calculated to assess TLR4 overlapping with lipid rafts. Data were collected from 24 to 43 fields of 4–8 biological replicates in three independent experiments. Scale bar, 10 μm, (C and D) TLR4-CTxB (LR, lipid rafts) proximity ligation assay (Texas red probe) in BV-2 cells. Scale bars, 20 μm. The number of PLA puncta signals in PLA-positive cells was quantified from an average of two fields in each biological replicate (n = 5/group), from two independent experiments. See also Figure S1B. (E) Flow cytometry analysis of TLR4 expression and dimerization using TLR4-APC and TLR4/MD2-PE antibodies and of lipid raft content (CTxB-FITC) in BV-2 cells; 4–5 biological replicates per group from two independent experiments. (F) Flow cytometry analysis of intracellular ROS (H2DCFDA); 7–13 biological replicates per group, from three independent experiments. Mean ± SEM. One-way ANOVA with Dunnett’s multiple comparisons test (Aβ vs. each group)
Fig. 2
Fig. 2
AIBP deficiency exacerbates TLR4 inflammarafts and oxidative stress in APP/PS1 mice. (A-C) Flow cytometry analysis of CD11b+ CD45low microglia cells in single cell suspensions isolated from age-matched 6-months old female mice (n = 6 per group). (A) TLR4 dimerization, (B) TLR4 expression, and (C) lipid raft content (CTxB). (D and E) Female mouse brain tissues (WT n = 5, APP/PS1 n = 5, and Apoa1bp−/− APP/PS1 n = 8) were stained with the superoxide indicator dihydroethidium (DHE, 10 µM; red). Representative images in the dentate gyrus (DG) and cortex. Scale bar, 100 μm. Mean ± SEM. One-way ANOVA with Tukey’s multiple comparisons test
Fig. 3
Fig. 3
Hyper-branched and cupped mitochondria in microglia of Apoa1bp−/− APP/PS1 mice and AD subjects. SBEM slices and surface rendering of mitochondria from hippocampal microglia of WT (A, D, G), APP/PS1 (B, E, H) and Apoa1bp−/− APP/PS1 (C, F, I) female mice. (A-C) SBEM slices; arrows in A: large mitochondria; B: small mitochondria near a lipofuscin aggregate; C and inset: cupped-shaped mitochondria. (D-F) Segmentation and surface-rendering of the microglia cell shown in A-C, displaying the cell volume boundary (translucent maroon), the nucleus (brown) and mitochondria (lighter shades of brown). Fourteen mitochondria in D, 46 in E and 72 in F. Higher mitochondrial volume density in Apoa1bp−/− APP/PS1 than in either WT or APP/PS1 microglia. (G-I). Mitochondria from the surface-rendering shown in D-F. (G) Typically large mitochondria in WT; a few are branched. (H) APP/PS1: smaller mitochondria, with more than twice as many branched mitochondria, than typically found in WT microglia, but those branched have fewer branches, contributing to their smaller volumes. A greater number of cupped mitochondria (arrow). (I) Apoa1bp−/− APP/PS1: increased branching and cupping (arrows) compared with WT and APP/PS1 microglia, which contribute to the large mitochondrial volumes. (J) Measurements of branched and cupped mitochondria, and total length and volume (n = 3–6 microglia from 2 mice per group; a total of 28 (WT), 102 (APP/PS1) and 166 (Apoa1bp−/− APP/PS1) mitochondria were measured). (K) Human AD cortex SBEM showing 2 microglia with 2 branched mitochondria on the left (yellow and green traces) and the ring-shaped mitochondrion on the right (yellow trace). The cell membrane is traced in blue. (L) Surface rendering of ring, cupped and branched mitochondria from SBEM volumes shown in panel K
Fig. 4
Fig. 4
AIBP protects microglia against Aβ-altered mitochondrial respiration. BV-2 cells were preincubated with rAIBP (0.2 µg/ml) or BSA for 2 h before a 24-h exposure to Aβ (7PA2-conditioned media containing 300 pM Aβ42) or control (CHO-conditioned media). Seahorse data are OCR plotted versus time. Basal and maximal respiration, spare capacity, and ATP production were measured (n = 15 per group). Mean ± SEM. One-way ANOVA with Tukey’s multiple comparisons test
Fig. 5
Fig. 5
AIBP deficiency triggers ER swelling in activated microglia. (A, D, G) A representative SBEM image plane from female WT microglial cell showing a typical ER structure (A). Images for cross-section (D) and 3D rendering (G) of thin ER cisternae in WT microglia. (B, E, H) Activated microglia phenotype and dystrophic neurites (arrows) in female APP/PS1 mice, showing no evidence of the dilation in ER cisternae. (C, F, I) Swollen ER cisternae morphology in microglia from female Apoa1bp−/− APP/PS1 mice. Note that ER dilation was profound near the amyloid plague (arrows). (J) Quantification of the ER width in female WT, APP/PS1, and Apoa1bp−/− APP/PS1 microglia; violin plot (n = 250–259 per group; lumen width was measured for 68–96 ER segments per microglial cell; 3 microglial cells from 2 mouse brains per group). Mean ± SEM. One-way ANOVA with Tukey’s multiple comparisons test. Scale bar, 1 μm
Fig. 6
Fig. 6
Altered microglia morphology in Apoa1bp−/− APP/PS1 mouse brain. (A) Representative IBA1-positive microglia cells (green) and skeletonized rendering in the cortex of 6 months-old female mice. Scale bar, 20 μm. (B) Skeletonize macros in ImageJ were used to measure the number of branches, branch length, the number of cells per field of view, and the soma size (195–313 microglial cells per group). An average of two fields of view for each mouse (n = 5 per group). Mean ± SEM. One-way ANOVA with Tukey’s multiple comparisons test
Fig. 7
Fig. 7
AIBP deficiency increases the number of Aβ plaques in APP/PS1 mouse brain. (A) Representative hippocampal images showing 82E1 (Aβ; green), IBA1 (microglia; red), and DAPI (nuclei; blue) staining in the brain of age-matched 6 months-old female mice. Scale bar, 400 μm. (B) The number of Aβ plaques and the total plaque area in the hippocampus. WT (n = 4), Apoa1bp−/− (n = 5), APP/PS1 (n = 5), and Apoa1bp−/− APP/PS1 (n = 14). (C) Cortical Aβ42 peptide levels in age-matched 6 months-old female mice: WT (n = 9), APP/PS1 (n = 10), and Apoa1bp−/− APP/PS1 (n = 10) measured in soluble DEA fraction and insoluble FA fraction. Mean ± SEM; one-way ANOVA with Tukey’s multiple comparison test. See also Figure S2
Fig. 8
Fig. 8
AIBP deficiency exacerbates neuronal cell death and reduces survival of APP/PS1 mice. (A and B) TUNEL (red) and MAP2 (green) staining in the CA3 area of age-matched 6 months-old female mice (n = 5). A: Representative images. Scale bar, 50 μm. B: the percentage of TUNEL-positive nuclei and MAP2-positive area. See also Figure S3. (C) Survival curve of female mice: WT (n = 10), Apoa1bp−/− (n = 7), APP/PS1 (n = 14), and Apoa1bp−/− APP/PS1 (n = 20). Mean ± SEM; one-way ANOVA with Tukey’s multiple comparison test (B) and Mantel-Cox log-rank test (C). (D) This study results suggest that increasing levels of Aβ induce TLR4 inflammaraft formation in microglia, which can be inhibited by adding recombinant AIBP protein in vitro, or exacerbated by AIBP deficiency in vivo. The Aβ overproduction and AIBP deficiency together lead to dysregulation of mitochondrial dynamics and the appearance of hyper-branched and cupped mitochondria, as well as dilated ER, both characteristic of the conditions associated with oxidative stress. Increased ROS production in the brain induces neuronal cell death

Update of

References

    1. Sviridov D, Miller YI. Biology of lipid rafts: introduction to the Thematic Review Series. J Lipid Res. 2020;61:598–600. - PMC - PubMed
    1. Lingwood D, Simons K. Lipid rafts as a membrane-Organizing Principle. Science. 2010;327:46–50. - PubMed
    1. Sezgin E, Levental I, Mayor S, Eggeling C. The mystery of membrane organization: composition, regulation and roles of lipid rafts. Nat Rev Mol Cell Biol. 2017;18:361–74. - PMC - PubMed
    1. Woller SA, et al. Inhibition of Neuroinflammation by AIBP: spinal effects upon facilitated Pain States. Cell Rep. 2018;23:2667–77. - PMC - PubMed
    1. Navia-Pelaez JM, et al. Normalization of cholesterol metabolism in spinal microglia alleviates neuropathic pain. J Exp Med. 2021;218:e20202059. - PMC - PubMed

MeSH terms