. 2024 Sep 28;55(1):125.
doi: 10.1186/s13567-024-01378-8.

Hepatic transcriptomic analysis reveals differential regulation of metabolic and immune pathways in three strains of chickens with distinct growth rates exposed to mixed parasite infections

Affiliations

Hepatic transcriptomic analysis reveals differential regulation of metabolic and immune pathways in three strains of chickens with distinct growth rates exposed to mixed parasite infections

Oyekunle John Oladosu et al. Vet Res. .

Abstract

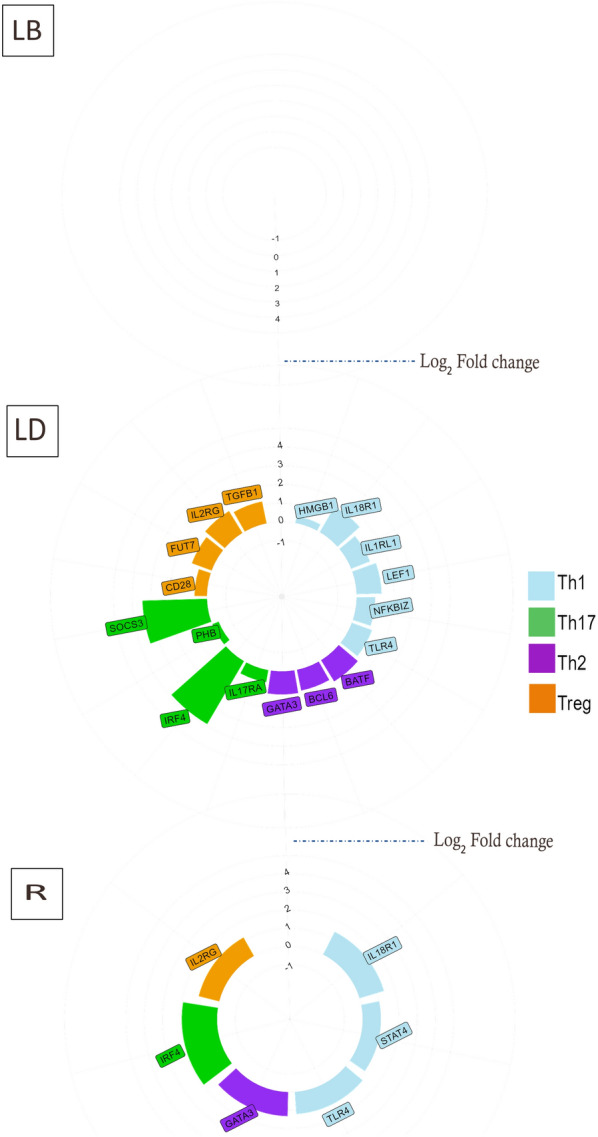
During parasite infections, the liver may prioritise immune-related pathways over its metabolic functions. Intestinal infections caused by Ascaridia galli and Heterakis gallinarum impair feed intake, nutrient absorption, and weight gain. Histomonas meleagridis, vectored by H. gallinarum, can also damage liver tissues, potentially impairing liver functions. This study examined the hepatic gene expression in three strains of chickens: Ross-308 (R), Lohmann Brown Plus (LB), and Lohmann Dual (LD), 2 weeks after an experimental infection (n = 18) with both A. galli and H. gallinarum or kept as uninfected control (n = 12). Furthermore, H. gallinarum infection led to a co-infection with H. meleagridis. The mixed infections reduced feed intake and the average daily weight gain (P < 0.001). The infections also increased the plasma concentrations of alpha (1)-acid glycoprotein and the antibody titre against H. meleagridis (P = 0.049), with no strain differences (P > 0.05). For host molecular response, 1887 genes were differentially expressed in LD, while 275 and 25 genes were differentially expressed in R and LB, respectively. The up-regulated genes in R and LD were mostly related to inflammatory and adaptive immune responses, while down-regulated genes in LD were involved in metabolic pathways, including gluconeogenesis. Despite performance differences among the strains, worm burdens were similar, but hepatic molecular responses differed significantly. Moreover, there was an indication of a shift in hepatic functions towards immune-related pathways. We, therefore, conclude that the liver shifts its functions from metabolic to immune-related activities in chickens when challenged with mixed parasite species.

Keywords: Ascaridia galli; Heterakis gallinarum; Histomonas meleagridis; Growth performance; immune response; metabolic response; resource allocation; trade-off.


Conflict of interest statement

The authors declare that they have no competing interests.

Figures

Figure 1
Figure 1
Growth performance, feed intake, and feed conversion ratio in three chicken strains with distinct growth rates following mixed-parasite infections. The fixed effects of host strain, (AC) infection (DF), and their interaction (not shown) on average daily feed intake (g/bird), average daily weight gain (g/d), and feed conversion ratio within the three strains of birds, namely, Lohmann Brown (LB), Lohmann Dual (LD), and Ross (R). Each dot represents the average value for each variable, with bars depicting the standard errors of the mean. The line inside the boxplots shows the sample median, while the lower and upper end of the box represent the 25th and 75th quantiles, respectively (n per strain = 10, n infected birds = 18, n birds in control = 12).
Figure 2
Figure 2
Infection proxies. Plasma antibody titres against A Ascarids, and B Histomonas meleagridis, as well as C the plasma concentration of the acute-phase protein AGP, and D the PCR quantification of histomonads per total daily faeces (HPD) were measured. Each dot in the boxplot represents an individual bird, with uninfected birds represented by orange dots and infected birds represented by blue dots. The lower and upper ends of the box represent the 25th and 75th quantiles, respectively. Statistical analyses are based on log-transformed data [log(y + 1)], while visualisation is based on untransformed data. (n infected birds = 18, n birds in control = 12).
Figure 3
Figure 3
Principal component analysis showing the overall separation of host-strains and infection groups based on the RNA-sequencing profiles. Principal component analysis (PCA) was performed on gene expression data to visualise the clustering of samples based on infection status and genotype. The plot displays two principal components, PC1 and PC2, which account for 46% and 14%, respectively, of the total variance in the data. Each point represents an individual sample, shape-coded according to infection group (Infected and Control) and coloured by strain (LB, LD, R).
Figure 4
Figure 4
Volcano plots showing differentially up-regulated and downregulated genes due to infection and strain effects. Volcano plots showing differentially up-regulated genes (red dots) and downregulated genes (blue dots) due to infection effects (infected versus non-infected, FDR < 0.05) in A Lohmann Brown, B Lohmann Dual, and C Ross strains. Non-significant genes are shown in grey dots.
Figure 5
Figure 5
Pairwise comparison of DEGs due to the infection effect within strains. Venn diagram showing the number of overlapping and unique differentially expressed genes due to infection effects (infection versus contrast) in all 3 strains of birds.
Figure 6
Figure 6
Pairwise comparison of DEGs due to genotypic differences within the infection group. Mosaic plot showing the number of differentially expressed genes (DEG) in the contrasts between the 3 chicken strains in infected (blue bar) and control (orange bar). There are no differences in the number of DEGs in the contrast between Lohmann Dual and Lohmann Brown in the control group.
Figure 7
Figure 7
Th genes in the hepatic of chickens infected with mixed parasites. Differential expression levels of Th genes specific for immune functions in the liver of chickens infected with mixed parasites. Colour-filled bars: significant fold changes for each group of markers, FDR < 0.05. Positive/negative log2fold change value indicates up-regulated/downregulated expression in livers from infected birds compared with non-infected birds of A Lohmann brown strain, B Lohmann dual strain, C Ross strain. There are no significant DEGs assigned to Th in the Lohmann brown strain.
Figure 8
Figure 8
Plot of significant GO and KEGG pathways enriched by significantly up-regulated genes (red dots) and downregulated genes (blue dots) due to infection effect in Lohmann dual (LD) and Ross (R) strain. Eratio is the ratio of enrichment given by the number of observed genes divided by the number of expected genes from each GO or KEGG category.

Similar articles

Cited by

References

    1. Zuidhof MJ, Schneider BL, Carney VL, Korver DR, Robinson FE (2014) Growth, efficiency, and yield of commercial broilers from 1957, 1978, and 2005. Poult Sci 93:2970–2982 - PMC - PubMed
    1. Rauw WM, Kanis E, Noordhuizen-Stassen EN, Grommers FJ (1998) Undesirable side effects of selection for high production efficiency in farm animals: a review. Livest Prod Sci 56:15–33
    1. van der Most PJ, de Jong B, Parmentier HK, Verhulst S (2011) Trade-off between growth and immune function: a meta-analysis of selection experiments. Funct Ecol 25:74–80
    1. Glazier DS (2008) Resource allocation patterns. Resource allocation theory applied to farm animal production. CABI, Wallingford, pp 22–43
    1. Rauw WM (2012) Immune response from a resource allocation perspective. Front Genet 3:267 - PMC - PubMed

LinkOut - more resources