. 2024 Nov 6;32(11):4138-4157.
doi: 10.1016/j.ymthe.2024.09.029. Epub 2024 Sep 27.

GTSE1-driven ZEB1 stabilization promotes pulmonary fibrosis through the epithelial-to-mesenchymal transition

Affiliations

GTSE1-driven ZEB1 stabilization promotes pulmonary fibrosis through the epithelial-to-mesenchymal transition

Hee Jin et al. Mol Ther. .

Abstract

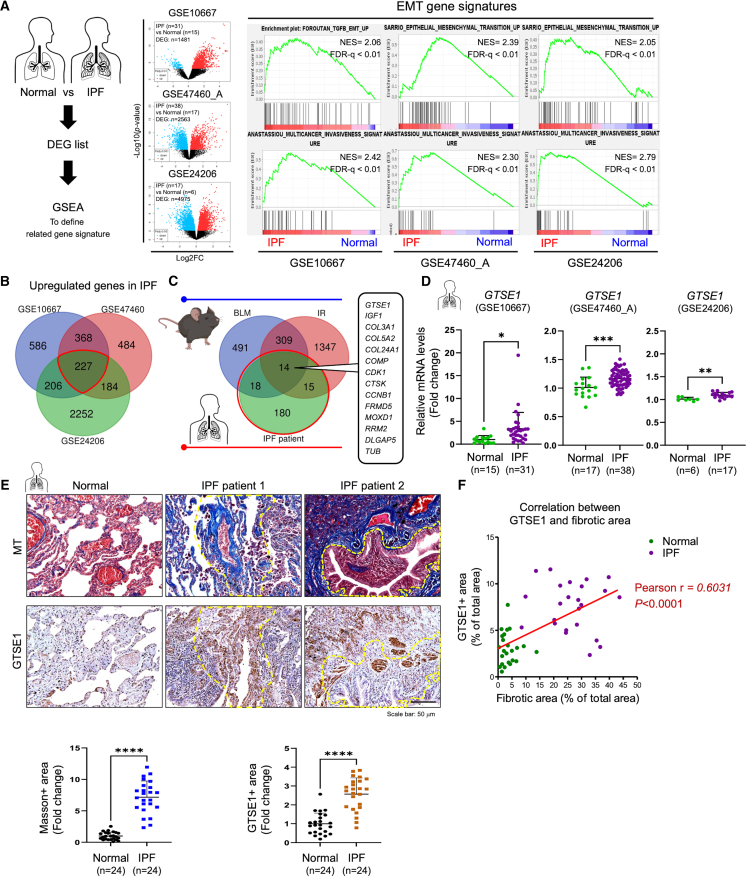
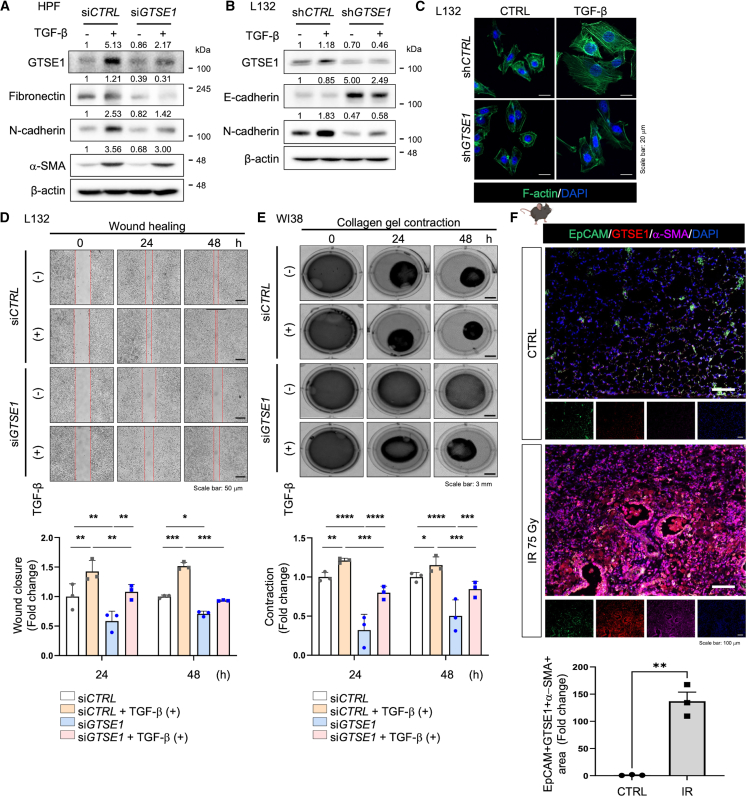
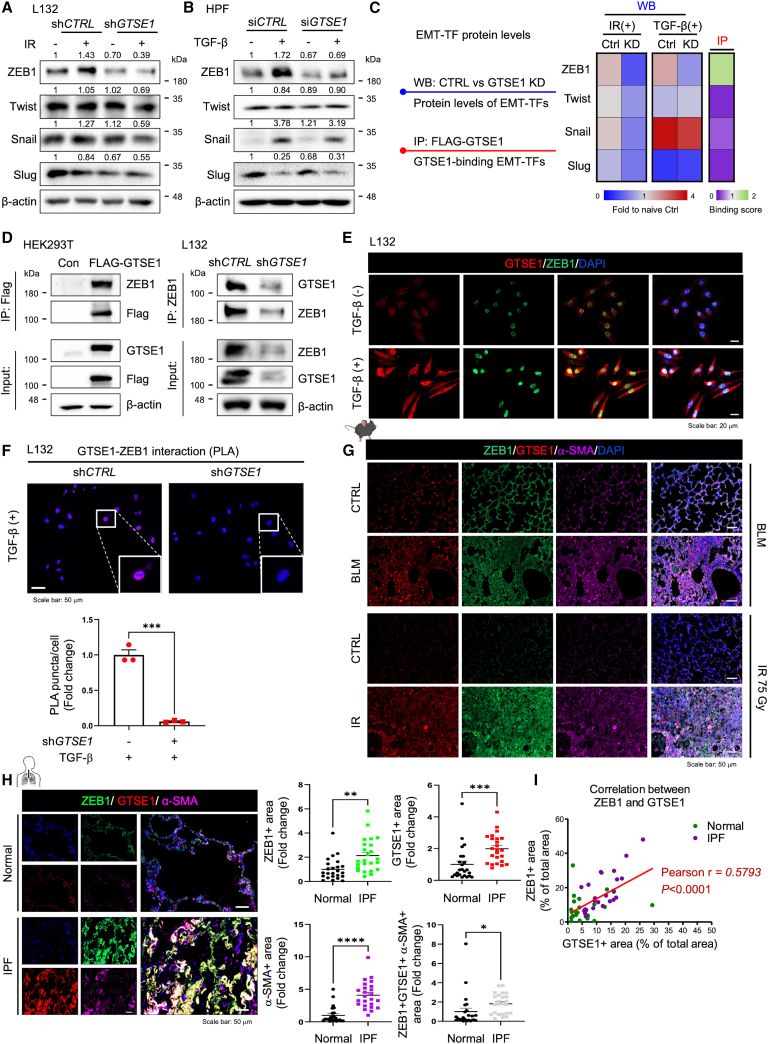
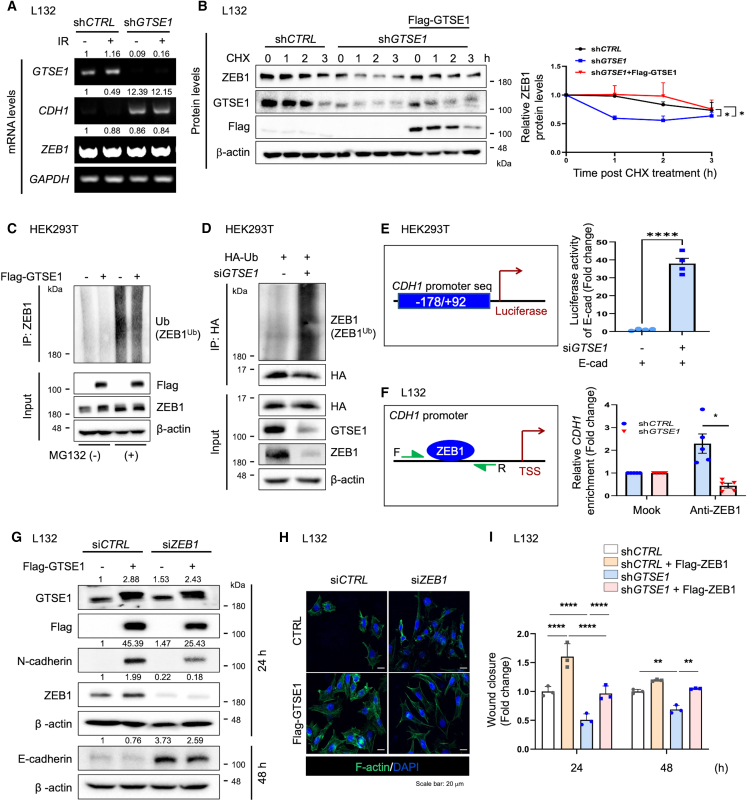
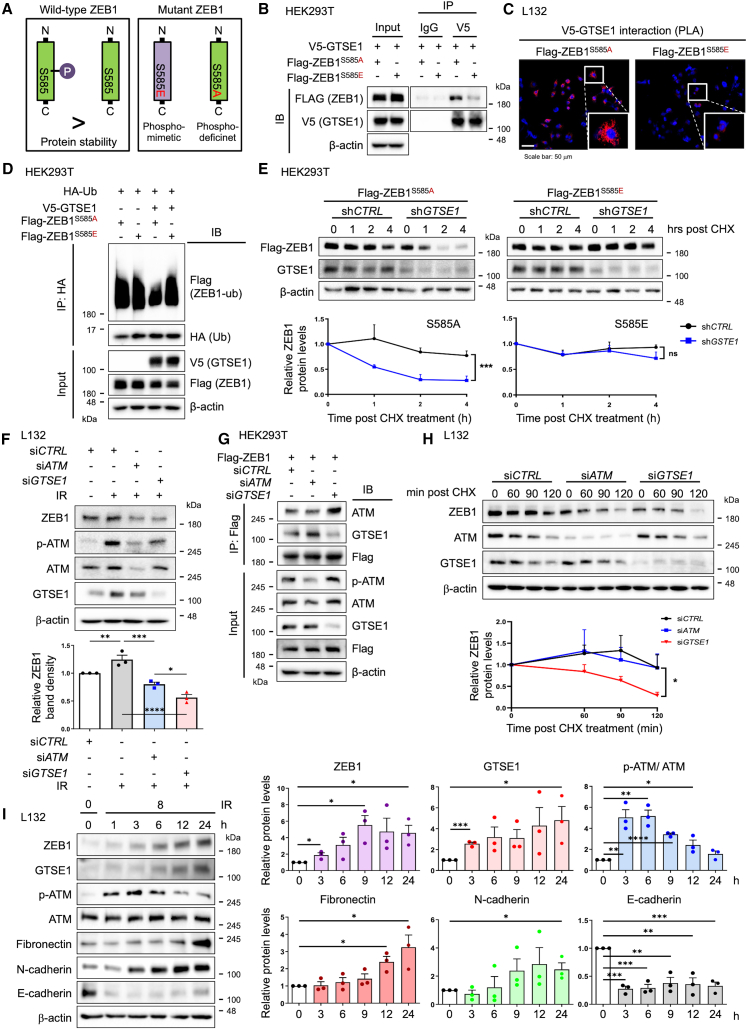
G2 and S phase-expressed protein 1 (GTSE1) has been implicated in the development of pulmonary fibrosis (PF); however, its biological function, molecular mechanism, and potential clinical implications remain unknown. Here, we explored the genomic data of patients with idiopathic PF (IPF) and found that GTSE1 expression is elevated in their lung tissues, but rarely expressed in normal lung tissues. Thus, we explored the biological role and downstream events of GTSE1 using IPF patient tissues and PF mouse models. The comprehensive bioinformatics analyses suggested that the increase of GTSE1 in IPF is linked to the enhanced gene signature for the epithelial-to-mesenchymal transition (EMT), leading us to investigate the potential interaction between GTSE1 and EMT transcription factors. GTSE1 preferentially binds to the less stable form of zinc-finger E-box-binding homeobox 1 (ZEB1), the unphosphorylated form at Ser585, inhibiting ZEB1 degradation. Consistently, the ZEB1 protein level in IPF patient and PF mouse tissues correlates with the GTSE1 protein level and the amount of collagen accumulation, representing fibrosis severity. Collectively, our findings highlight the GTSE1-ZEB1 axis as a novel driver of the pathological EMT characteristic during PF development and progression, supporting further investigation into GTSE1-targeting approaches for PF treatment.

Keywords: GTSE1; IPF; RNA therapeutics; ZEB1; epithelial mesenchymal transition; lipid nanoparticles; protein stability; pulmonary fibrosis; ubiquitin degradation.


Conflict of interest statement

Declaration of interests The authors declare no competing interests.

Figures

None
Graphical abstract
Figure 1
Figure 1
GTSE1 is upregulated in IPF patient tissues (A) Schematic view of comprehensive bioinformatic analyses using IPF patient cohorts (left panels). DEG lists of IPF tissues were obtained from the GEO database and annotated in volcano plots (middle panels); highlighted genes are significantly differentially expressed at a default adjusted p value cutoff (red = upregulated, blue = downregulated). DEG lists were subjected to GSEA to find the significantly enriched gene sets (right panels). FDR-q < 0.05 was used to set the significance threshold. NESs indicate that the genes in the annotated gene sets are enriched in IPF lung tissues (NES >0) or in normal control lung tissues (NES <0). (B) Genes commonly upregulated in fibrotic tissues from three independent IPF patient cohorts. (C) Genes commonly upregulated in IPF patient tissues and BLM-/IR-induced PF mouse models. (D) mRNA levels of GTSE1 in lungs from IPF patients and normal lungs from healthy controls. (E) Masson’s trichrome (MT) staining and IHC staining for GTSE1 in IPF patient tissues and normal lung tissues. Blue patches indicate collagen deposition. The yellow dotted line distinguishes between the zones with strong and weak blue color. (F) Correlation between GTSE1 protein levels and fibrosis severity in IPF patient tissues (normal: n = 24, IPF: n = 24). All graphs indicate the mean ± SEM. The fold change was calculated relative to the control. ∗, ∗∗, ∗∗∗, ∗∗∗∗ indicates p < 0.05, p < 0.01, p < 0.001, p < 0.0001, respectively.
Figure 2
Figure 2
GTSE1 is required for profibrotic phenotypic change in fibroblasts and epithelial cells (A) Western blots for analyzing FMT or (B) EMT markers and (C) IF staining for F-actin in cells transfected with shCTRL or shGTSE1 with or without TGF-β treatment. Small values above each blot reflect the relative intensity of the target proteins normalized to the endogenous control, β-actin. (D and E) Cell migration and fibrotic remodeling of siRNA-transfected cells were assessed with and without TGF-β treatment using (D) wound-healing and (E) gel contraction assays after 24 or 48 h. Results are presented as a fold change of wound closure or gel contraction compared with the original volume. (F) EpCAM (green) was used to identify epithelial adhesion markers co-stained with GTSE1 (red) and α-SMA (violet). All graphs indicate the mean ± SEM (n = 3/group). The fold change was calculated relative to the control. ∗, ∗∗, ∗∗∗, ∗∗∗∗ indicates p < 0.05, p < 0.01, p < 0.001, p < 0.0001, respectively.
Figure 3
Figure 3
GTSE1 interacts with ZEB1, increasing its protein level Western blots showing the EMT-TFs in cells transfected with shCTRL or shGTSE1 with and without (A) IR or (B) TGF-β treatment. Small values above each blot reflect the relative intensity of the target proteins normalized to β-actin. (C) Heatmaps show the protein levels of EMT-TFs in IR-treated L132 and TGF-β-treated HPF cells as a fold change from the naive cell control (left). The IP heatmap (right) shows the GTSE1-binding ratio of EMT-TF proteins as a fold change to the total protein levels. (D) Immunoblots showing the interaction between Flag-tagged GTSE1 and ZEB1 in HEK 293T cells (left) and the interaction between endogenous GTSE1and ZEB1 in L132 cells (right). (E) Immunofluorescence staining for GTSE1 and ZEB1 in L132 cells 24 h after TGF- β treatment. (F) PLA confirms endogenous GTSE1–ZEB1 interactions in cells transfected with shCTRL or shGTSE1 and treated with TGF-β. Interactions with the target proteins are indicated as red dots. Cell nuclei were counterstained with DAPI. Representative fluorescence images (G) from BLM- or IR-induced PF mouse tissues and (H) from IPF patient tissues. (I) Correlation between GTSE1 and ZEB1 expression in IPF patients (Normal: n = 24, IPF: n = 24). All graphs indicate the mean ± SEM. The fold change was calculated relative to the control. ∗, ∗∗, ∗∗∗, ∗∗∗∗ indicates p < 0.05, p < 0.01, p < 0.001, p < 0.0001, respectively.
Figure 4
Figure 4
Increase protein stability of ZEB1 mediates GTSE1-induced EMT (A) RT-PCR in cells transfected with shCTRL or shGTSE1 with and without 8 Gy of IR. Small values above each blot reflect the relative intensity of the target mRNAs normalized to the endogenous control, gapdh. (B) Measurement of ZEB1 protein stability under a protein synthesis blockade from CHX. L132 cells were transfected with shGTSE1 or Flag-GTSE1 and treated with 100 μg/mL CHX for various time periods. The graph shows the relative levels of ZEB1 protein as a fold change from its initial level. (C and D) The extent of ubiquitination of the ZEB1 protein was confirmed by immunoprecipitation and immunoblot analyses. (C) HEK 293T cells transfected with Flag-GTSE1 at 24 h. Cells were treated with 10 μM MG132 for 8 h. (D) siGTSE1 was co-transfected with HA-tagged ubiquitin in HEK 293T cells. (E) CDH1 promoter activity in HEK 293T cells was measured using a luciferase reporter assay after siGTSE1 transfection for 24 h. (F) ChIP assay was performed in GTSE1-deficient L132 cells. The chromatin was immunoprecipitated with an anti-ZEB1 antibody. Each precipitated DNA was analyzed by quantitative PCR using promoter-specific primers for CDH1. (G) Immunoblots for EMT markers and (H) IF staining for F-actin in L132 cells co-transfected with Flag-tagged GTSE1 and siZEB1. (I) Cell migration of GTSE1-deficient L132 cells was assessed using a wound-healing assay after 24 and 48 h, with and without transfection with Flag-tagged ZEB1. Results are presented as a percentage of wound closure compared with the original volume. All graphs indicate the mean ± SEM. The fold change was calculated relative to the control. ∗, ∗∗, ∗∗∗, ∗∗∗∗ indicates p < 0.05, p < 0.01, p < 0.001, p < 0.0001, respectively.
Figure 5
Figure 5
GTSE1 binds to the non-phosphorylated form of ZEB1 and blocks its degradation (A) A diagram illustrating the ZEB1 mutants. The phospho-deficient mutant (S585A) replaces serine 585 with alanine, and the phosphor-mimetic mutant (S585E) replaces serine 585 with aspartic acid. (B) V5-tagged GTSE1 was co-transfected with the Flag-tagged ZEB1 mutant forms in HEK 293T and (C) L132 cells. Phosphorylation of each ZEB1 mutant was analyzed by immunoprecipitation with an anti-V5 agarose affinity gel antibody and detected with a western blot analysis. PLA confirmed the interaction between the V5-tagged GTSE1 and Flag-tagged ZEB1 mutant forms. Interactions with the target proteins are indicated as red dots. Cell nuclei were counterstained with DAPI (blue). (D) Ubiquitination of Flag-tagged ZEB1 was analyzed by immunoprecipitation with an anti-HA agarose affinity gel antibody and detected with a western blot analysis. V5-tagged GTSE1 and the Flag-tagged ZEB1 mutant forms were co-transfected with HA-tagged ubiquitin into HEK 293T cells for 24 h. (E) HEK 293T cells were transfected with Flag-tagged ZEB1 mutant forms and siCTRL or siGTSE1 and treated with 100 μg/mL CHX for various time periods. The graph shows the relative protein levels as a fold change from the initial Flag-tagged ZEB1 protein level. (F) L132 cells were transfected with siCTRL, siATM, or siGTSE1 and exposed to 10 Gy of IR. Protein expression was then analyzed by western blotting. (G) The interaction between Flag-tagged ZEB1 and ATM or GTSE1 was confirmed by immunoprecipitation and immunoblot analyses. Flag-tagged ZEB1 and siATM or siGTSE1 were co-transfected with HEK 293T cells for 24 h. (H) L132 cells were transfected with siCTRL, siATM, or siGTSE1 and treated with 100 μg/mL of CHX for various time periods. The graph shows the relative levels of ZEB1 protein. (I) Immunoblots indicate protein level variations in response to IR. All graphs indicate the mean ± SEM (n = 3/group). The fold change was calculated relative to the control. ∗, ∗∗, ∗∗∗, ∗∗∗∗ indicates p < 0.05, p < 0.01, p < 0.001, p < 0.0001, respectively.
Figure 6
Figure 6
GTSE1-ZEB1 interaction serves as a therapeutic biomarker for monitoring disease status in preclinical models (A) Schematic of the experimental schedule for the in vivo studies (BLM-induced PF model and IR-induced PF model). Mannose LNPs containing siRNA (0.5 mg/kg) were delivered intratracheally twice to assess the effect of Gtse1 silencing in murine PF models. (B) Sirius red staining of collagen in lung tissues from BLM- or IR-induced PF model mice indicates severity of lung fibrosis. (C) Representative immunohistochemistry images of GTSE1 and ZEB1 in mouse lung tissues. Graphs show scores quantifying the target protein-positive area. (D) Correlation between GTSE1or ZEB1 protein expression and the fibrotic area in mouse PF treated with mannose LNPs. (E) Correlation between GTSE1 and ZEB1 expression in mouse PF treated with mannose LNPs. All graphs indicate the mean ± SEM (n = 3/group). The fold change was calculated relative to the control. ∗, ∗∗, and ∗∗∗ indicate p < 0.05, p < 0.01, and p < 0.001, respectively.
Figure 7
Figure 7
Schematic of the proposed mechanism of GTSE1 in IR-induced PF GTSE1 protein levels increase during PF development, and it binds to the relatively unstable form of ZEB1 (non-phosphorylated at S585) and translocates it into the nucleus, hindering its degradation. ZEB1 stabilization by GTSE1 leads to an increase in the EMT signature, driving PF.

References

    1. Zhao M., Wang L., Wang M., Zhou S., Lu Y., Cui H., Racanelli A.C., Zhang L., Ye T., Ding B., et al. Targeting fibrosis: Mechanisms and clinical trials. Signal Transduct. Target. Ther. 2022;7:206. - PMC - PubMed
    1. Richeldi L., Du Bois R.M., Raghu G., Azuma A., Brown K.K., Costabel U., Cottin V., Flaherty K.R., Hansell D.M., Inoue Y., et al. Efficacy and safety of nintedanib in idiopathic pulmonary fibrosis. N. Engl. J. Med. 2014;370:2071–2082. - PubMed
    1. Richeldi L., Azuma A., Cottin V., Hesslinger C., Stowasser S., Valenzuela C., Wijsenbeek M.S., Zoz D.F., Voss F., Maher T.M., 1305-0013 Trial Investigators Trial of a preferential phosphodiesterase 4B inhibitor for idiopathic pulmonary fibrosis. N. Engl. J. Med. 2022;386:2178–2187. - PubMed
    1. Noble P.W., Albera C., Bradford W.Z., Costabel U., Du Bois R.M., Fagan E.A., Fishman R.S., Glaspole I., Glassberg M.K., Lancaster L., et al. Pirfenidone for idiopathic pulmonary fibrosis: analysis of pooled data from three multinational phase 3 trials. Eur. Respir. J. 2016;47:243–253. - PMC - PubMed
    1. Eyres M., Bell J.A., Davies E.R., Fabre A., Alzetani A., Jogai S., Marshall B.G., Johnston D.A., Xu Z., Fletcher S.V., et al. Spatially resolved deconvolution of the fibrotic niche in lung fibrosis. Cell Rep. 2022;40 - PMC - PubMed

MeSH terms

Substances

LinkOut - more resources