. 2024 Nov:77:103370.
doi: 10.1016/j.redox.2024.103370. Epub 2024 Sep 24.

Over-activation of iNKT cells aggravate lung injury in bronchopulmonary dysplasia mice

Affiliations

Over-activation of iNKT cells aggravate lung injury in bronchopulmonary dysplasia mice

Ming-Yan Wang et al. Redox Biol. 2024 Nov.

Abstract

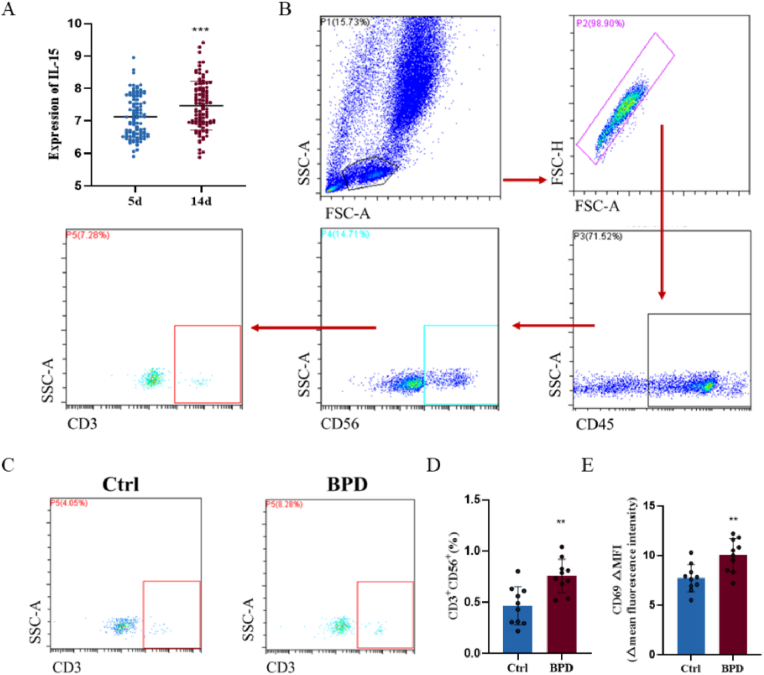
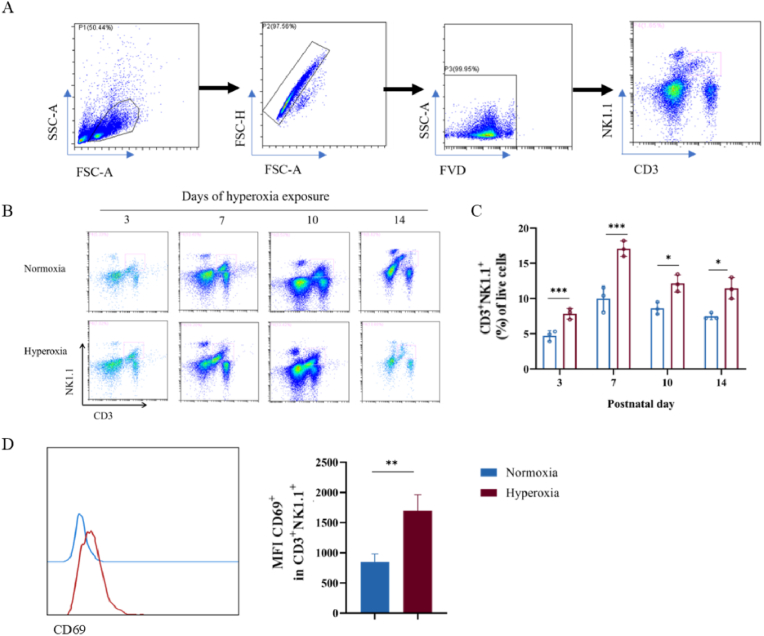
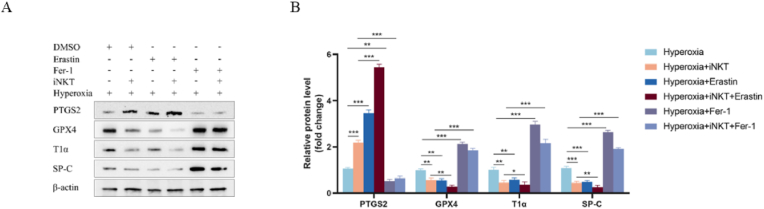
Bronchopulmonary dysplasia (BPD) is a severe lung disease in preterm infants, the abnormal proliferate and differentiate ability of type II epithelial cells (AEC II) is the key to the pathological basis of BPD. Mechanisms regarding abnormal AEC II in BPD remain unclear. The present work investigated the role and mechanisms of invariant natural killer T (iNKT) cells in lung disorder in BPD using public datasets, clinical samples, a hyperoxia-induced BPD mouse model and AEC II-iNKT cells transwell co-culture system. Firstly, we found that the NKT cells development factor IL-15 increased over time in patients with BPD in public databases, and clinically collected peripheral blood NKT cells in patients with BPD were increased. Subsequently, the percentage of iNKT cells increased in hyperoxia group compared with normoxia group, with the highest at P7, accompanied by increased activation with abnormal lung development. The administration of anti-CD1d neutralizing antibody to inhibit iNKT cells could alleviate the abnormal lung development of hyperoxia group mice, while α-GalCer administration could aggravate lung injury in hyperoxia group mice, and adoptive transfer of iNKT cells could aggravate the abnormal lung development in hyperoxia group mice. In addition, to further verify the role of iNKT cells on AEC II, AEC II-iNKT cells co-culture system was established. The presence of iNKT cells could aggravate the abnormal expression of SP-C and T1α under hyperoxia. Meanwhile, RNA-seq analysis showed that ferroptosis-related genes were highly expressed in AEC II co-cultured with iNKT cells under hyperoxia. We further validated the effect of the presence of iNKT cells under hyperoxia environment on AEC II ferroptosis levels, suggested that iNKT cells promote AEC II ferroptosis under hyperoxia, accompanied by decreased expression of SP-C and T1α. Our study found that the recruitment of iNKT cells in the lung may be an important cause of alveolarization disorder in BPD.

Keywords: Alveolar type II epithelial cells; Bronchopulmonary dysplasia; Differentiation; Ferroptosis; Invariant natural killer T cells.


Conflict of interest statement

Declaration of competing interest The authors declare that they have no known competing financial interests or personal relationships that could have appeared to influence the work reported in this paper.

Figures

Image 1
Graphical abstract
Fig. 1
Fig. 1
Characteristics of NKT cells in the blood of healthy controls and patients with BPD A. Analysis of peripheral blood IL-15 expression in the dataset. B. Representative FACS analysis showing the gating strategy used to identify CD45+ CD56+CD3+NKT cells in the peripheral blood. C. Representative results of NKT cells detected by flow cytometry in the peripheral blood of healthy controls and patients with BPD. D. Percentage of NKT cells detected by flow cytometry in the peripheral blood of ten healthy controls and ten patients with BPD. E. CD69 MFI of activation marker of NKT cells relative to isotype controls. (∗∗P<0.01, ∗∗∗P<0.001).
Fig. 2
Fig. 2
BPD mice were constructed, and there were disorders of lung development A. Mouse pups were exposed to normoxia (21 % O2) or hyperoxia (85 % O2) from the day of birth. The body size of normoxia and hyperoxia groups of mice at P3, P7, P10, and P14 was compared. H, hyperoxia; N, normoxia. B. The total number of immune cells in BALF in normoxia and hyperoxia groups of mice at P14. n = 5/group. C. Lung tissues were obtained at P3, P7, P10, and P14. D. Representative tissue sections of lungs by H&E at 21 % O2 or 85 % O2 at P3, P7, P10, and P14. n = 9/group. Scale bar = 50 μm. E. Assessment of lung volume according to Archimedes' principle. Lung morphometry was quantified by RAC and MLI measurements. F. PAS staining was used to evaluate and compare the degree of development between normoxia and hyperoxia at P14. n = 5/group. Scale bar = 50 μm. G. Immunofluorescence detection of SP-C and T1α in lungs of the normoxia and hyperoxia groups lung tissue at P14. n = 5/group. Scale bar = 50 μm. H.WB measured and quantified the protein levels of SP-C and T1α in lungs of the normoxia and hyperoxia groups at P14. n = 5/group. (∗P<0.05, ∗∗∗P<0.001).
Fig. 3
Fig. 3
Hyperoxia exposure increased the number of iNKT cells in the lung and triggered their activation A. Representative FACS analysis showing the gating strategy used to identify FVD CD3+NK1.1+iNKT cells at P3, P7, P10, and P14 in normoxia and hyperoxia groups. B. Representative results of iNKT cells in the lungs of normoxia and hyperoxia groups at P3, P7, P10, and P14. C. Percentage of iNKT cells in the lungs of normoxia and hyperoxia groups at P3, P7, P10, and P14. n = 3/group. D. CD69 MFI of iNKT cells in normoxia and hyperoxia groups at P7. (∗P<0.05, ∗∗P<0.01,∗∗∗P<0.001).
Fig. 4
Fig. 4
Inhibition of iNKT cells activation alleviates abnormal lung development in BPD mice A. Mouse pups were exposed to either room air (21 % O2) or hyperoxia (85 % O2) from the day of birth. anti-CD1d or control IgG were injected at P7-10, BALF analysis and lung tissues were harvested at P14. n = 5/group. B. H&E and PAS show the presentative tissue sections of lungs under different treatment conditions at P14. Scale bar = 50 μm. C. Lung morphometry was quantified by RAC and MLI measurements. Statistical plot of PAS staining to assess the extent of development under different treatments at P14. n = 5/group. D. Comparison of immunofluorescence detection of SP-C and T1α in lung tissues under normoxia group, hyperoxia group, hyperoxia group injected control IgG and hyperoxia group injected anti-CD1d conditions at P14. The proportion of T1α+ SP-C+ cells (% total SP-C+ cells) in immunofluorescence staining was quantified. Scale bar = 50 μm. E. WB was used to detect the protein levels of SP-C and T1α in lung tissue of different groups at P14. Quantitative analysis of WB detection levels. (∗P<0.05, ∗∗P<0.01, ∗∗∗P<0.001).
Fig. 5
Fig. 5
Specific activation of iNKT cells and increased number of iNKT cells aggravate lung disorder in BPD mice A. Mouse pups were exposed to normoxia (21 % O2) or hyperoxia (85 % O2) from the day of birth. α-GalCer or vehicle were used at P7-10, and lung tissues were harvested at P14. n = 5/group. B. H&E and PAS show the presentative tissue sections of lungs under different treatment conditions at P14. n = 5/group. Scale bar = 50 μm. C. Lung morphometry was quantified by RAC and MLI measurements. Statistical plot of glycogen staining to assess the extent of development under different treatments at P14. D. Schematic representation of adoptive transfer of iNKT cells at P10. n = 5/group. iNKT cells was imaged in vivo at 0, 30 min, 12 h and 24 h after adoptive transfer in normoxia group and hyperoxia group mice. E. Comparison of immunofluorescence detection of SP-C and T1α in lung tissues of hyperoxia group, hyperoxia group injected vehicle and hyperoxia group adoptive transfer iNKT cells conditions at P14. The proportion of T1α+ SP-C+ cells (% total SP-C+ cells) in IF staining was quantified. n = 5/group. Scale bar = 50 μm. F. WB was used to detect the protein levels of SP-C and T1α at P14. Quantitative analysis of WB detection levels. G. H&E and PAS show the presentative tissue sections of lungs under different treatment conditions at P14. Scale bar = 50 μm. H. Lung morphometry was quantified by RAC and MLI measurements. Statistical plot of PAS staining to assess the extent of development under different treatments at P14. n = 5/group. (∗P<0.05, ∗∗P<0.01, ∗∗∗P<0.001).
Fig. 6
Fig. 6
AEC II- iNKT cells co-culture and the effect of iNKT cells on AEC II under hyperoxia 72 h A. Giemsa staining showed the morphological characteristics of iNKT cells sorted by magnetic beads. B. Schematic representation of cell grouping and treatment. C. WB analysis of SP-C, T1α protein levels. β-Actin was used as a load Control. D. AEC II immunofluorescence staining. Red fluorescence-labeled T1α, green fluorescence-labeled SP-C, and double-stained cells indicate cells in transdifferentiated state. Scale bar = 20 μm. (∗P<0.05, ∗∗P<0.01, ∗∗∗P<0.001).
Fig. 7
Fig. 7
iNKT cells promote AEC II ferroptosis under hyperoxia A Heat map shows the difference in gene expression between AEC II and AEC II + iNKT cells groups. B. Heat map depicting differential expression of ferroptosis-related genes. C. The mRNA expressions of GPX4, FTH1 and PTGS2 were detected by qRT-PCR. D. The protein expressions of GPX4, FTH1 and PTGS2 were detected by WB. E. Lipid peroxidation levels were measured by C11 bodipy staining. F. The contents of Fe2+ in the epithelium were determined by ELISA. G. The concentration of MDA in cell lysates. H. Cell morphology was observed by transmission electron microscope. scale bar = 1 μm. (∗P<0.05, ∗∗P<0.01, ∗∗∗P<0.001).
Fig. 8
Fig. 8
Ferroptosis relates to decreased SP-C and T1α A-B. The protein expressions of PTGS2,GPX4, T1α, SP-C in each group were detected by WB. (∗∗P<0.01, ∗∗∗P<0.001).

References

    1. Principi N., Di Pietro G.M., Esposito S. Bronchopulmonary dysplasia: clinical aspects and preventive and therapeutic strategies. J. Transl. Med. 2018;16(1):36. - PMC - PubMed
    1. Bancalari E., Jain D. Bronchopulmonary dysplasia: 50 Years after the original description. Neonatology. 2019;115(4):384–391. - PubMed
    1. Hurskainen M., Mizikova I., Cook D.P., et al. Single cell transcriptomic analysis of murine lung development on hyperoxia-induced damage. Nat. Commun. 2021;12(1):1565. - PMC - PubMed
    1. Hogan B.L., Barkauskas C.E., Chapman H.A., et al. Repair and regeneration of the respiratory system: complexity, plasticity, and mechanisms of lung stem cell function. Cell Stem Cell. 2014;15(2):123–138. - PMC - PubMed
    1. Wang Y., Tang Z., Huang H., et al. Pulmonary alveolar type I cell population consists of two distinct subtypes that differ in cell fate. Proc Natl Acad Sci U S A. 2018;115(10):2407–2412. - PMC - PubMed

Publication types

MeSH terms

LinkOut - more resources