. 2024 Nov;300(11):107826.
doi: 10.1016/j.jbc.2024.107826. Epub 2024 Sep 27.

PKC-mediated phosphorylation governs the stability and function of CELF1 as a driver of EMT in breast epithelial cells

Affiliations

PKC-mediated phosphorylation governs the stability and function of CELF1 as a driver of EMT in breast epithelial cells

Shebna Massey et al. J Biol Chem. 2024 Nov.

Abstract

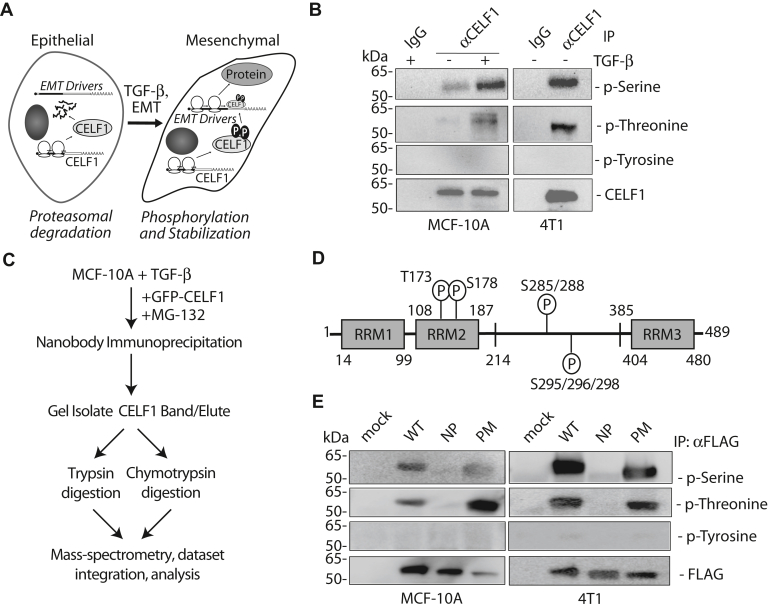
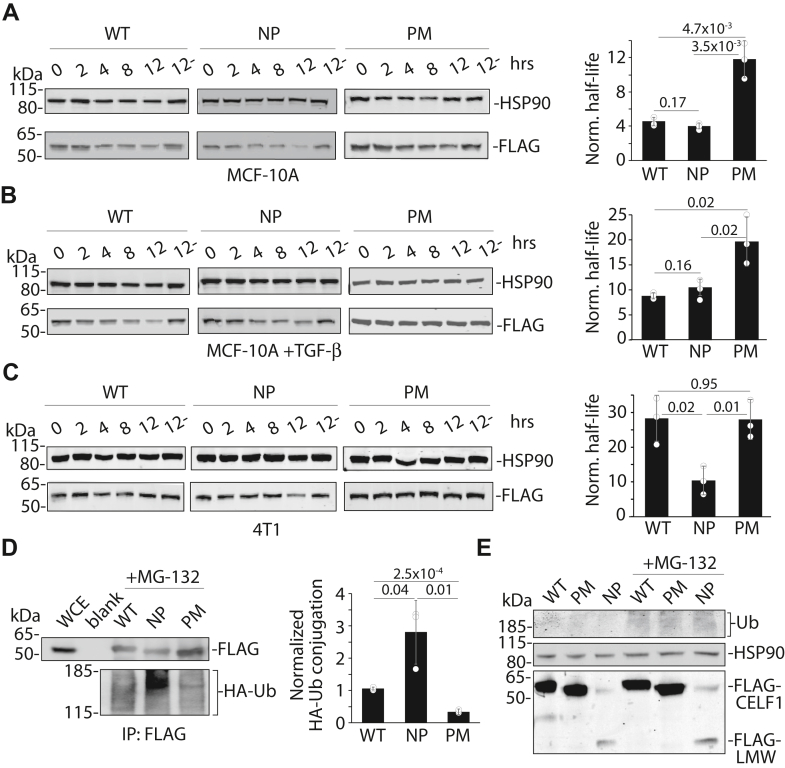
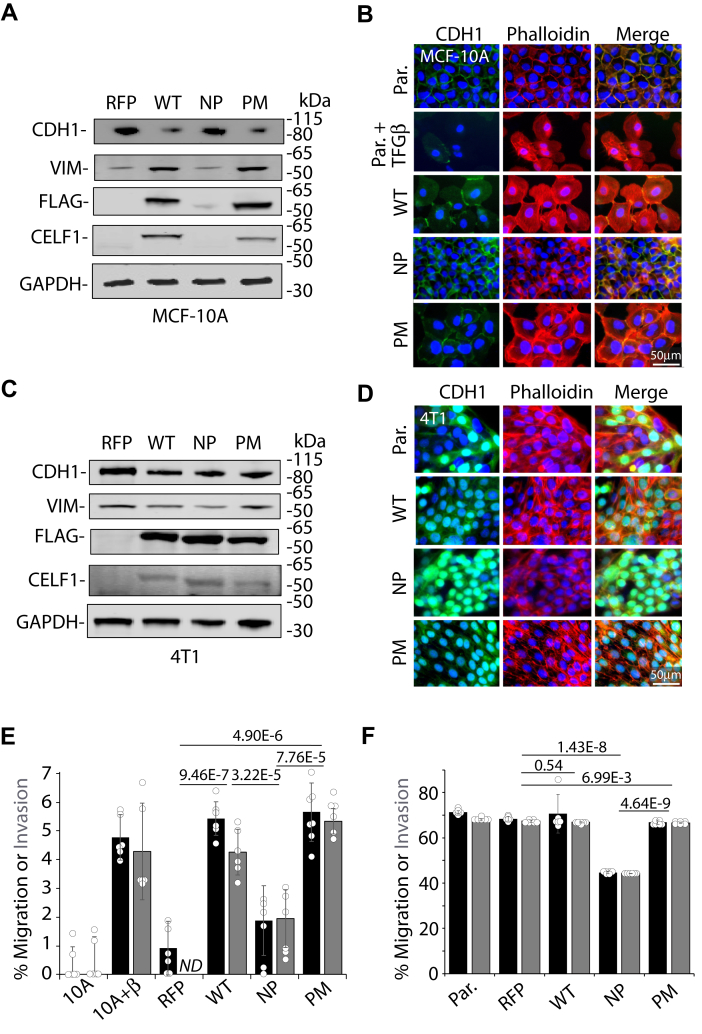
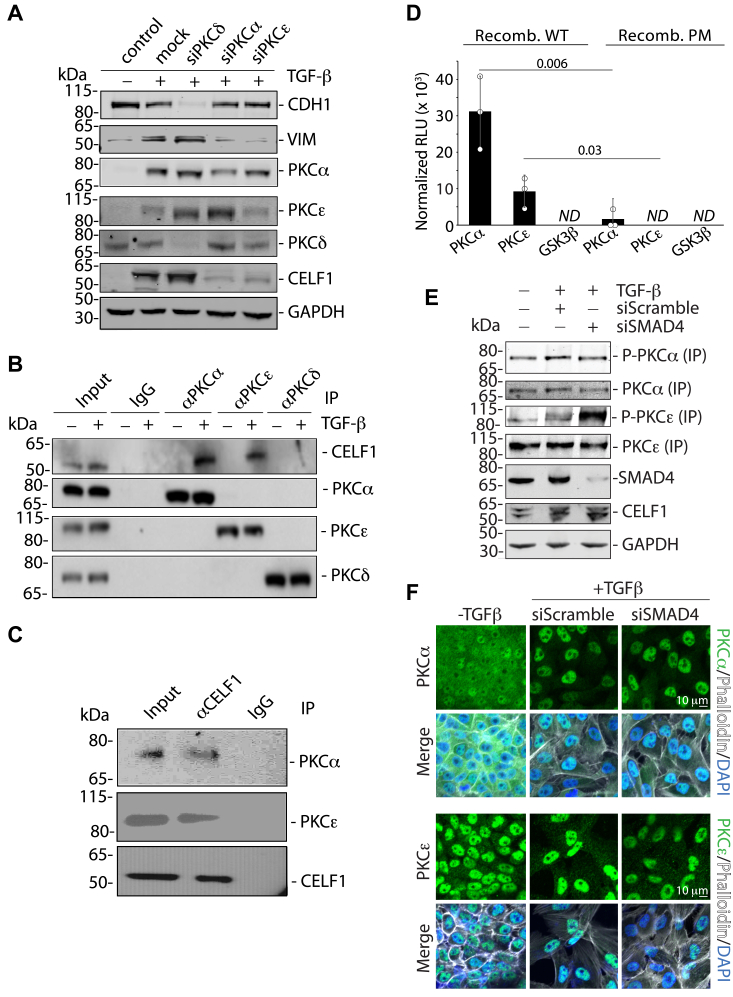
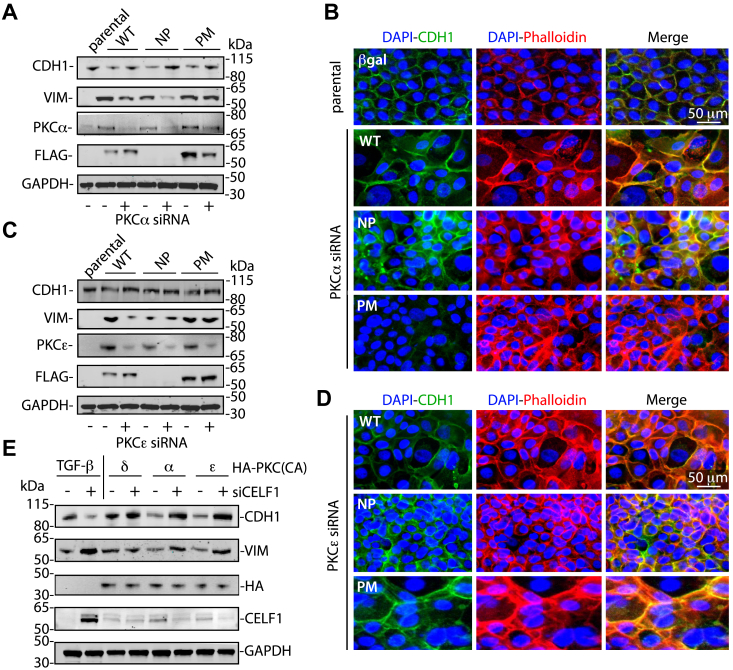
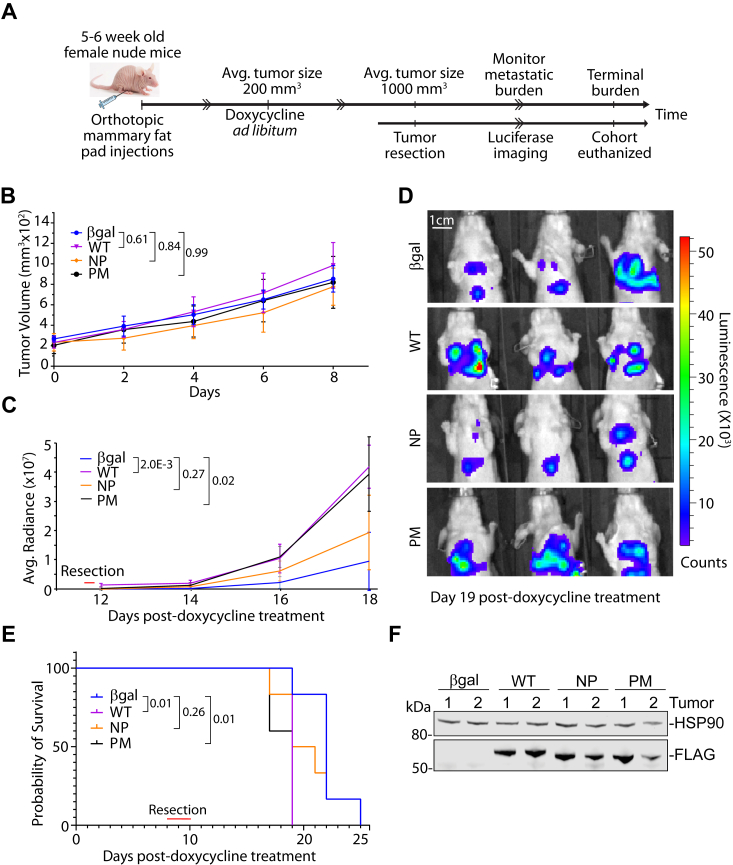
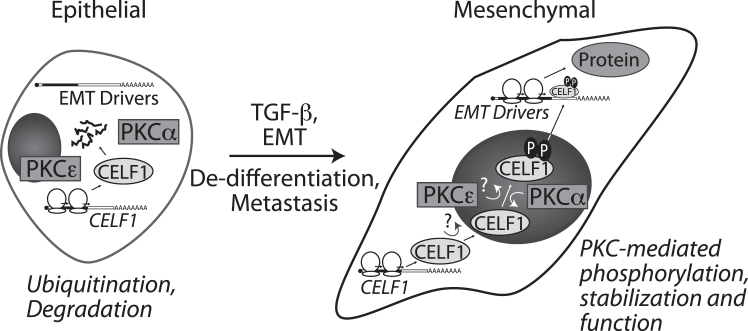
Epithelial to mesenchymal transition (EMT) is believed to be a principal factor contributing to cancer metastasis. The post-transcriptional and post-translational mechanisms underlying EMT are comparatively underexplored. We previously demonstrated that the CELF1 RNA binding protein is necessary and sufficient to drive the EMT of breast epithelial cells, and that the relative protein expression of CELF1 in this context was dictated at the post-translational level. Here, we elucidate the mechanism of this regulation. Mass spectrometric analysis of CELF1 isolated from mesenchymal MCF-10A cells identified multiple sites of serine and threonine phosphorylation on the protein, correlating with the increased stability of this protein in this cellular state. Analysis of phosphomimetic and serine/threonine-to-alanine phosphomutant variants of CELF1 revealed that these phosphorylation sites indeed dictate CELF1 stability, ubiquitination state, and function in vitro. Via co-immunoprecipitation and in vitro kinase assays, we identified the protein kinase C alpha and epsilon isozymes as the kinases responsible for CELF1 phosphorylation in a breast cell line. Genetic epistasis experiments confirmed that these PKCs function upstream of CELF1 in this EMT program, and CELF1 phosphorylation impacts tumor metastasis in a xenograft model. This work is the first to formally establish the mechanisms underlying post-translational control of CELF1 expression and function during EMT of breast epithelial cells. Given the broad dysregulation of CELF1 expression in human breast cancer, our results may ultimately provide knowledge that may be leveraged for novel therapeutic interventions in this context.

Keywords: CELF1; PKCα; PKCε; RNA binding protein; epithelial–mesenchymal transition (EMT); metastasis; post-translational regulation; protein phosphorylation.


Conflict of interest statement

Conflict of interest The authors declare that they have no conflicts of interest with the contents of this article.

Figures

Figure 1
Figure 1
CELF1 phosphorylation in breast and breast cancer cell lines.A, schematic of our previous findings (16). CELF1 is translated but immediately degraded in epithelial MCF-10A cells, becoming stabilized upon TGF-β treatment and transition to the mesenchymal state, where it promotes translation of EMT driver mRNAs. In this state, CELF1 is phosphorylated on serine and threonine residues. B, immunoblot demonstrating the phosphorylation state of endogenous CELF1 immunoprecipitated from the indicated cell lines. MCF-10A cells were treated with 5 ng/ml TGF-β for 72 h prior to collection of whole cell extracts and immunoprecipitation with either anti-CELF1 monoclonal antibody or control murine IgG as indicated. Blots were probed with the indicated antibodies. The CELF1 blot serves as the loading control. C, workflow schematic for mass-spectrometric identification of CELF1 phosphorylation sites. Parallel trypsin and chymotrypsin digestion and integration of the MS data were required to obtain robust coverage of the protein (Fig. S1). D, graphical depiction of serine/threonine phosphorylation sites on CELF1 identified via mass spectrometry. E, immunoblot of FLAG-tagged CELF1 expression constructs stably transduced into the indicated cell lines and induced via treatment with 0.1 μg/ml doxycycline for 72 h. During induction, MCF-10A cells were additionally treated with 5 ng/ml TGF-β for 72 h. Whole cell extracts were immunoprecipitated with anti-FLAG beads and the immunoprecipitate was probed with the indicated antibodies. Anti-FLAG (detecting CELF1) serves as the loading control. WT = wild type, NP = phosphomutant, PM = phosphomimetic. Figure 1, B and E representative of a minimum of three experimental replicates.
Figure 2
Figure 2
CELF1’s phosphorylation sites confer altered stability and sensitivity to ubiquitination. Immunoblots (anti-FLAG, left) and densitometric analysis (right) of the half-lives of the wild-type (WT), phosphomutant (NP), and phosphomimetic (NP) CELF1 expression constructs following treatment with 20 μg/ml cycloheximide (CHX) at the indicated timepoints (hours) in (A) untreated MCF-10A cells, (B) MCF-10A cells treated with 5 ng/ml TGF-β for 72 h and (C) 4T1 cells. A-C, For densitometric analysis, relative expression was calculated by normalizing FLAG signal to the HSP90 loading control, and then calculated as a function of normalized expression at the 0 h time point. The 12- indicates non-CHX treated control. Half-life was calculated as ln (2)/k. D, immunoblot (left) and densitometric analysis (right) of FLAG immunoprecipitates from whole cell extracts derived from HEK293T cells transiently co-transfected with expression constructs encoding HA-tagged ubiquitin and the indicated FLAG-tagged CELF1 variants. Twenty-four hours following transfection, the transfectants were treated with 20 μM MG132 for 8 h and harvested. Densitometric analysis of HA-Ub signal is normalized to each unmodified parent protein (right). Blank = buffer blank in lane. E, immunoblot of steady state expression of the indicated CELF1 rescue constructs in whole cell extracts of non-TGF-β-treated (epithelial) MCF-10A sublines incubated with 20 μM MG132 for 8 h. The ubiquitin (Ub) blot serves as a positive control for the potency of the MG132, and the HSP90 blot serves as a loading control. LMW = low molecular weight. The faint band migrating just under 50 kDa in the leftmost two lanes of the FLAG blot was not consistently observed. In all experiments, construct expression was induced via inclusion of 0.1 μg/ml doxycycline for 24 h prior to the indicated starting point. p-values from Student’s two-tailed t test indicated. Error bars indicate standard deviation. All immunoblots were quantified using ImageJ software, all figures are representative of a minimum of three experimental replicates.
Figure 3
Figure 3
CELF1’s phosphorylation sites impact CELF1’s efficacy in promoting the mesenchymal state.A, immunoblot of epithelial (CDH1) and mesenchymal (VIM) markers upon induction of wild-type (WT), phosphomutant (NP) and phosphomimetic (PM) CELF1 in stably transduced MCF-10A cells via induction with 0.1 μg/ml doxycycline for 72 h. B, immunofluorescence of E-cadherin (CDH1, green) and actin (Phalloidin, red) subcellular distribution upon induction of the indicated CELF1 variants, again using 0.1 μg/ml doxycycline for 72 h. DAPI nuclear counterstain is blue. E-cadherin and phalloidin distribution in untreated and TGF-β-treated (72 h) non-transduced parental cell lines are presented for reference. C, as (A), with induced expression of indicated variants in 4T1 cells. D, as (B), with induced expression of indicated variants in 4T1 cells. Again, the non-transduced parental cell (Par.) is presented for reference. E, transwell migration (black bars) and invasion (grey bars) in MCF-10A cells following induction of indicated CELF1 variants (0.1 μg/ml doxycycline) or for TGF- β treatment (5 ng/ml – positive control) for 72 h. RFP indicates cells stably transduced with a vector encoding inducible RFP and a control shRNA targeting β-galactosidase. Values normalized to untreated parental MCF-10A cells. F, as (E), with induction via 0.1 μg/ml doxycycline in 4T1 cells. Here the values represent the percent migration and invasion for each group. In (E and F), p-values from Student’s two-tailed t test indicated, the value shown represents the larger p-value of the two independent comparisons of migration and invasion. Error bars represent standard deviation. ND = not detected above baseline. All data representative of a minimum of three experimental replicates.
Figure 4
Figure 4
PKCα and PKCε associate with CELF1 in cellular extracts and directly phosphorylate CELF1 in vitro.A, immunoblots showing relative expression of E-cadherin (CDH1), Vimentin (VIM), PKCα, PKC δ (specificity control), PKC ε, and CELF1 (all endogenous) following siRNA mediated knockdown of the indicated gene products and TGF-β treatment (5 ng/ml) of MCF-10A cells for 72 h. GAPDH is a loading control. B, immunoblot analysis of immunoprecipitations using the indicated antibodies from TGF-β-treated (as above) MCF-10A cytoplasmic extracts. C, immunoblot analysis of anti-CELF1 immunoprecipitations from TGF-β-treated (as above) MCF-10A cytoplasmic extracts. D, in vitro kinase assay using recombinant wild-type (WT) or phosphomimetic (PM) as substrate. GSK3β is included as a specificity control. Relative Light Units (RLU) normalized to standardized positive control from Promega (Cat. TM313). p-values from Student’s two-tailed t test indicated. Error bars denote standard deviation. ND = not detected above baseline. E, immunoblot analysis of an activating phosphorylation mark on PKCα and PKCε, both immunoprecipitated from untreated MCF-10A cells or cells transfected with 20 nM of the indicated siRNAs and then treated with TGF-β (5 ng/ml) for 72 h. Immunoblots of relative SMAD4, CELF1, and GAPDH (loading control) expression within the corresponding whole cell extracts is also shown. F, confocal immunofluorescence analysis (Nikon A1) of the subcellular localization of PKCα (green, top) and PKCε (green, bottom) in untreated MCF-10A cells or cells transfected with 20 nM of the indicated siRNAs and then treated with TGF-β (5 ng/ml) for 72 h. The cells are stained with Phalloidin (white pseudocolor) and DAPI (blue) for contextual visualization. All results are representative of a minimum of three experimental replicates. For experiments employing RNAi knockdown (A, E and F), the results are representative of a minimum number of three experimental replicates using each of two distinct siRNAs for each gene target.
Figure 5
Figure 5
PKC knockdown does not impact CELF1’s ability to drive EMT in MCF-10A cells.A, immunoblot of epithelial (CDH1) and mesenchymal (VIM) markers upon knockdown of PKCα with of siRNA, followed by induction of wild-type (WT), phosphomutant (NP) and phosphomimetic (PM) CELF1 with 0.1 μg/ml doxycycline for 72 h in stably transduced MCF-10A cells. B, Immunofluorescence of E-cadherin (CDH1, green) and actin (Phalloidin, red) subcellular distribution upon siRNA-mediated knockdown of PKCα followed by induction (as above) of the indicated CELF1 variants, DAPI nuclear counterstain is blue. C, as (A), knocking down PKCε rather than PKCα. D, as (B), again knocking down PKCε rather than PKCα. GAPDH serves as loading control for (A and C), while parental epithelial (non-TGF-β-treated) parental MCF-10A cells. E, immunoblot of epithelial and mesenchymal markers 72 h post-co-transfection of MCF-10A cells with the indicated HA-tagged catalytically active PKC mutants and 20 nM control siRNAs or siRNAs targeting endogenous CELF1. All figures representative of a minimum of three experimental repeats with each of two distinct siRNAs for each gene target.
Figure 6
Figure 6
CELF1 stability increases metastatic potential of primary tumors.A, schematic of experimental strategy. B, kinetics of growth of primary tumors initiated with the indicated inducible 4T1 sublines, following induction of CELF1 knockdown/rescue with the indicated CELF1 variant via 200 μg/ml doxycycline in drinking water provided ad libitum (n = 6 per group). Adjusted p-values from a Two-way ANOVA followed by Tukey’s test for multiple comparisons are indicated, error bars depict standard deviation. C, average radiance of lung metastases at indicated days post-induction. Indicated p-values derived from Student’s two-tailed t test of radiance on Day 18 for each indicated comparison, error bars depict standard deviation. D, Representative bioluminescence images in mice following primary tumor resection, 19 days post-induction. E, Kaplan-Meier plot of survival for each cohort following induction. The endpoint was humane euthanasia under the standard criteria of body score and labored breathing. p-values derived from Mantel-Cox Log-rank test for each indicated comparison. F, relative expression of CELF1 variant expression in representative primary tumors.
Figure 7
Figure 7
Working model for CELF1 regulation via phosphorylation by PKCα and ε in breast epithelial EMT and metastasis. Our data support a model in which TGF-β stimulation of breast epithelial cells results in a SMAD4-independent re-localization of PKCα to the nucleus concomitant with phosphorylation and stabilization of CELF1. Given the strong nuclear localization of PKCα in TGF-β-treated cells, it is likely that PKCα phosphorylates CELF1 occurs in the nucleus. PKCε′s site of action is less clear given that it is localized both to the nucleus and cytoplasm in both the epithelial and mesenchymal states. Ultimately though, our data strongly support the notion that phosphorylation of CELF1 protein by PKCα and PKCε is a licensing event that confers stability upon CELF1 and engenders the ability of this protein to facilitate the translation of EMT driver RNAs, thereby promoting and maintaining the mesenchymal/de-differentiated state.

References

    1. Chen T., You Y., Jiang H., Wang Z.Z. Epithelial-mesenchymal transition (EMT): a biological process in the development, stem cell differentiation, and tumorigenesis. J. Cell Physiol. 2017;232:3261–3272. - PMC - PubMed
    1. Nieto M.A. The ins and outs of the epithelial to mesenchymal transition in health and disease. Annu. Rev. Cell Dev. Biol. 2011;27:347–376. - PubMed
    1. Ribatti D., Tamma R., Annese T. Epithelial-mesenchymal transition in cancer: a historical overview. Transl. Oncol. 2020;13 - PMC - PubMed
    1. Thiery J.P., Acloque H., Huang R.Y., Nieto M.A. Epithelial-mesenchymal transitions in development and disease. Cell. 2009;139:871–890. - PubMed
    1. Hanahan D. Hallmarks of cancer: new dimensions. Cancer Discov. 2022;12:31–46. - PubMed

Publication types

LinkOut - more resources