. 2024 Sep 29;15(9):695.
doi: 10.1038/s41419-024-07098-3.

ACSL4-mediated lipid rafts prevent membrane rupture and inhibit immunogenic cell death in melanoma

Affiliations

ACSL4-mediated lipid rafts prevent membrane rupture and inhibit immunogenic cell death in melanoma

Xi Zhao et al. Cell Death Dis. .

Abstract

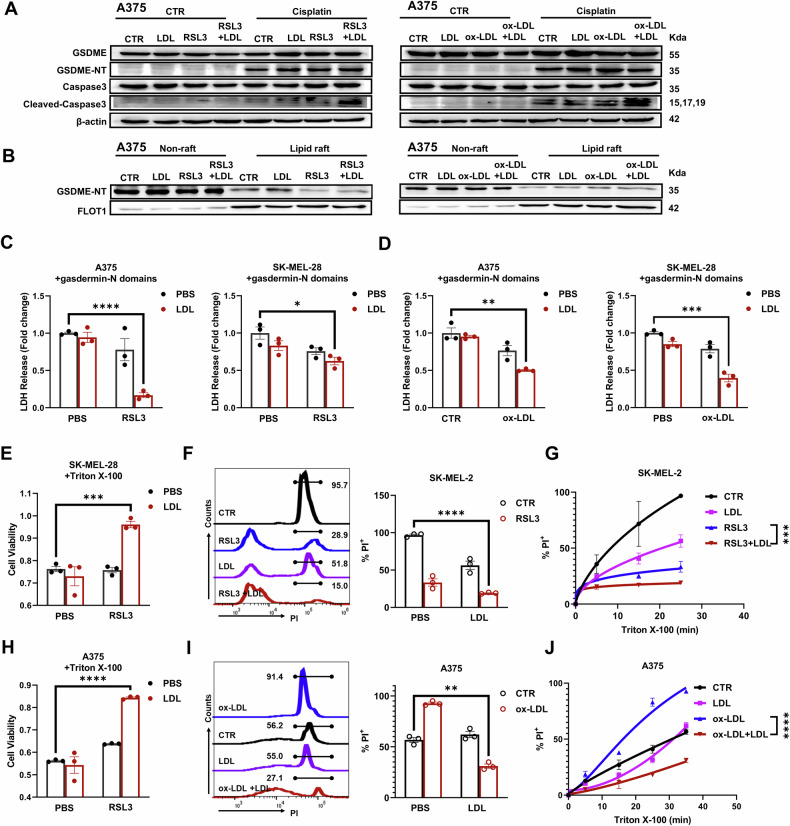
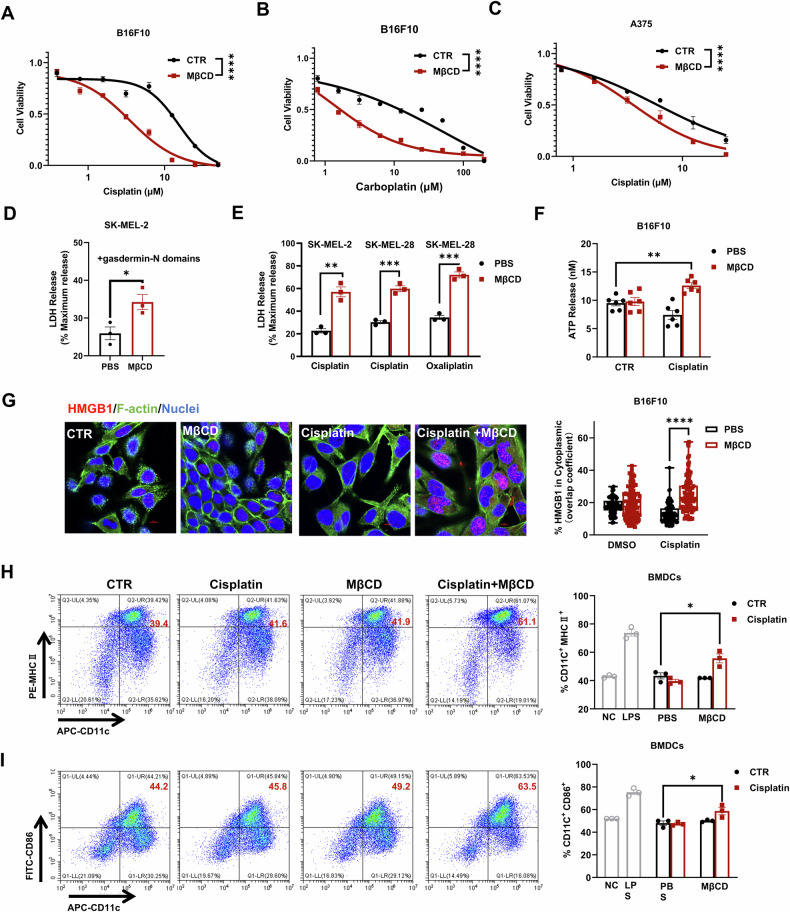
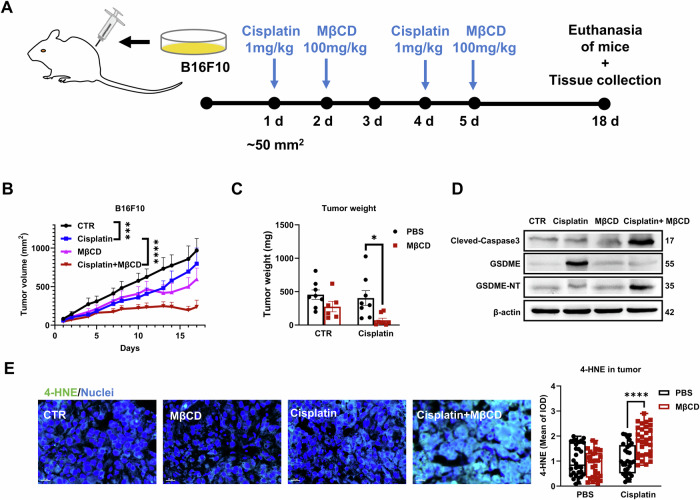
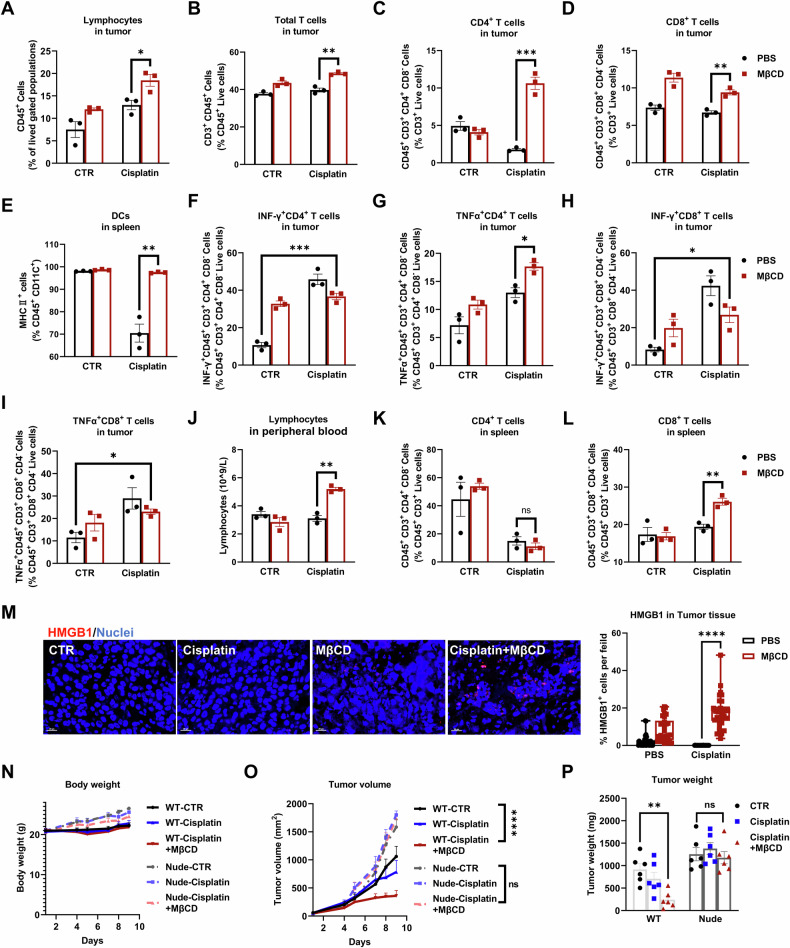
Chemotherapy including platinum-based drugs are a possible strategy to enhance the immune response in advanced melanoma patients who are resistant to immune checkpoint blockade (ICB) therapy. However, the immune-boosting effects of these drugs are a subject of controversy, and their impact on the tumor microenvironment are poorly understood. In this study, we discovered that lipid peroxidation (LPO) promotes the formation of lipid rafts in the membrane, which mediated by Acyl-CoA Synthetase Long Chain Family Member 4 (ACSL4) impairs the sensitivity of melanoma cells to platinum-based drugs. This reduction primarily occurs through the inhibition of immunogenic ferroptosis and pyroptosis by reducing cell membrane pore formation. By disrupting ACSL4-mediaged lipid rafts via the removal of membrane cholesterol, we promoted immunogenic cell death, transformed the immunosuppressive environment, and improved the antitumor effectiveness of platinum-based drugs and immune response. This disruption also helped reverse the decrease in CD8+ T cells while maintaining their ability to secrete cytokines. Our results reveal that ACSL4-dependent LPO is a key regulator of lipid rafts formation and antitumor immunity, and that disrupting lipid rafts has the potential to enhance platinum-based drug-induced immunogenic ferroptosis and pyroptosis in melanoma. This novel strategy may augment the antitumor immunity of platinum-based therapy and further complement ICB therapy.


Conflict of interest statement

The authors declare no competing interests.

Figures

Fig. 1
Fig. 1. Higher levels of lipid rafts correlate with worse survival in melanoma.
AC Among the 32 types of cancer, the top 10 cancers with amplification alteration frequencies were FLOT1, CAV1, and CAV2. D Higher levels of FLOT1 (lipid raft) expression correlate with worse survival in melanoma cancer patients. Log-rank P value for Kaplan‒Meier plot showing results from analysis of correlation between protein expression level and patient survival. AD Large-scale cancer genomics data sets were mined from TCGA and visualized by cBioPortal.
Fig. 2
Fig. 2. ACSL4 is required for LPO to induce lipid rafts formation.
A A simple diagram illustrating the process by which cholesterol promotes the formation of lipid rafts in an oxidative environment. B Effect of ox-LDL (20 μg/mL) on lipid rafts in A375 cells. Scale bars = 10 μm. C Effect of LDL (40 μg/mL) on the LPO assayed by C11-BODIPY in RSL3-treated A375 cells. The results are derived from 3 independent replicates. D Dependence of lipid rafts on the RSL3 concentration in A375 cells. Scale bars = 10 μm. E Principal component analysis (PCA) of lipidomics shows slight separation of the RLS3 and RL groups. F Lipidomics analysis of A375 cells treated with RSL3 (2 μM) or RSL3 plus LDL (40 μg/mL) for 24 h. The heatmap shows that LDL does not decrease oxidized phospholipids and sphingomyelin. Measurements were performed with 5 replicates. G. PCA of transcriptomics. H, I Volcano plot showing the changes in gene expression in A375 cells treated with RSL3 (2 μM) or RSL3 plus LDL (40 μg/mL). Padjusted < 0.05 and FC < 0.5 or >2 were considered significant changes (red dots). No significant differences were black. Statistical significance was assessed using DESeq2. P-adjusted < 0.05 was considered statistically significant (H, I). J, K Effect of LIP-1 (2 μM, J) and DFO (50 μM, K) on lipid rafts. L Correlation between CAV1 and LPO-related genes, including GPX4, CHAC1, ACSL3, ACSL4, LDLR and LDLRAP1, in 40 types of cancer from TIMER 2.0 [41]. M Effect of rosiglitazone (ROSI, 50 μM) on lipid rafts in A375 cells. N Lipid peroxidation in A375 cells treated with DMSO, RSL3, or ROSI (50 μM). D, J, K, MN Each data point represents an individual cell, with ~50–100 cells randomly counted for statistical analysis. O Effect of ACSL4KO on lipid rafts in MEFs. Each data point represents an independent repeat. P A schematic diagram illustrating that cholesterol and PUFAs jointly induce lipid rafts in an ACSL4-dependent manner. Statistical significance was assessed using two-way ANOVA (C) or an unpaired two-tailed t test (D, J, K, MO).
Fig. 3
Fig. 3. ACSL4-dependent LPO confers resistance to platinum-based drugs in melanoma cells.
AE Changes in A375 or SK-MEL-2 cell sensitivity to platinum-based drugs after RSL3 or RSL3 plus LDL (40 μg/mL) or ox-LDL (20 μg/mL) plus LDL treatment for 24 h. F Evaluation of the drug tolerance rate toward cisplatin in A375 cells treated with RSL3 (2 μM) or RSL3 plus LDL (40 μg/mL) for the indicated times. AF The results are derived from 3 independent replicates. G Time evolution of lipid rafts in A375 cells after treatment with LDL and RSL3 for acquiring lipid rafts. Each data point represents an individual cell. Each data point represents an individual cell, with about 100 cells randomly counted for statistical analysis. H Role of ACSL4 siRNA in the drug resistance of A375 cells to cisplatin (25 μM) after 24 h of treatment with RSL3 (2 μM) or RSL3 plus LDL (40 μg/mL). The results are derived from 3 independent replicates. I The dose-dependent cytotoxicity of cisplatin on vehicle-treated xenograft-derived B16F10 cells or ML210-treated cells. Each data point represents an independent repeat. Statistical significance was assessed using two-way ANOVA (AE, I) or an unpaired two-tailed t test (G, H).
Fig. 4
Fig. 4. Lipid rafts reduce the efficacy of platinum-based drugs by inhibiting ferroptosis and pyroptosis in melanoma cells.
A Representative images of inverted phase-contrast microscopy of pyrolytic A375 cells. The red triangle indicates that the cell is undergoing pyroptosis. Scale bars = 50 μm. B Cisplatin induces the activation of GSDME and caspase 3 in A375 and SK-MEL-2 cells, as measured by Western blotting. C Cisplatin, oxaliplatin, and carboplatin induced LDH release in A375 cells. D LIP-1 (2 μM) suppresses MDA content (measured by TBARS assay) triggered by cisplatin in A375 cells. E LIP-1 (2 μM) desensitizes A375 cells to cisplatin. F, G Changes in A375 cell sensitivity to RSL3 after the indicated pretreatment (LDL 40 μg/mL, ox-LDL 20 μg/mL, RLS3 2 μM, treated for 24 h). H Changes in LDH release induced by cisplatin or carboplatin after the indicated pretreatment in melanoma cell lines. I, K Decreased LDH release in A375 cells derived from ML210-treated xenografts. Time evolution of A375 cell sensitivity to gasdermin-N domain overexpression-induced pyroptosis (J) or RSL3-induced ferroptosis (L) after the indicated pretreatment. C, D, HK Each data point represents an independent repeat. EG, L The results are derived from 3 independent replicates. Statistical significance was assessed using two-way ANOVA (EG, L) or an unpaired two-tailed t test (C, D, HK).
Fig. 5
Fig. 5. Lipid rafts suppress pyroptosis by reducing membrane pore formation.
A RSL3 and LDL have no effect on cisplatin-induced activation of GSDME and caspase 3 in A375 cells, as measured by Western blotting. B The GSDME-N domain (membrane pore-forming protein) was enriched more in the nonraft domains than in the raft domains. C, D Decreased LDH release induced by gasdermin-N domain overexpression in cells pretreated with RSL3 plus LDL or ox-LDL plus LDL. Cell viability of SK-MEL-28 cells (E) or A375 cells (H) with the indicated pretreatment following Triton X-100 treatment. PI intensity and positive rate of SK-MEL-2 cells (F) or A375 cells (I) with the indicated pretreatment following Triton X-100 treatment examined by flow cytometry. Time-dependent membrane damage of Triton X-100 in SK-MEL-2 cells (G) or A375 cells (J) with the indicated pretreatment. CF, H, I Each data point represents an independent repeat. G, J The results are derived from 3 independent replicates. Statistical significance was assessed using two-way ANOVA (G, J) or an unpaired two-tailed t test (CF, H, I).
Fig. 6
Fig. 6. Lipid rafts are a promising target to enhance the immunogenicity of platinum-based drugs in vitro.
Effect of MβCD on B16F10 (A, B) or A375 (C) cell sensitivity to cisplatin (A, C) or carboplatin (B). The results are derived from 3 independent replicates. Effect of MβCD on GSDME-NT overexpression-induced LDH release (D) or platinum-based drug-induced LDH release (E) in melanoma cells. F Effect of MβCD on cisplatin-induced LDH release in SK-MEL-2 cells. E Effect of MβCD on A375 cell sensitivity to cisplatin. F ATP release from B16F10 cells treated as indicated. G HMGB1 (red) translation from the nucleus to the cytoplasm was examined by immunofluorescence. Blue indicates DAPI-stained nuclei, green indicates phalloidin-stained F-actin. Scale bars = 10 μm. H, I B16F10 cells treated with the indicated treatments induce the maturation of BMDCs. LPS (100 ng/mL) was used as a positive control. DF, H, I Each data point represents an independent repeat. G Each data point represents an individual cell. with ~100 cells randomly counted for statistical analysis. Statistical significance was assessed using two-way ANOVA (AC) or an unpaired two-tailed t test (DI).
Fig. 7
Fig. 7. MβCD disrupting lipid rafts enhances ferroptosis and pyroptosis induced by cisplatin in vivo.
A Schematic of tumor model establishment and subsequent treatment. B, C Growth curve and tumor weight of B16F10 xenografts with the indicated treatments. CTR = 8, MβCD = 6, Cisplatin = 8, MβCD + Cisplatin = 8. The weight of xenografts was obtained at the end of the indicated treatments. Each data point represents an individual xenograft tumor. D GSDME, GSDME-NT, and cleaved-caspase 3 protein analyzed by western blotting in B16F10 xenografts treated as indicated. E Immunofluorescence staining and quantification of 4-HNE-modified proteins (green) in paraffin-embedded xenografts at the end of the indicated treatment. Each data point represents a random field of view, with 5 tumor samples randomly selected per group. 3 slices was prepared from each tumor, spaced 50 μm apart, with a thickness of 5 μm. Two random fields of view were counted per slice. Blue indicates DAPI-stained nuclei. Scale bars = 20 μm. Statistical significance was assessed using two-way ANOVA (B) or an unpaired two-tailed t test (C, E).
Fig. 8
Fig. 8. MβCD disrupting lipid rafts mediate T-cell activation against cisplatin-treated melanoma.
AD Infiltrating lymphocytes in xenografts at the end of the indicated treatment. E Percentages of MHCII+ DCs in the spleens of B16F10 xenografted mice with the indicated treatments. FI Percentages of IFNγ+CD4+ (F), TNFα+CD4+ (G), IFNγ+CD8+ (H) or TNFα+CD8+ (I) T cells in B16F10 xenografts. J Lymphocyte counts in peripheral blood in B16F10 xenografted mice at the end of the indicated treatment. K, L Percentages of CD4+ or CD8+ T cells in the spleens of B16F10 xenografted mice with the indicated treatments. M Immunofluorescence staining and quantification of HMGB1 (red) in paraffin-embedded xenografts at the end of the indicated treatment. Blue indicates DAPI-stained nuclei. Scale bars = 20 μm. Each data point represents a random field of view, with 5 tumor samples randomly selected per group. 3 slices were prepared from each tumor, spaced 50 μm apart, with a thickness of 5 μm. Two random fields of view were counted per slice. N Weights of nude and wild-type mice with B16F10 xenografts with different treatments at different time points (days). O, P Growth curve and tumor weight of B16F10 xenografts in nude and wild-type mice with the indicated treatments. The weight of xenografts was obtained at the end of the indicated treatments. Each data point represents an individual xenograft tumor, each group consisted of 6 mice. AL Each data point represents a tumor sample, 3 per group used for flow cytometric analysis. Statistical significance was assessed using two-way ANOVA (O) or an unpaired two-tailed t test (AM, P).

Similar articles

Cited by

References

    1. Michielin O, van Akkooi ACJ, Ascierto PA, Dummer R, Keilholz U.ESMO Guidelines Committee Cutaneous melanoma: ESMO Clinical Practice Guidelines for diagnosis, treatment and follow-up†. Ann Oncol. 2019;30:1884–901. - PubMed
    1. Ribas A, Hamid O, Daud A, Hodi FS, Wolchok JD, Kefford R, et al. Association of pembrolizumab with tumor response and survival among patients with advanced melanoma. JAMA. 2016;315:1600–9. - PubMed
    1. Pires da Silva I, Ahmed T, Reijers ILM, Weppler AM, Betof Warner A, Patrinely JR, et al. Ipilimumab alone or ipilimumab plus anti-PD-1 therapy in patients with metastatic melanoma resistant to anti-PD-(L)1 monotherapy: a multicentre, retrospective, cohort study. Lancet Oncol. 2021;22:836–47. - PubMed
    1. Zimmer L, Apuri S, Eroglu Z, Kottschade LA, Forschner A, Gutzmer R, et al. Ipilimumab alone or in combination with nivolumab after progression on anti-PD-1 therapy in advanced melanoma. Eur J Cancer. 2017;75:47–55. - PubMed
    1. Hegde PS, Chen DS. Top 10 challenges in cancer immunotherapy. Immunity. 2020;52:17–35. - PubMed