. 2024 Sep 29;43(10):246.
doi: 10.1007/s00299-024-03328-2.

A missense mutation in the barley Xan-h gene encoding the Mg-chelatase subunit I leads to a viable pale green line with reduced daily transpiration rate

Affiliations

A missense mutation in the barley Xan-h gene encoding the Mg-chelatase subunit I leads to a viable pale green line with reduced daily transpiration rate

Andrea Persello et al. Plant Cell Rep. .

Abstract

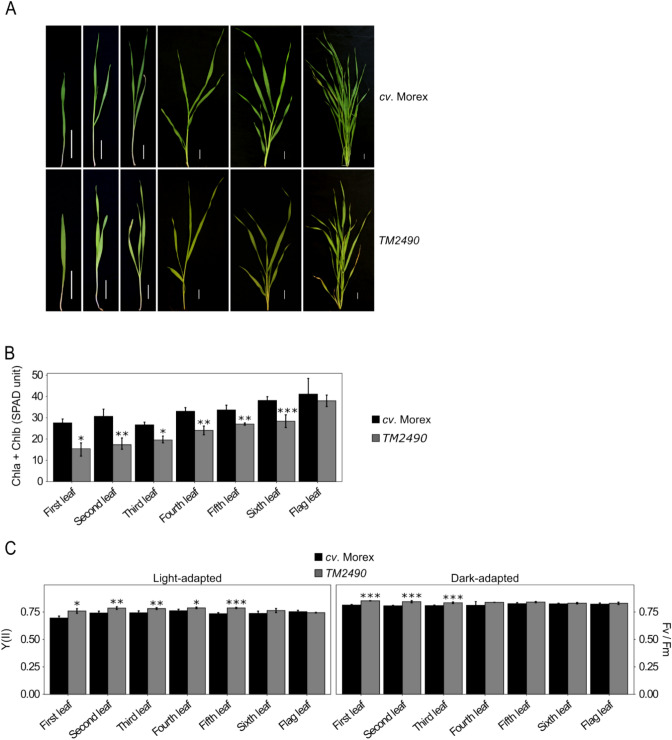
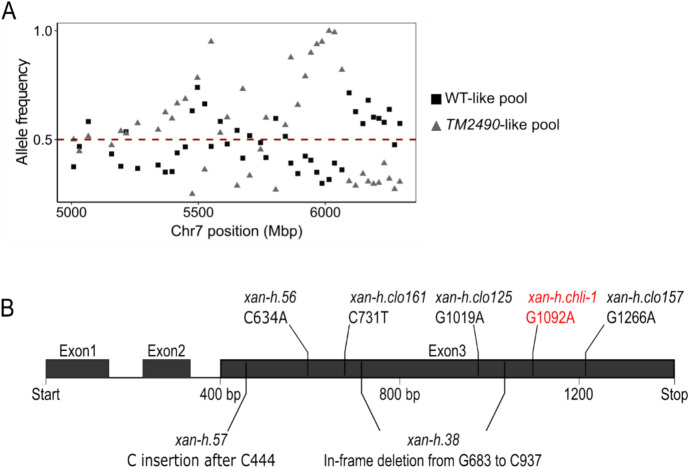
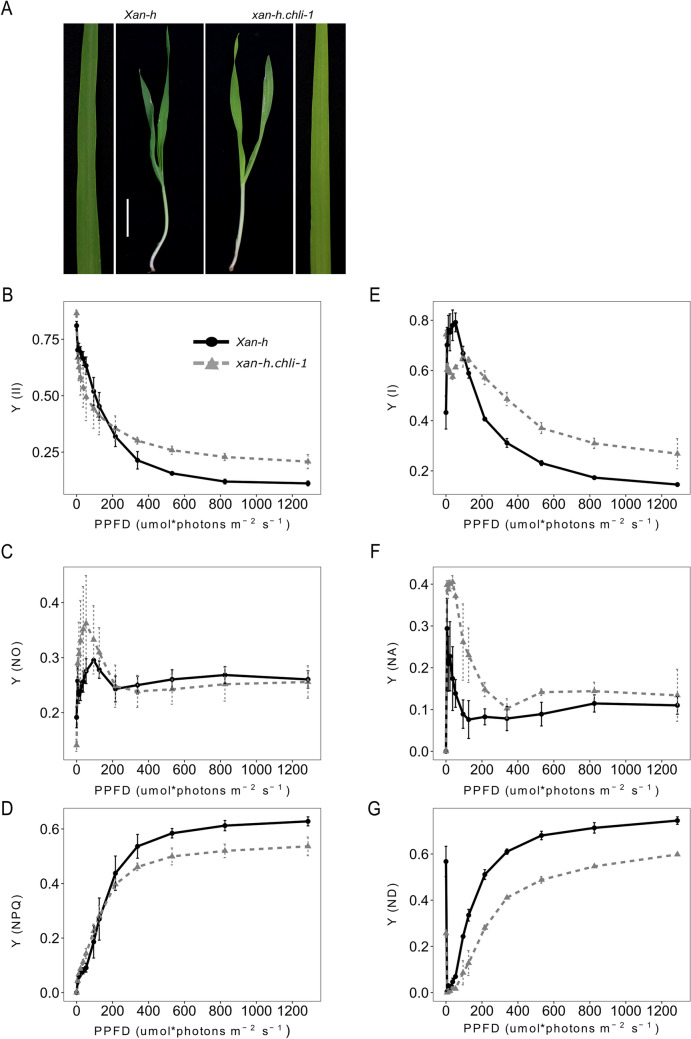
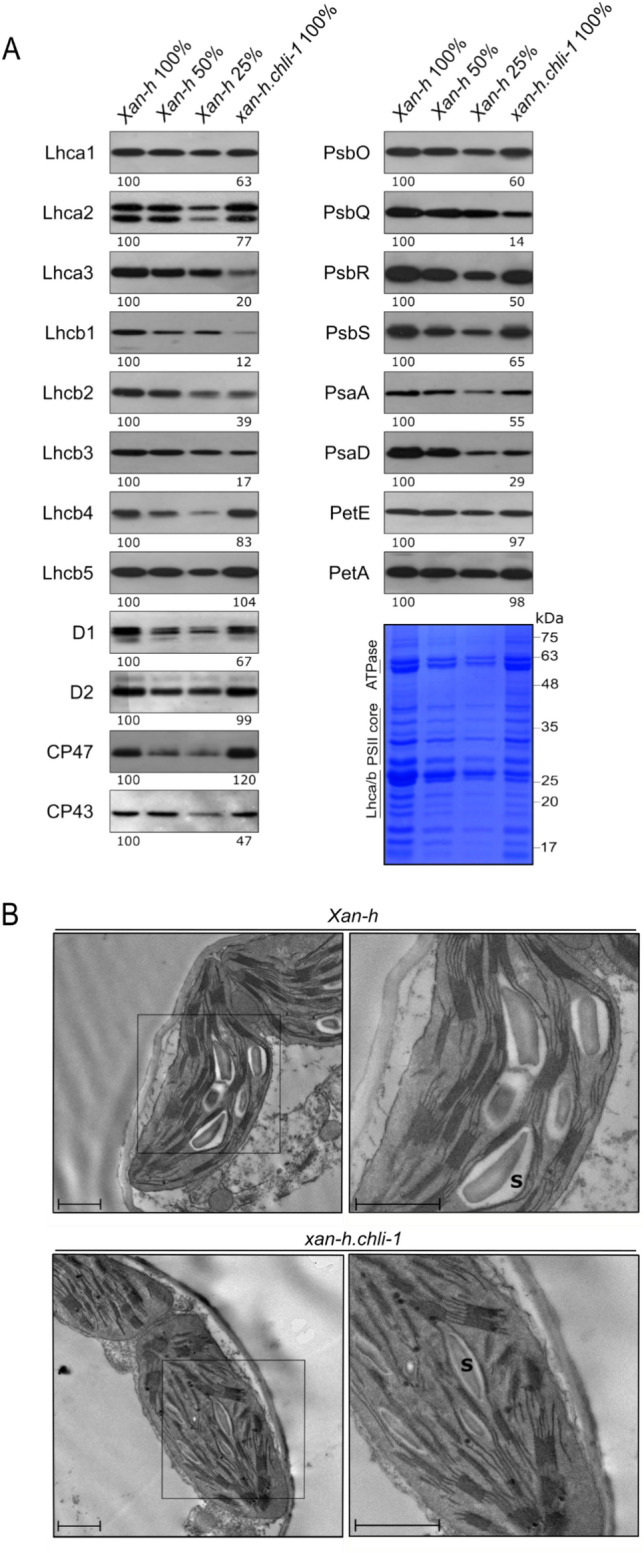
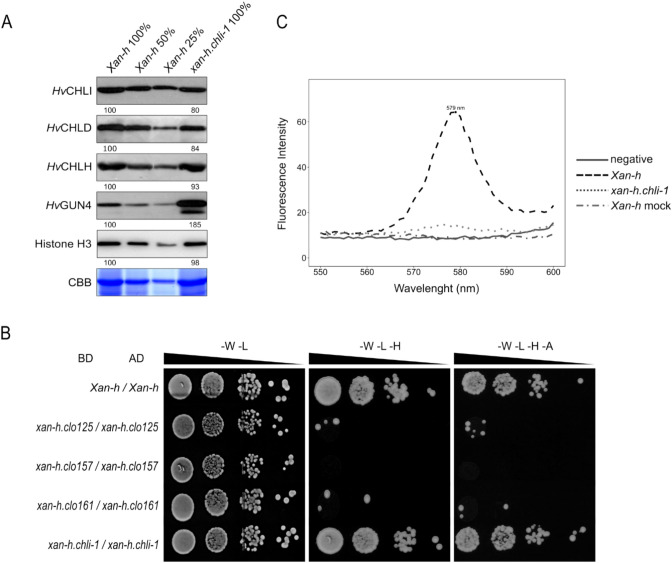
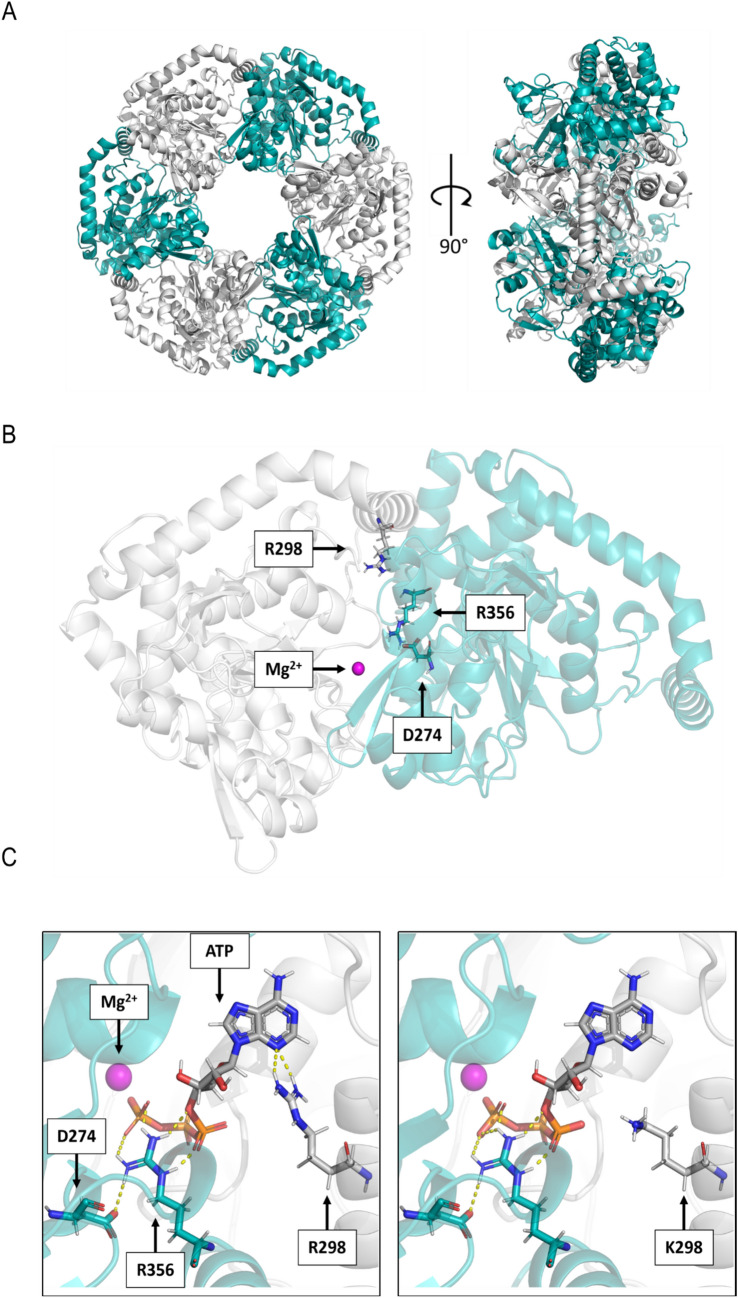
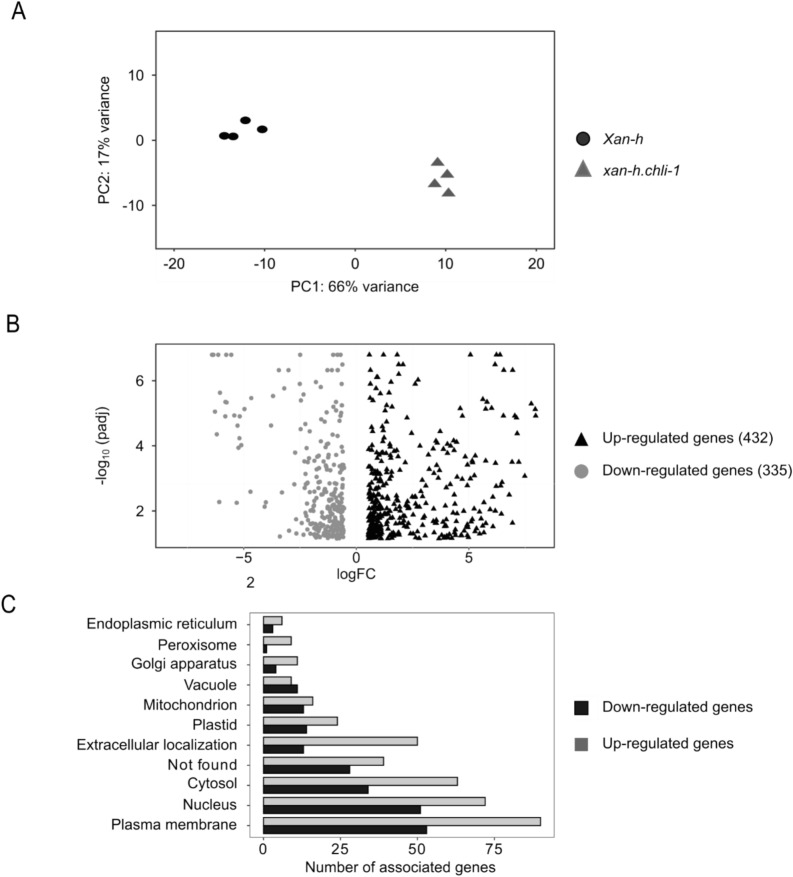
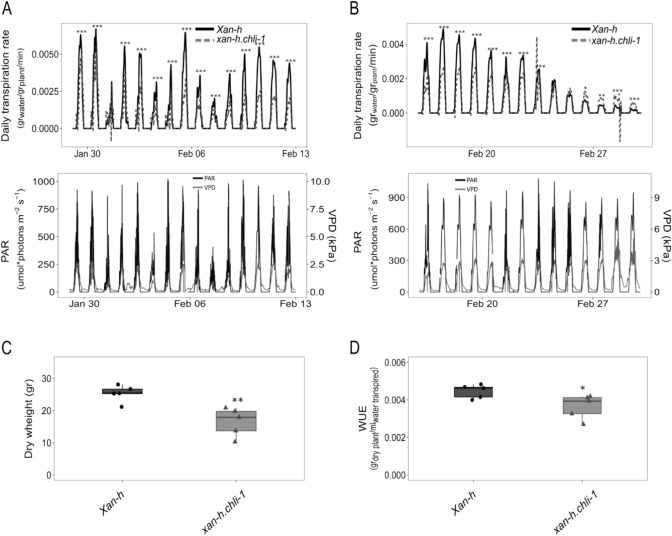
The barley mutant xan-h.chli-1 shows phenotypic features, such as reduced leaf chlorophyll content and daily transpiration rate, typical of wild barley accessions and landraces adapted to arid climatic conditions. The pale green trait, i.e. reduced chlorophyll content, has been shown to increase the efficiency of photosynthesis and biomass accumulation when photosynthetic microorganisms and tobacco plants are cultivated at high densities. Here, we assess the effects of reducing leaf chlorophyll content in barley by altering the chlorophyll biosynthesis pathway (CBP). To this end, we have isolated and characterised the pale green barley mutant xan-h.chli-1, which carries a missense mutation in the Xan-h gene for subunit I of Mg-chelatase (HvCHLI), the first enzyme in the CBP. Intriguingly, xan-h.chli-1 is the only known viable homozygous mutant at the Xan-h locus in barley. The Arg298Lys amino-acid substitution in the ATP-binding cleft causes a slight decrease in HvCHLI protein abundance and a marked reduction in Mg-chelatase activity. Under controlled growth conditions, mutant plants display reduced accumulation of antenna and photosystem core subunits, together with reduced photosystem II yield relative to wild-type under moderate illumination, and consistently higher than wild-type levels at high light intensities. Moreover, the reduced content of leaf chlorophyll is associated with a stable reduction in daily transpiration rate, and slight decreases in total biomass accumulation and water-use efficiency, reminiscent of phenotypic features of wild barley accessions and landraces that thrive under arid climatic conditions.

Keywords: Barley; Canopy photosynthesis; Chlorophyll biosynthesis; Drought stress; Mg-chelatase; Pale green leaves.


Conflict of interest statement

The authors have no relevant financial or non-financial interests to disclose.

Figures

Fig. 1
Fig. 1
Visible phenotypes of cv. Morex (control) and TM2490 mutant plants grown under greenhouse conditions. A Images of cv. Morex control plant and the pale green mutant TM2490 from coleoptile to flag-leaf stage. Scale bar = 2 cm. B Measurements of apparent chlorophyll content in cv. Morex and TM2490 leaves (expressed as SPAD units) carried out on eight independent plants at different developmental stages. C Leaf photosynthetic performance of dark-adapted and light-adapted plants measured with the Handy PEA fluorometer in eight independent plants. Error bars on the histograms indicate standard deviations and the significance of the observed differences was assessed using Student’s t-test (*** P < 0.001, ** P < 0.01, * P < 0.05)
Fig. 2
Fig. 2
Identification of the TM2490 locus. A Comparison of allele frequency distributions in RNAseq pools obtained from WT-like and TM2490-like F2 individuals. Allele frequencies are indicated on the Y axis, genomic coordinates along Chr7 on the X axis. The peak of homozygous alleles in the TM2490-like pool corresponds to the 20-Mb candidate region around 6000 Mbp. The red line indicates the threshold allele frequency of 0.5. B Schematic representation of the Xan-h (HORVU.MOREX.r3.7HG0738240) locus, i.e. the single-copy gene chosen as the best candidate for the TM2490 phenotype. Bars indicate the positions of known lethal mutations within the gene, together with the TM2490 mutation, here indicated as xan-h.chli-1, with the respective SNPs. Boxes represent exons and lines indicate introns
Fig. 3
Fig. 3
Representative phenotypes of Xan-h and xan-h.chli-1 plants at the second-leaf stage following growth under greenhouse conditions. A Xan-h and xan-h.chli-1 barley leaves were harvested 14 days after germination. Note that, in terms of leaf pigment content and photosynthetic performance, xan-h.chli-1 plants (BC2F2 generation) were identical to TM2490 plants at the M4 generation. Scale bar = 2 cm. Analyses of photosynthetic parameters were performed using the Dual-PAM 100 fluorometer. B The effective quantum yield of PSII [Y(II)], and quantum yields of non-regulated energy dissipation [Y(NO)] (C) and regulated energy dissipation of PSII [Y(NPQ)] (D). Measurements used to monitor PSII performance were carried out at increasing light intensities (from dark to 1287 μmol photons m− 2 s− 1; 3-min exposure to each light intensity). Concomitantly, the effective quantum yield of PSI [Y(I)] (E), and the quantum yields of non-photochemical energy dissipation in PSI owing to acceptor-side limitation [Y(NA)] (F), and donor-side-limited heat dissipation [Y(ND)] (G), were determined. Curves show average values of three biological replicates, while bars indicate standard deviations. PPFD photosynthetic photon flux density
Fig. 4
Fig. 4
Biochemical and ultrastructural characterization of thylakoid membranes from Xan-h and xan-h.chli-1. A Immunoblot analyses of thylakoid protein extracts from Xan-h and xan-h.chli-1 leaf material, normalized with respect to fresh weight and probed with antibodies specific for subunits of thylakoid protein complexes. For relative quantification, 50% and 25% dilutions of Xan-h protein extracts were also loaded. One filter (representative of three biological replicates) is shown for each immunoblot. An SDS-PA gel stained with Coomassie Brilliant Blue (CBB) is shown as loading control. B TEM micrographs depict chloroplast ultrastructure in Xan-h (upper panels) and xan-h.chli-1 (lower panels) samples. S starch granule; Scale bar = 1 µm
Fig. 5
Fig. 5
Effects of the xan-h.chli-1 mutation on the accumulation, assembly and activity of the Mg-Chelatase complex. A Immunoblot analyses of total protein extracts (normalized to leaf fresh weight) from Xan-h and xan-h.chli-1 plants with antibodies specific for HvCHLI, HvCHLD, HvCHLH and HvGUN4, respectively. A CBB-stained gel corresponding to the RbcL region, and an immunoblot showing the histone H3 protein are shown as controls for equal loading. For protein quantification, 50% and 25% dilutions of Xan-h protein extracts were also loaded. One representative of three biological replicates is shown for each immunoblot. B Yeast two-hybrid interaction assays were performed on Xan-h and the mutant allelic variants xan-h.chli-1, xan-h.clo125, xan-h.clo157 and xan-h.clo161 in order to test their ability to self-interact (homodimerization). As highlighted by their growth on selective media (-W-L-H and -W-L-H-A), only the colonies expressing the wild-type Xan-h and its mutant xan-h.chli-1 alleles were able to self-associate. BD, GAL4 DNA-binding domain, AD, GAL4 activation domain, -W –L, dropout medium devoid of Trp and Leu (permissive medium); -W -L -H, lacking Trp, Leu and His (selective medium), and -W -L -H -A, lacking Trp, Leu, His and Ade (selective medium). Serial dilutions were prepared for each strain. C In vitro assay of Mg-chelatase activity in etiolated leaf extracts from Xan-h and xan-h.chli-1. The fluorescence emission of the Mg-chelatase product Mg-deuteroporphyrin was recorded from 550 to 600 nm using an excitation wavelength of 408 nm. Protein extracts were normalized to total protein content. One representative chart (of three biological replicates) is shown
Fig. 6
Fig. 6
Effect of the xan-h.chli-1 mutation on the HvCHLI hexamer structure. A Model of the AAA + ATPase subunit of the barley Mg-chelatase enzyme. The adjacent monomers are coloured in white and cyan. Left panel: frontal view of the homo-hexameric ring shown in cartoon representation; Right panel: side view of the ring in cartoon representation. B Frontal view of a single dimer. The two monomers are represented in transparent cartoon and coloured in white (chain A) and cyan (chain B), respectively. The constituent atoms of R298 in chain A are depicted in light grey (C atoms), blue (N), red (O), and white (H). D274 and R356 (S-2) of chain B are shown in cyan (C), blue (N), red (O), white (H) and represented as solid sticks. R298 in chain B, D274 and R356 from chain A are not highlighted. Mg2+ is shown as a magenta sphere. C ATP binding cleft with Mg2+ and docked ATP. The same colour scheme is used for D274 and R356 of chain B, with ATP shown in dark grey and P atoms in orange H-bonds are represented as yellow dashed lines
Fig. 7
Fig. 7
Comparative transcriptomic analyses of xan-h.chli-1 and Xan-h leaves grown under greenhouse conditions. A Principal component analysis (PCA) of the four biological replicates for each genotype. B Volcano plot of the differentially expressed genes (DEGs) filtered by the log of fold change (logFC) and the adjusted p-value (padj). C Subcellular localization of DEGs based on information available in the SUBA5 database (https://suba.live/)
Fig. 8
Fig. 8
Relative performance of Xan-h and xan-h.chli-1 plants grown under optimal and drought-stress conditions, as estimated by the FPP phenotyping platform. A Upper panel: Daily transpiration rate normalized to plant fresh weight (g water/g plant/min) as evaluated for 14 days under well-watered conditions during daylight exposure from 6.00 am to 18.00 pm. To avoid overloading the Figure, data obtained during the night period are not shown. Lower panel: Photosynthetic active radiation intensities (PAR) and vapour pressure deficit (VPD) measured by a weather station for the 14 representative days under well-watered conditions. B Upper panel: daily transpiration rate normalized to plant fresh weight (g water/g plant/min) as evaluated for 14 days under drought-stress conditions, automatically maintained through the feedback-controlled irrigation system, during daylight exposure from 6.00 am to 18.00 pm. Lower panel: photosynthetic active radiation intensities (PAR) and vapour pressure deficit (VPD) measured by a weather station for the 14 days under drought-stress conditions. In all cases, the significance of the data was estimated using Student’s t-test (***P < 0.001, **P < 0.01, *P < 0.05). C Plant dry weight (g) at the end of the experiment, i.e. upon completion of plant life cycle. The plant material was dried at 60 °C for 72 h. The significance of the observed differences was evaluated with Students t-test (** P < 0.01). D Water use efficiency (WUE) (g dry plant/ml water transpired) was measured by the total weight of dry plants at the end of the life cycle, normalized to total water transpired. Student’s t-test was performed to estimate the significance of the observed differences (* P < 0.05). Average data of five biological replicates are shown

Similar articles

Cited by

References

    1. Adams NBP, Bisson C, Brindley AA, Farmer DA, Davison PA, Reid JD, Hunter CN (2020) The active site of magnesium chelatase. Nat Plants 6(12):1491–1502. 10.1038/s41477-020-00806-9 - PubMed
    1. Appiah M, Abdulai I, Schulman AH, Moshelion M, Dewi ES, Daszkowska-Golec A, Bracho-Mujica G, Rötter RP (2023) Drought response of water-conserving and non-conserving spring barley cultivars. Front Plant Sci 14(October):1247853. 10.3389/FPLS.2023.1247853/BIBTEX - PMC - PubMed
    1. Araus JL, Slafer GA, Reynolds MP, Royo C (2002) Plant breeding and drought in C3 cereals: what should we breed for? Ann Bot 89(7):925–940. 10.1093/AOB/MCF049 - PMC - PubMed
    1. Barbato R, Tadini L, Cannata R, Peracchio C, Jeran N, Alboresi A, Morosinotto T et al (2020) Higher order photoprotection mutants reveal the importance of ΔpH-dependent photosynthesis-control in preventing light induced damage to both photosystem II and photosystem I. Sci Rep 10(1):1–14. 10.1038/s41598-020-62717-1 - PMC - PubMed
    1. Bassi R, Simpson D (1987) Chlorophyll-protein complexes of barley photosystem I. Eur J Biochem 163(2):221–230. 10.1111/J.1432-1033.1987.TB10791.X - PubMed