. 2025 Feb;47(1):227-246.
doi: 10.1007/s11357-024-01339-1. Epub 2024 Sep 30.

Local molecular and connectomic contributions of tau-related neurodegeneration

Collaborators, Affiliations

Local molecular and connectomic contributions of tau-related neurodegeneration

Fardin Nabizadeh et al. Geroscience. 2025 Feb.

Abstract

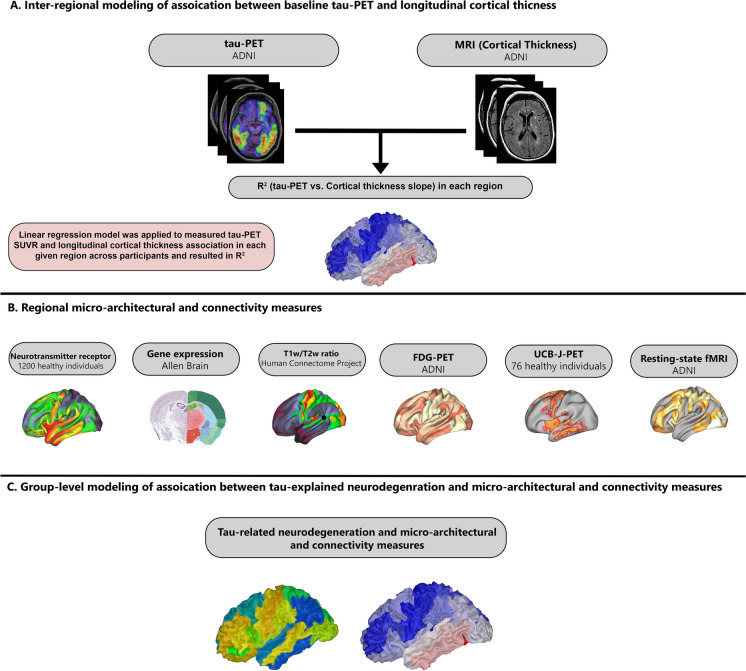
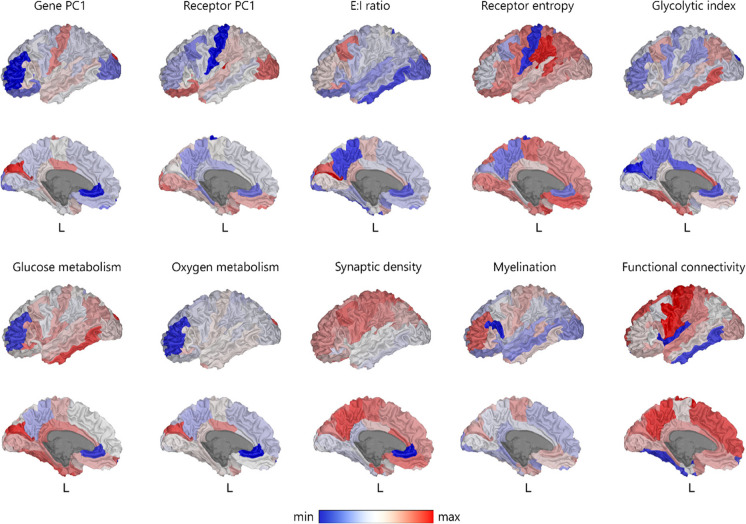
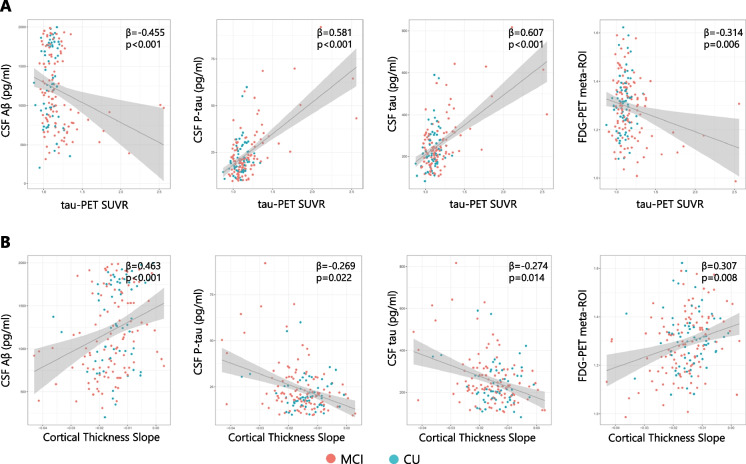
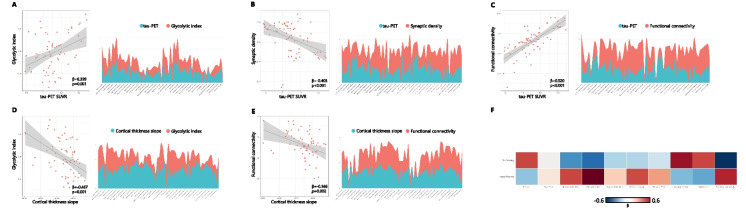
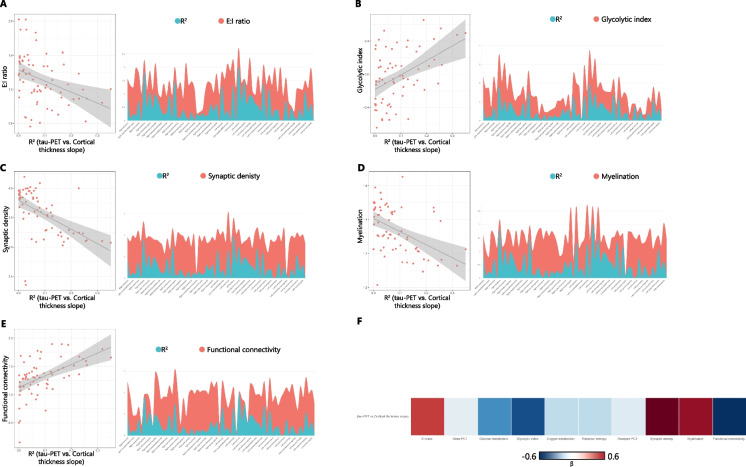
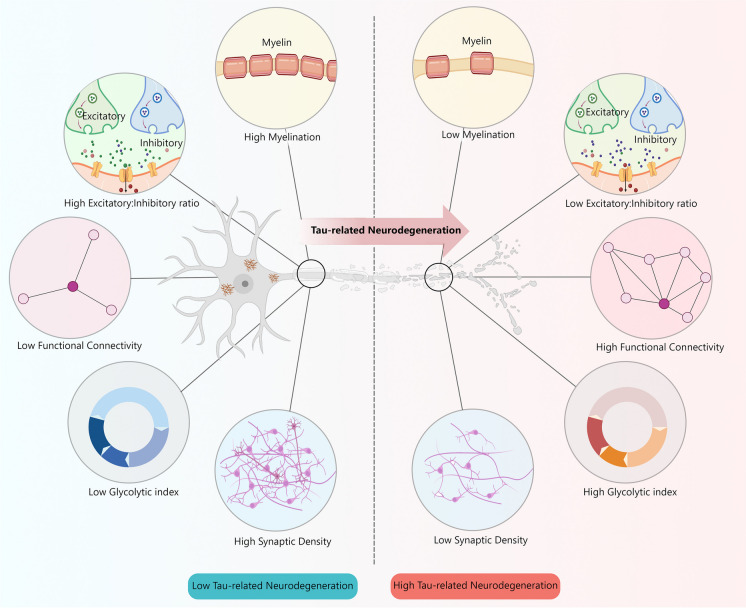
Neurodegeneration in Alzheimer's disease (AD) is known to be mostly driven by tau neurofibrillary tangles. However, both tau and neurodegeneration exhibit variability in their distribution across the brain and among individuals, and the relationship between tau and neurodegeneration might be influenced by several factors. I aimed to map local molecular and connectivity characteristics that affect the association between tau pathology and neurodegeneration. The current study was conducted on the cross-sectional tau-PET and longitudinal T1-weighted MRI scan data of 186 participants from the ADNI dataset including 71 cognitively unimpaired (CU) and 115 mild cognitive impairment (MCI) individuals. Furthermore, the normative molecular profile of a region was defined using neurotransmitter receptor densities, gene expression, T1w/T2w ratio (myelination), FDG-PET (glycolytic index, glucose metabolism, and oxygen metabolism), and synaptic density. I found that the excitatory-inhibitory (E:I) ratio, myelination, synaptic density, glycolytic index, and functional connectivity are linked with deviation in the relationship between tau and neurodegeneration. Furthermore, there was spatial similarity between tau pathology and glycolytic index, synaptic density, and functional connectivity across brain regions. The current study demonstrates that the regional susceptibility to tau-related neurodegeneration is associated with specific molecular and connectomic characteristics of the affected neural systems. I found that the molecular and connectivity architecture of the human brain is linked to the different effects of tau pathology on downstream neurodegeneration.

Keywords: Alzheimer’s disease; Connectivity; Mild cognitive impairment; Molecular; Neurodegeneration; Tau.


Conflict of interest statement

Declarations. Ethical approval: The protocol for the research project has been approved by a suitably constituted Ethics Committee of an institution, and it conforms to the provisions of the Declaration of Helsinki according to the ADNI study (adni.loni.usc.edu). The STROBE checklist was followed in this observational study. Consent for publication: This manuscript has been approved for publication by all authors. Conflict of interest: The author declares no competing interests.

Figures

Fig. 1
Fig. 1
Methodological approach. Regression analyses of processed baseline tau-PET and longitudinal cortical thickness data in 68 ROIs were performed in order to measure neurodegeneration-explained variance by tau-PET (R2) in each cortical region (A). Regional molecular and connectomic features including 18 PET-derived neurotransmitter receptor densities, 11,560 gene expressions, T1w/T2w ratio (myelination), FDG-PET, UCB-J PET (synaptic density), and rsfMRI were entered as predictors (B). See the “Methods” section for details of how the features were retrieved. Spatial similarity between the patterns of tau-explained neurodegeneration (R2) and molecular and connectomic features was measured using linear regression analyses C. ROI, region of interest; PET, positron emission tomography; FDG, 18F-fluorodeoxyglucose; MRI, magnetic resonance imaging; rsfMRI, resting-state functional MRI
Fig. 2
Fig. 2
Microarchitectural and connectomic features. Brain surface rendering of gene PC1 = first component of 11,560 genes’ expression, receptor PC1 = first component of 18 PET-derived neurotransmitters density, E:I ratio = excitatory-inhibitory receptor density ratio; receptor entropy, glycolytic index = amount of aerobic glycolysis; glucose metabolism = FDG-PET image; synapse density = UCB-J PET tracer; myelination = T1w/T2w ratio; oxygen metabolism = [150] labeled water, carbon monoxide, and oxygen PET; functional connectivity = sum of weighted connections. PET, positron emission tomography; FDG, 18F-fluorodeoxyglucose
Fig. 3
Fig. 3
Association between tau-PET and cortical thickness with CSF biomarkers. Scatter plot of the association between tau-PET SUVR and CSF biomarkers and FDG-PET in meta-ROI regions (A). Each dot represents an individual. Scatter plot of the association between cortical thickness slope and CSF biomarkers and FDG-PET in meta-ROI regions (B). Each dot represents an individual. All linear regressions performed were two-sided, without adjustment for multiple comparisons, and error bands correspond to the 95% confidence interval. The linear models were adjusted for the effect of age, sex, APOE ε4, and baseline Aβ-PET. PET, positron emission tomography; SUVR, standardized uptake value ratio; Aβ, amyloid-beta; CU, cognitively unimpaired; MCI, mild cognitive impairment; p-tau, phosphorylated tau; FDG-PET, [1⁸F]Fluorodeoxyglucose positron emission tomography
Fig. 4
Fig. 4
Regional association between tau-PET and cortical thickness. Surface rendering of average baseline tau-PET, cortical thickness slope, and tau-explained neurodegeneration (R2) in 68 cortical regions (A). Scatter plot of the group-level association between tau-PET SUVR and cortical thickness slope (B). Each dot represents an individual. Participants with higher baseline tau-PET SUVR levels have more decrease in cortical thickness over time (B). Area chart of regional tau-PET SUVR, cortical thickness slope, and R2 (tau-PET SUVR vs. cortical thickness slope) (C). All linear regressions performed were two-sided, without adjustment for multiple comparisons, and error bands correspond to the 95% confidence interval. The linear models were adjusted for the effect of age, sex, APOE ε4, and baseline Aβ-PET. PET, positron emission tomography; SUVR, standardized uptake value ratio; Aβ, amyloid-beta; CU, cognitively unimpaired; MCI, mild cognitive impairment
Fig. 5
Fig. 5
Microarchitectural and connectomic features are associated with tau pathology and neurodegeneration patterns. Scatter plot and area chart of the association between tau-PET SUVR and glycolytic index (A). Each dot represents a region. Regions with higher glycolytic index have higher tau accumulation. Scatter plot and area chart of the association between tau-PET SUVR and synaptic density (B). Each dot represents a region. Regions with higher synaptic density showed lower tau accumulation. Scatter plot and area chart of the association between tau-PET SUVR and functional connectivity (C). Each dot represents a region. Higher functional connectivity is spatially associated with a higher level of tau accumulation. Scatter plot and area chart of the association between cortical thickness slope and glycolytic index (D). Each dot represents a region. A higher glycolytic index is spatially associated with more decrease in cortical thickness over time. Scatter plot and area chart of the association between cortical thickness slope and functional connectivity (E). Each dot represents a region. A higher functional connectivity is spatially associated with more decrease in cortical thickness over time. Heatmap of the association between microarchitectural and connectomic features with tau pathology and cortical thickness (F). All linear regressions performed were two-sided, without adjustment for multiple comparisons, and error bands correspond to the 95% confidence interval. The linear models were adjusted for the effect of baseline Aβ-PET. PET, positron emission tomography; SUVR, standardized uptake value ratio; Aβ, amyloid-beta
Fig. 6
Fig. 6
Microarchitectural and connectomic features are associated with tau-explained neurodegeneration. Scatter plot and area chart of the association between tau-explained neurodegeneration (R2) and E:I ratio (A). Each dot represents a region. Regions with higher E:I have lower tau-explained neurodegeneration (R2). Scatter plot and area chart of the association between tau-explained neurodegeneration (R2) and glycolytic index (B). Each dot represents a region. Regions with higher glycolytic index have higher tau-explained neurodegeneration (R2). Scatter plot and area chart of the association between tau-explained neurodegeneration (R2) and synaptic density (C). Each dot represents a region. Regions with higher synaptic density have lower tau-explained neurodegeneration (R2). Scatter plot and area chart of the association between tau-explained neurodegeneration (R2) and myelination (D). Each dot represents a region. Regions with higher myelination have lower tau-explained neurodegeneration (R2). Scatter plot and area chart of the association between tau-explained neurodegeneration (R2) and functional connectivity (E). Each dot represents a region. Regions with higher functional connectivity have higher tau-explained neurodegeneration (R2). Heatmap of the association between microarchitectural and connectomic features with tau-explained neurodegeneration (R2) (F). All linear regressions performed were two-sided, without adjustment for multiple comparisons, and error bands correspond to the 95% confidence interval. The linear models were adjusted for the effect of baseline Aβ-PET. PET, positron emission tomography; Aβ, amyloid-beta; E:I ratio, excitatory: inhibitory receptor density ratio
Fig. 7
Fig. 7
Model-derived map of molecular and connectomic influence on tau pathology, neurodegeneration, and tau-explained neurodegeneration. The influence map of molecular and connectomic features visualized on the brain (AC). The influence map shows the brain regions where specific molecular and connectomic features are consistently informative in explaining the tau pathology, neurodegeneration (cortical thickness derived from MRI data), or tau-explained neurodegeneration which were re-scaled to 0 to 100 range for visualization. It shows the change in model residuals at each region due to adding the molecular and connectomic profile as a model predictor of tau pathology, neurodegeneration, or tau-explained neurodegeneration. The receptor influences are calculated using the Wilcoxon rank-sum test statistics of the residuals from each model for a given region. The maps presented show only the regions with statistically significant z-scores (p-value < 0.05) of the Wilcoxon rank-sum test statistics, relative to the null distributions
Fig. 8
Fig. 8
Proposed model of microarchitectural and connectomic features associated with tau-related neurodegeneration. The model revealed that biological and connectomic profiles including lower myelination, excitatory-inhibitory receptor density ratio, and synaptic density along with higher functional connectivity and glycolytic index are associated with the pattern of higher neurodegeneration due to the tau pathology

References

    1. Jack CR Jr, Bennett DA, Blennow K, Carrillo MC, Dunn B, Haeberlein SB, et al. NIA-AA Research Framework: Toward a biological definition of Alzheimer’s disease. Alzheimers Dement. 2018;14(4):535–62. - PMC - PubMed
    1. Selkoe DJ, Hardy J. The amyloid hypothesis of Alzheimer’s disease at 25 years. EMBO Mol Med. 2016;8(6):595–608. - PMC - PubMed
    1. Scheltens P, De Strooper B, Kivipelto M, Holstege H, Chételat G, Teunissen CE, et al. Alzheimer’s disease. The Lancet. 2021;397(10284):1577–90. - PMC - PubMed
    1. Das SR, Lyu X, Duong MT, Xie L, McCollum L, de Flores R, et al. Tau-atrophy variability reveals phenotypic heterogeneity in Alzheimer’s disease. Ann Neurol. 2021;90(5):751–62. - PMC - PubMed
    1. Guo T, Zhang D, Zeng Y, Huang TY, Xu H, Zhao Y. Molecular and cellular mechanisms underlying the pathogenesis of Alzheimer’s disease. Mol Neurodegener. 2020;15(1):40. - PMC - PubMed