. 2025 Jun;47(3):3611-3626.
doi: 10.1007/s11357-024-01350-6. Epub 2024 Sep 30.

Differences in motor learning-related structural plasticity of layer 2/3 parvalbumin-positive interneurons of the young and aged motor cortex

Affiliations

Differences in motor learning-related structural plasticity of layer 2/3 parvalbumin-positive interneurons of the young and aged motor cortex

Andrew M Davidson et al. Geroscience. 2025 Jun.

Abstract

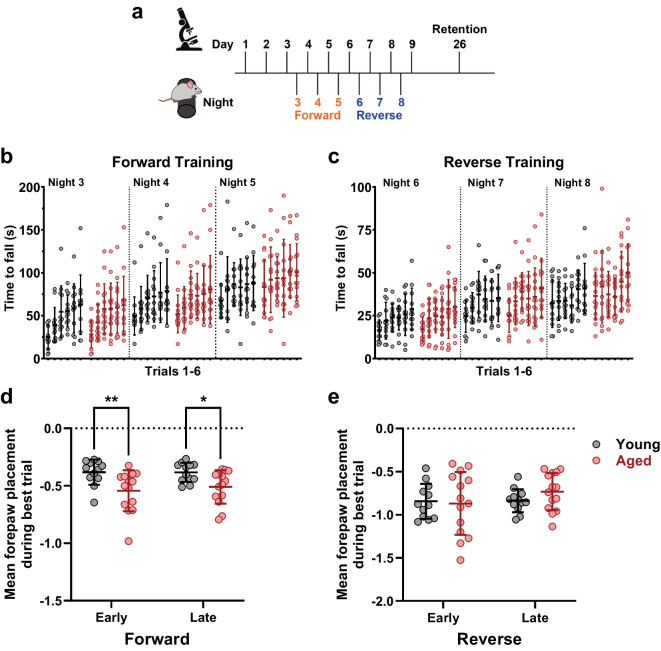
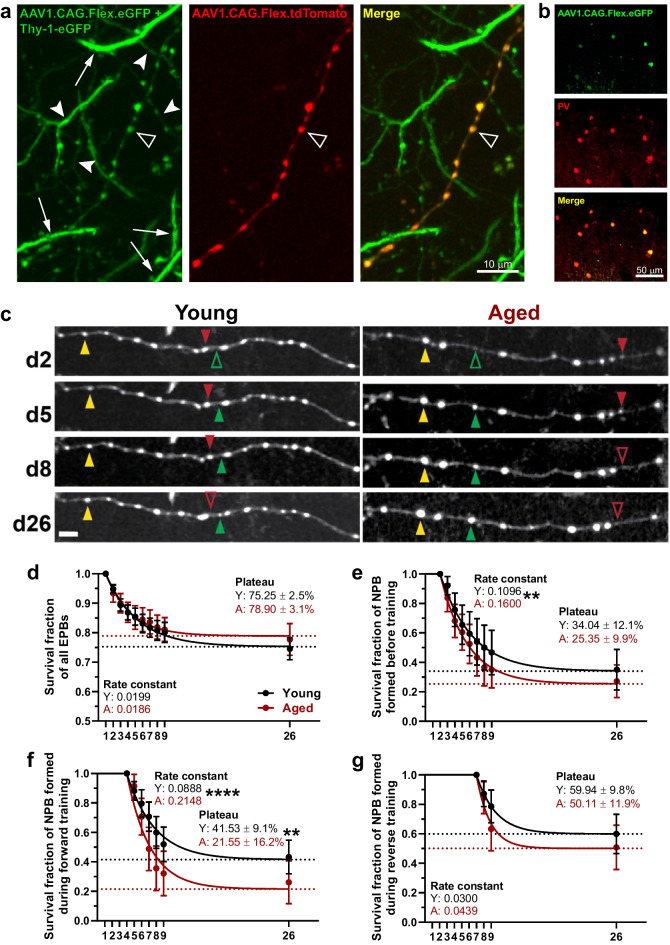
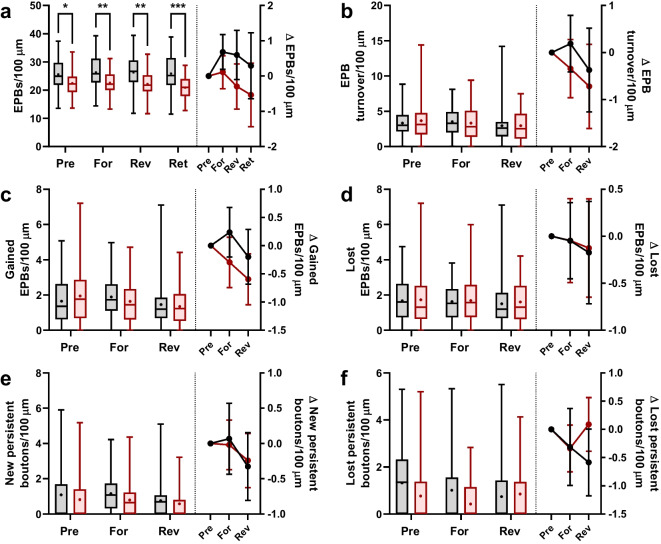
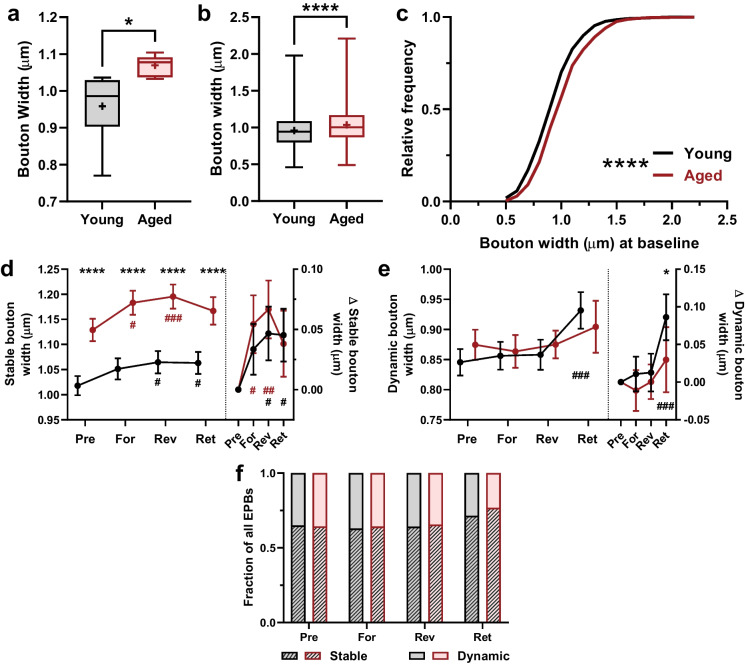
Changes to neuronal connectivity are believed to be a key factor in cognitive impairments associated with normal aging. Because of its effect on activities of daily living, deficient motor control is a critical type of cognitive decline to understand. Diminished inhibitory networks in the cortex are implicated in such motor control deficits, pointing to the connectivity of inhibitory cortical interneurons as an important area for study. Here, we used chronic two-photon microscopy to track the structural plasticity of en passant boutons (EPBs) of parvalbumin-positive interneurons in the mouse motor cortex in the first longitudinal, in vivo study of inhibitory interneuron synapses in the context of aging. Young (3-5 months) and aged (23-28 months) mice underwent training on the accelerating rotarod to evoke motor learning-induced structural plasticity. Our analysis reveals that, in comparison with axons from young mice, those from aged mice have fewer EPBs at baseline that also tend to be larger in size. Aged axons also express learning-related structural plasticity-like new bouton stabilization and bouton enlargement-that is less persistent than that of young axons. This study reveals striking baseline differences in young and aged axon morphology as well as differences in the deployment of learning-related structural plasticity across axons.

Keywords: Aging; Axon; Cortex; Interneuron; Motor learning; Structural plasticity.


Conflict of interest statement

Declarations. Competing interests: The authors declare no competing financial interests.

Figures

Fig. 1
Fig. 1
Young and aged mice undergo yoked motor skill training, and both age groups show improved performance with training. a Experimental protocol. Animals were imaged between 9:00 am and 2:00 pm and underwent motor training between 4:00 pm and 8:00 pm. b Time to fall per trial (in seconds) on each night of forward training. Black dots represent young mice; red dots represent aged mice; each column represents 1 of the 6 training trials administered per night; horizontal bar marks mean; whisker extends to ± SD. Two-way ANOVA to compare the effect of aging on performance: trial effect p < 0.0001, indicating trial-to-trial change; age + night effect p = 0.0001, indicating night-to-night change; interaction p = 0.8642, indicating that the effect of training was not different between age groups. c The same as b but for reverse training. Two-way ANOVA to compare the effect of aging on performance: trial effect p < 0.0001, indicating trial-to-trial change; age + night effect p < 0.0001, indicating night-to-night change; interaction p = 0.4447, indicating that the effect of training was not different between age groups. d Mean forepaw placement (in cm from top of rotarod) during the best of 6 trials on Night 3 (“Early”) and during the best of 6 trials on Night 5 (“Late”) of forward training. Two-way ANOVA to compare the effect of aging on forepaw placement: training effect p = 0.6237, indicating no change from early to late; age effect p = 0.0031, indicating an overall difference in placement between age groups; interaction p = 0.4447, indicating that the effect of training was not different between age groups; multiple comparisons reveal age group differences in placement during both early (p = 0.0082) and late training (p = 0.0453). e The same as d but for reverse training. Two-way ANOVA to compare the effect of aging on forepaw placement: training effect p = 0.2069, indicating no change from early to late; age effect p = 0.6288, indicating no overall difference in placement between age groups; interaction p = 0.2523, indicating that the effect of training was not different between age groups
Fig. 2
Fig. 2
While young and aged groups display similar survival of steady-state boutons, those formed during motor training are short-lived in the aged group. a Labeling of PV IN axons in Thy-1-EGFP::PV-Cre mice following the injection of a mixture of AAVs (AAV1.CAG.Flex.eGFP.WPRE.bGH and AAV1.CAG.Flex.tdTomato.WPRE.bGH). Representative high-resolution images of a PV IN axon acquired with in vivo two-photon microscopy. Images are maximum intensity projections of 32 slices taken at 1.5 µm z-steps. Left, signal from the green channel includes pyramidal neuron dendrites (arrows), as well as of axons from excitatory neurons (arrowheads). The injection of the cre-dependent eGFP-encoding virus in these Thy-1-EGFP::PV-Cre mice added the expression of eGFP by parvalbumin interneurons (empty arrowheads); Center, signal from the red channel captures the tdTomato expression from the PV IN axons exclusively (empty arrowheads); Right, the merged signal allows the identification of axons and EPBs of PV INs. b Immunostaining against parvalbumin confirmed the identity of the cre-dependent fluorophore-expressing neurons as PV INs. Confocal images of putative PV INs labeled in L2/3 of Thy-1-EGFP::PV-Cre mice. Top, sparse eGFP expression by putative PV INs in Thy-1-EGFP::PV-Cre mice; Middle, staining of PV INs was done using rabbit recombinant monoclonal anti-Parvalbumin antibody (1:200, Abcam cat# ab181086, clone# EPR13091) followed by secondary goat anti-rabbit DyLight 594 (1:500, Thermo Fisher, cat# 35,560); Bottom, merged image demonstrating that all the eGFP-expressing cells are PV INs. c Representative images of young and aged axons of PV INs taken from d2 (pre-training), d5 (forward training), d8 (reverse training), and d26 (retention). Present EPBs marked with filled arrowheads; absent EPBs marked with unfilled arrowheads. Yellow, stable; green, gained; red, lost. Images are best projections of 5–10 images taken at 1.5 µm z-steps. Scale bar, 5 μm. d Survival of all boutons present at Day 1 of imaging. Extra sum-of-squares F-test to compare plateau (p = 0.1049) and rate constant (p = 0.4743). Data points represent average survival fraction per age group; solid lines, single phase exponential decay following plateau curve fit to data; dotted lines, extrapolated plateaus. Young fragments, n = 45; aged, n = 48. e Same as d but survival of all new persistent boutons formed pre-training. Extra sum-of-squares F-test to compare plateau (p = 0.2702) and rate constant (p = 0.0021). f The same as d but survival of all new persistent boutons formed during forward training. Extra sum-of-squares F-test to compare plateau (p = 0.0060) and rate constant (p < 0.0001). g The same as d but survival of all new persistent boutons formed during reverse training. Extra sum-of-squares F-test to compare plateau (p = 0.1994) and rate constant (p = 0.1374)
Fig. 3
Fig. 3
Bouton density is reduced in the aged group while bouton dynamics, which are not affected by motor training, do not differ between young and aged groups. a Bouton density during pre-training, forward training, reverse training, and retention stages. Left Y-axis, boutons per length of axon; Right Y-axis, change in bouton density relative to the pre-training value. Repeated measures two-way ANOVA to compare groups: training effect p = 0.0863, age effect p = 0.0001, interaction p = 0.0964. Multiple comparisons (by Šidák) between age groups: pre-pairing, p = 0.0227; forward, p = 0.0030; reverse p = 0.0018; retention p = 0.0002. b Bouton turnover during pre-training, forward training, and reverse training. Left Y-axis, bouton turnover per length of axon; Right Y-axis, change in bouton turnover relative to the pre-training value. c The same as b, but for boutons gained. d The same as b, but for boutons lost. e The same as b, but for gain of persistent boutons. f  Same as e but for loss of persistent boutons
Fig. 4
Fig. 4
Boutons of the aged group are larger than those of the young group, driven by aging-related differences in the size of stable boutons, which is affected by motor training in both age groups. a Minimum-to-maximum boxplot of the average width per mouse of all boutons present during pre-pairing for each age group; horizontal line marks median, “ + ” marks mean. Young n = 6 mice; aged n = 6 mice. Unpaired t-test, p = 0.0247. b Minimum-to-maximum boxplot of width of all boutons present during pre-pairing for each age group; horizontal line marks median, “ + ” marks mean. Young boutons, n = 785; aged boutons, n = 844. Unpaired t-test, p < 0.0001. c Cumulative frequency distribution of all pre-pairing boutons. Kolmogorov–Smirnov test, p < 0.0001. d Width of stable boutons during pre-pairing, forward pairing, reverse pairing, and retention stages. Left Y-axis, bouton width in microns. Repeated measures two-way ANOVA: training effect p < 0.0001, age effect p < 0.0001, interaction p = 0.5252. Multiple comparisons (by Šidák) across age groups (marked with asterisks): pre-pairing, p < 0.0001; forward, p < 0.0001; reverse, p < 0.0001; retention, p < 0.0001. And within age groups (marked with number signs): young, pre-pairing vs. forward, p = 0.2799; vs. reverse, p = 0.0277; vs. retention, p = 0.0374. Aged, pre-pairing vs. forward, p = 0.0149; vs. reverse, p = 0.001; vs. retention, p = 0.2300; Right Y-axis, change in bouton width relative to pre-pairing width. Repeated measures two-way ANOVA: training effect p < 0.0001, age effect p = 0.2493, interaction p = 0.4219. Multiple comparisons (by Šidák) across age groups (marked with asterisks): forward, p = 0.8111; reverse, p = 0.8493; retention, p = 0.9994. And within age groups (marked with number signs): young, pre-pairing vs. forward, p = 0.1524; vs. reverse, p = 0.0080; vs. retention, p = 0.0119. Aged, pre-pairing vs. forward, p = 0.0040; vs. reverse, p = 0.001; vs. retention, p = 0.1173. e Width of dynamic boutons during pre-pairing, forward pairing, reverse pairing, and retention stages. Left Y-axis, bouton width in microns. Repeated measures two-way ANOVA: training effect p = 0.0002, age effect p = 0.5035, interaction p = 0.2718. Multiple comparisons (by Šidák) across age groups (marked with asterisks): pre-pairing, p = 0.6836; forward, p = 0.9999; reverse, p = 0.9875; retention, p = 0.9314. And within age groups (marked with number signs): young, pre-pairing vs. forward, p = 0.9995; vs. reverse, p = 0.9980; vs. retention, p = 0.001. Aged, pre-pairing vs. forward, p = 0.9997; vs. reverse, p = 0.9999; vs. retention, p = 0.8694; Right Y-axis, change in bouton width relative to pre-pairing width. Repeated measures two-way ANOVA: training effect p < 0.0001, age effect p = 0.0079, interaction p = 0.1656. Multiple comparisons (by Šidák) across age groups (marked with asterisks): forward, p = 0.8272; reverse, = 0.9973; retention, p = 0.041. And within age groups (marked with number signs): young, pre-pairing vs. forward, p = 0.9983; vs. reverse, p = 0.9942; vs. retention, p = 0.001. Aged, pre-pairing vs. forward, p = 0.9990; vs. reverse, p = 0.9998; vs. retention, p = 0.7507. f Proportion of bouton population represented by stable boutons (diagonal fill) and dynamic boutons (unfilled). Chi-square test to compare stable (p > 0.999) and dynamic (p = 0.1973) fractions across age groups

Similar articles

References

    1. Itzev D, Lolova I, Lolov S, Usunoff KG. Age-related changes in the synapses of the rat’s neostriatum. Arch Physiol Biochem. 2001;109:80–9. 10.1076/apab.109.1.80.4279. - PubMed
    1. Mostany R, Anstey JE, Crump KL, Maco B, Knott G, Portera-Cailliau C. Altered synaptic dynamics during normal brain aging. J Neurosci. 2013;33:4094–104. 10.1523/JNEUROSCI.4825-12.2013. - PMC - PubMed
    1. Davidson AM, Mejía-Gómez H, Jacobowitz M, Mostany R. Dendritic spine density and dynamics of layer 5 pyramidal neurons of the primary motor cortex are elevated with aging. Cereb Cortex N Y N. 1991;2020(30):767–77. 10.1093/cercor/bhz124. - PMC - PubMed
    1. Voglewede RL, Vandemark KM, Davidson AM, DeWitt AR, Heffler MD, Trimmer EH, et al. Reduced sensory-evoked structural plasticity in the aging barrel cortex. Neurobiol Aging. 2019;81:222–33. 10.1016/j.neurobiolaging.2019.06.006. - PMC - PubMed
    1. Eavri R, Shepherd J, Welsh CA, Flanders GH, Bear MF, Nedivi E. Interneuron simplification and loss of structural plasticity as markers of aging-related functional decline. J Neurosci. 2018;38:8421–32. 10.1523/JNEUROSCI.0808-18.2018. - PMC - PubMed