. 2024 Sep 29;24(1):329.
doi: 10.1186/s12935-024-03515-x.

Pan-cancer analysis reveals that TK1 promotes tumor progression by mediating cell proliferation and Th2 cell polarization

Affiliations

Pan-cancer analysis reveals that TK1 promotes tumor progression by mediating cell proliferation and Th2 cell polarization

Zhecheng Li et al. Cancer Cell Int. .

Abstract

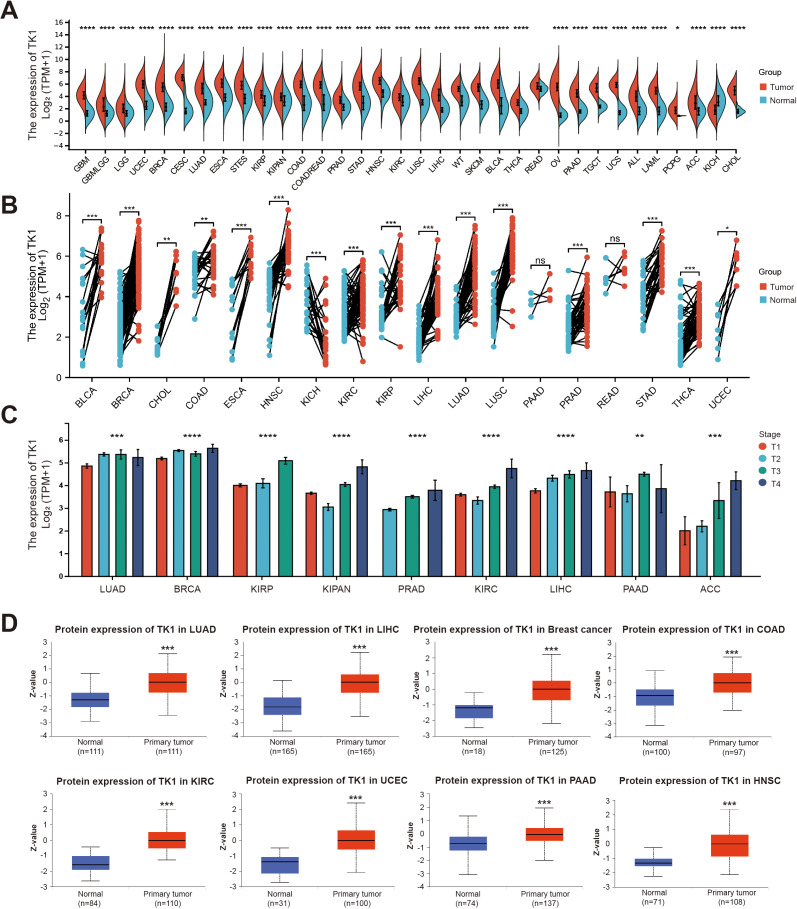
Background: TK1 (Thymidine kinase 1) is a member of the thymidine kinase family and has been observed to be significantly upregulated in a variety of cancer types. However, the exact roles of TK1 in tumor progression and the tumor immune microenvironment are not fully understood. This study aims to investigate the comprehensive involvement of TK1 in pan-cancer through the utilization of bioinformatics analysis, validation of pathological tissue samples, and in vitro experimental investigations.

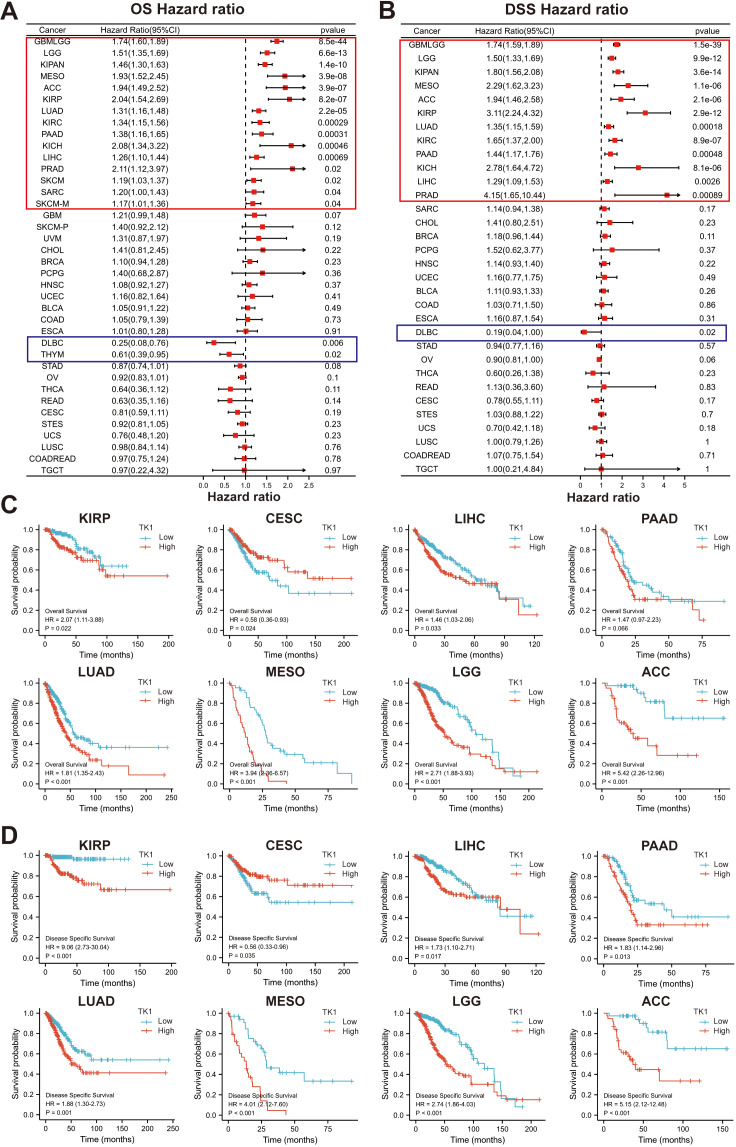
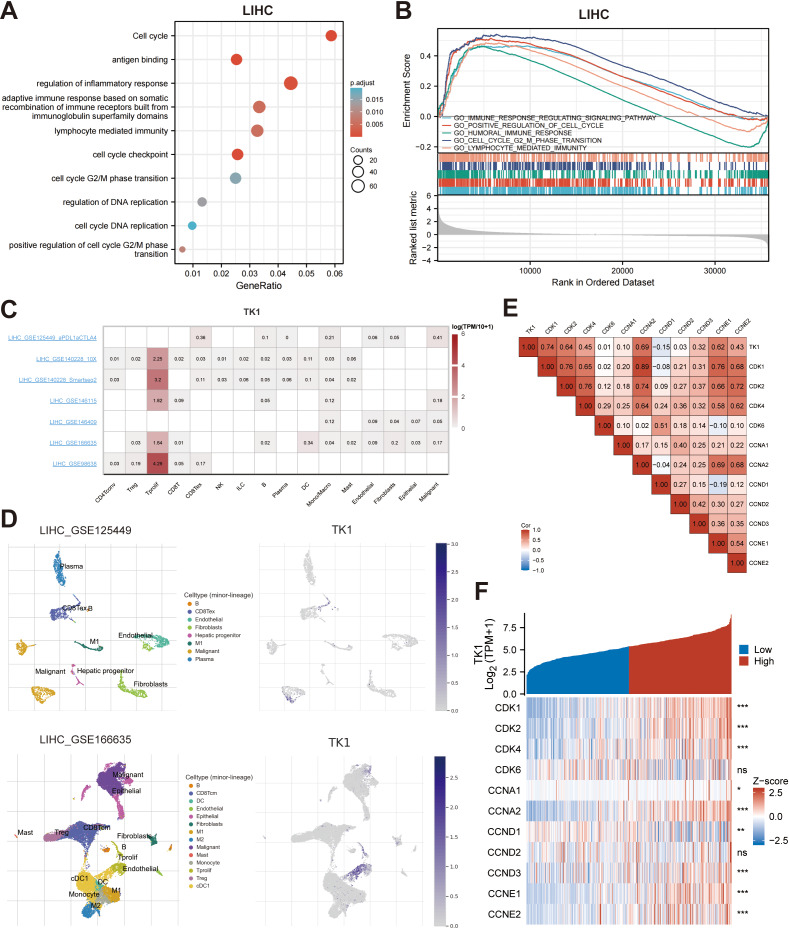
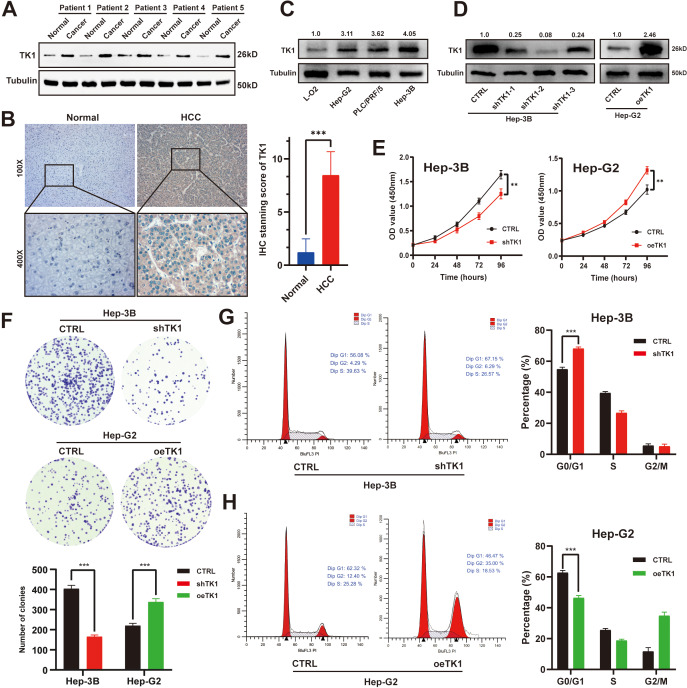
Methods: The expression profiles together with diagnostic and prognostic role of TK1 in pan-cancer were investigated though TCGA, TARGET, GTEx, and CPTAC databases. The single-sample gene set enrichment analysis (ssGSEA) and single-cell sequencing datasets were used to examine the relationship between TK1 and immune infiltration. The expression of TK1 were verified in hepatocellular carcinoma (HCC) through qPCR, western blotting and immunohistochemical assays. The proliferative capacity of HCC cell lines was assessed through CCK-8 and colony formation assays, while cytokine levels were measured via ELISA. Furthermore, flow cytometry was utilized to analyze cell cycle distribution and the proportions of Th2 cells.

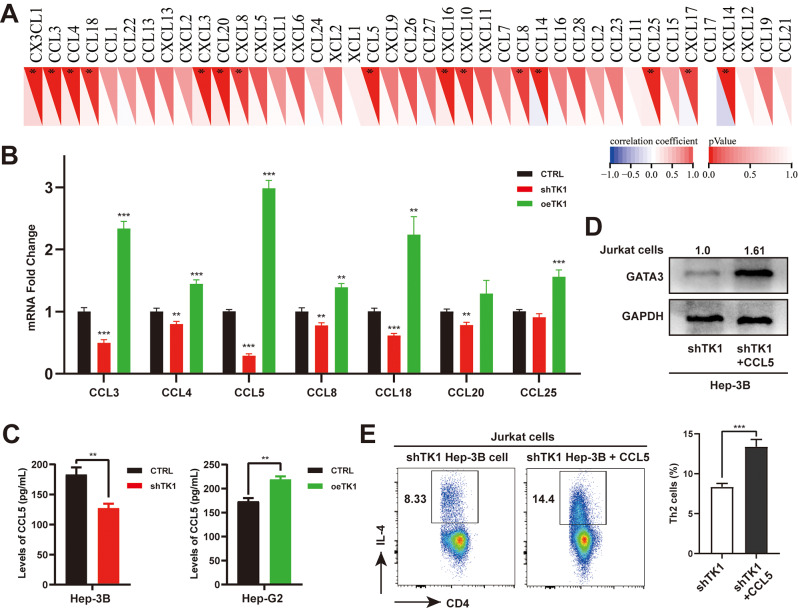
Results: TK1 was overexpressed in most cancers and demonstrated significant diagnostic and prognostic value. Among the various immune cells in pan-cancer, Th2 cells exhibited the closest association with TK1. Furthermore, the single-cell atlas provided insights into the distribution and proportion of TK1 in immune cells of HCC. In vitro experiments revealed an elevated expression of TK1 in HCC tissue and cell lines, and its role in influencing HCC cell proliferation by regulating G0/G1 phase arrest. Additionally, TK1 in cancer cells was found to potentially modulate Th2 cell polarization through the chemokine CCL5.

Conclusion: TK1 holds immense potential as a biomarker for pan-cancer diagnosis and prognosis. Additionally, targeting the expression of TK1 represents a promising therapeutic approach that can enhance the efficacy of current anti-tumor immunotherapy by modulating Th2 cell polarization and multiple mechanisms.

Keywords: Hepatocellular carcinoma; Pan-cancer; TK1; Th2 CD4+ T cells; Tumor immune microenvironment.


Conflict of interest statement

The authors declare no competing interests.

Figures

Fig. 1
Fig. 1
Expression profile of TK1 across different cancer types. The mRNA expression level of TK1 in non-paired (A) and paired (B) tumor samples based on the TCGA, TARGET, and GTEx databases. (C) Correlation between TK1 expression and T stages. (C) Protein expression level of TK1 from the CPTAC database. *p < 0.05; **p < 0.01; ***p < 0.001; ****p < 0.0001
Fig. 2
Fig. 2
The prognostic value of TK1 in pan-cancer. (A) Cox regression analysis of the OS in pan-cancer. (B) Cox regression analysis of the DSS in pan-cancer. The OS (C) and DSS (D) Kaplan-Meier survival curves
Fig. 3
Fig. 3
The diagnostic value of TK1 in pan-cancer. (A) The ROC curve of diagnosis to distinguish tumor from normal tissue. (B) Nomogram model, integrating clinicopathologic factors and TK1 level to predict overall survival probability at 1-, 3-, and 5-years in HCC. (C) The calibration curve of the nomogram
Fig. 4
Fig. 4
Functional enrichment and single-cell sequencing analysis of TK1 in LIHC. (A) GO and KEGG pathway analyses. (B) GSEA analysis. (C) The expression level of TK1 across various cell types in 7 independent single-cell sequencing datasets of LIHC. (D) TK1 expression visualization among different types of cells in LIHC_GSE125499 and LIHC_GSE166635. (E-F) Heatmaps of the correlation between TK1 expression and cell cycle related genes. *p < 0.05; **p < 0.01; ***p < 0.001
Fig. 5
Fig. 5
TK1 promotes the proliferation of HCC cells by regulating cell cycle. (A) The expression level of TK1 in paired HCC tumor samples. (B) Immunohistochemical results and immunohistochemical staining scores of TK1 in patients with HCC and paraneoplastic tissue. (C) The expression level of TK1 in different HCC cell lines. (D) Validation of the transfection efficiency in Hep-3B and Hep-G2 cells. (E) CCK-8 assay and (F) colony formation assay in Hep-3B and Hep-G2 cells. (G-H) Flow cytometry detected the cell cycle distribution in Hep-3B and Hep-G2 cells. *p < 0.05; **p < 0.01; ***p < 0.001
Fig. 6
Fig. 6
Correlation analysis of TK1 expression with immune infiltration in pan-cancer. Lollipop charts exhibited the correlation of TK1 with immune cell infiltration in LUAD (A), LIHC (B), CESC (C), MESO (D), GBMLGG (E), OSCC (F). (G) Correlation scatter plots showed the correlation of TK1 with Th2 cells infiltration in pan-cancer
Fig. 7
Fig. 7
TK1 in cancer cell promotes Jurkat cell polarization toward the Th2 phenotype. (A) Schematic illustration of co-culturing system. (B) IL-4 and IL-13 levels in culture medium from co-cultured Jurkat cells. (C-D) The relative mRNA expression of IL-4, IL-13, and GATA3 in Jurkat cells. (E) The protein expression level of GATA3 in Jurkat cells. (F-G) Representative histograms analyzed by flow cytometry and the percentages of Th2 cells within Jurkat cells. *p < 0.05; **p < 0.01; ***p < 0.001
Fig. 8
Fig. 8
CCL5 is the critical chemokine induced by TK1 in HCC cells to promote Th2 polarization. (A) The correlation between TK1 and 41 chemokines in the TCGA-LIHC database. (B) The relative mRNA expression of chemokines in shTK1 Hep-3B cells and oeTK1 Hep-G2 cells. (C) The level of CCL5 in culture medium from shTK1 Hep-3B cells and oeTK1 Hep-G2 cells. (D) The protein expression level of GATA3 in Jurkat cells. (E) Representative histograms analyzed by flow cytometry and the percentages of Th2 cells within Jurkat cells. *p < 0.05; **p < 0.01; ***p < 0.001

Similar articles

Cited by

References

    1. Merlo LM, Pepper JW, Reid BJ, Maley CC. Cancer as an evolutionary and ecological process. Nat Rev Cancer. 2006;6(12):924–35. - PubMed
    1. Xiao Y, Yu D. Tumor microenvironment as a therapeutic target in cancer. Pharmacol Ther. 2021;221:107753. - PMC - PubMed
    1. Chen C, Wang Z, Ding Y, Qin Y. Tumor microenvironment-mediated immune evasion in hepatocellular carcinoma. Front Immunol. 2023;14:1133308. - PMC - PubMed
    1. Joyce JA, Fearon DT. T cell exclusion, immune privilege, and the tumor microenvironment. Science. 2015;348(6230):74–80. - PubMed
    1. Ott PA, Hodi FS, Robert C. CTLA-4 and PD-1/PD-L1 blockade: new immunotherapeutic modalities with durable clinical benefit in melanoma patients. Clin Cancer Res. 2013;19(19):5300–9. - PubMed

LinkOut - more resources