. 2024 Sep 30;24(1):890.
doi: 10.1186/s12870-024-05595-3.

FEAtl: a comprehensive web-based expression atlas for functional genomics in tropical and subtropical fruit crops

Affiliations

FEAtl: a comprehensive web-based expression atlas for functional genomics in tropical and subtropical fruit crops

Anupama Roy et al. BMC Plant Biol. .

Abstract

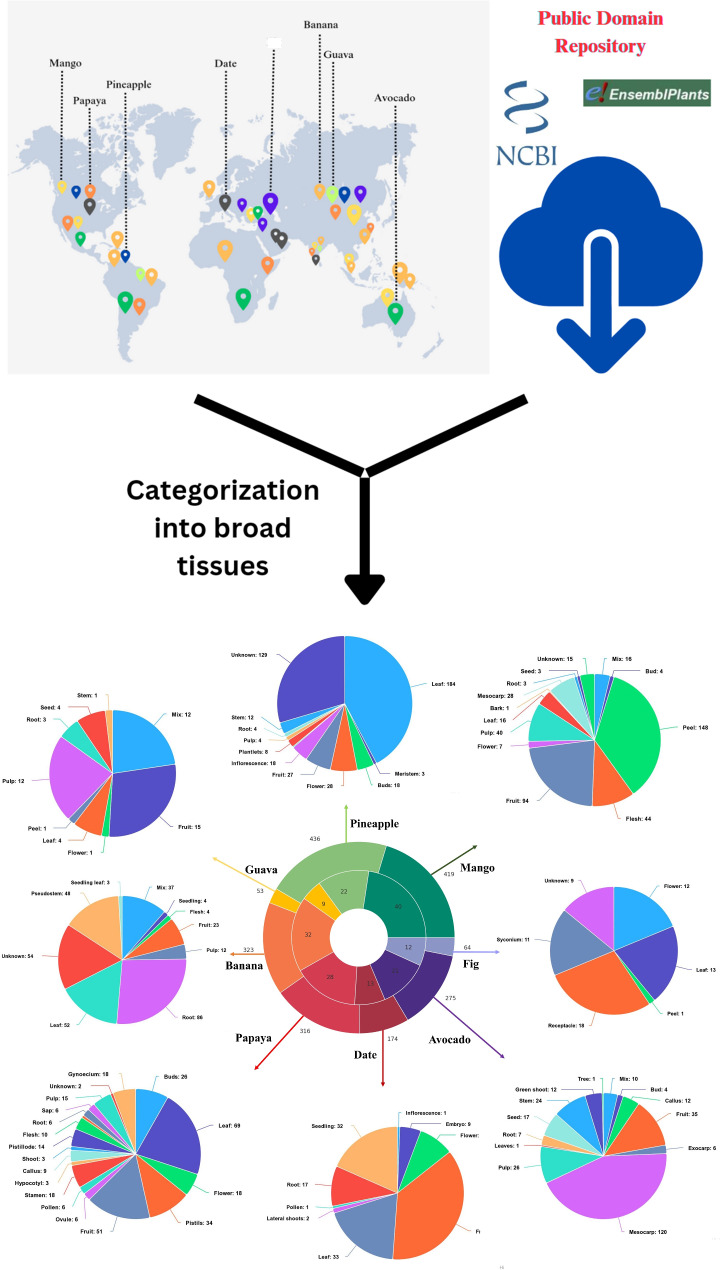
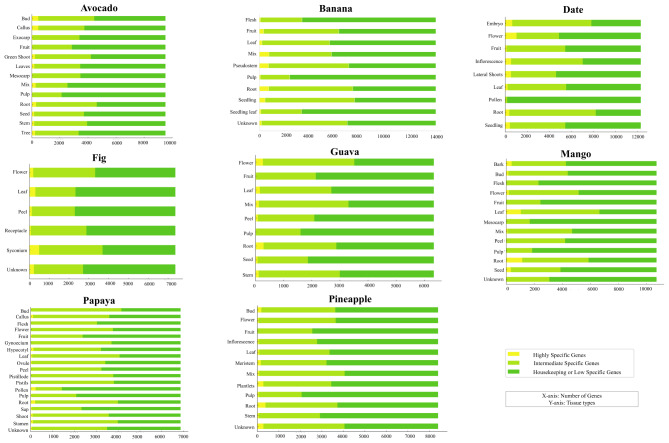
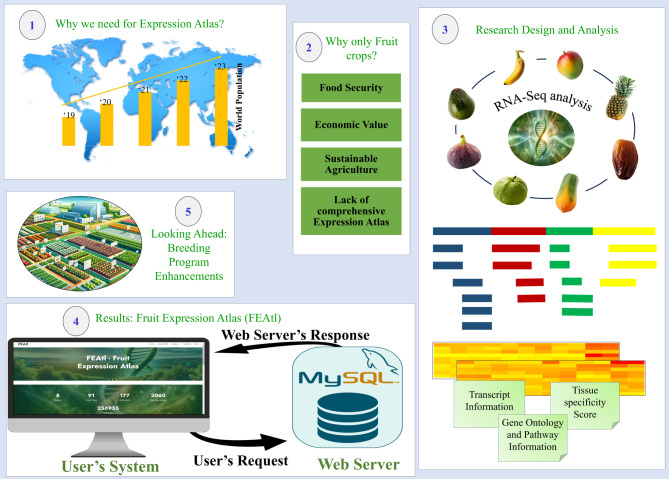
Background: Fruit crops, including tropical and subtropical fruits like Avocado (Persea americana), Fig (Ficus carica), Date Palm (Phoenix dactylifera), Mango (Mangifera indica), Guava (Psidium guajava), Papaya (Carica papaya), Pineapple (Ananas comosus), and Banana (Musa acuminata) are economically vital, contributing significantly to global agricultural output, as classified by the FAO's World Programme for the Census of Agriculture. Advancements in next-generation sequencing, have transformed fruit crop breeding by providing in-depth genomic and transcriptomic data. RNA sequencing enables high-throughput analysis of gene expression, and functional genomics, crucial for addressing horticultural challenges and enhancing fruit production. The genomic and expression data for key tropical and sub-tropical fruit crops is currently lacking a comprehensive expression atlas, revealing a significant gap in resources for horticulturists who require a unified platform with diverse datasets across various conditions and cultivars.

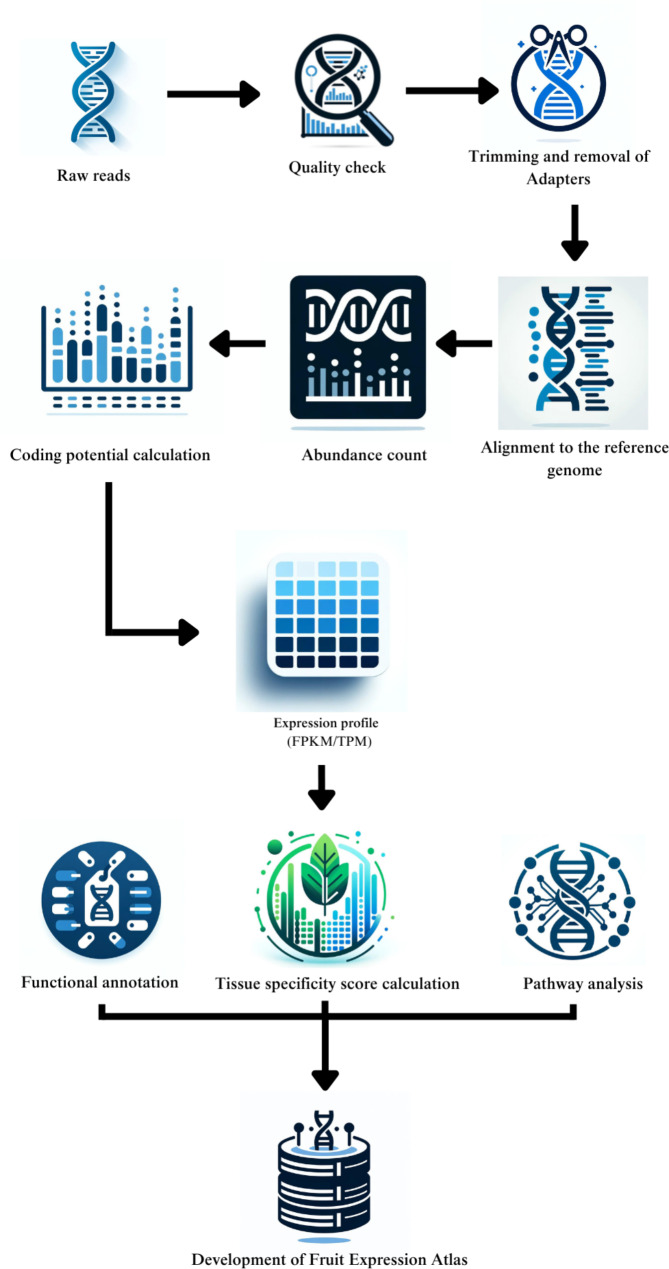
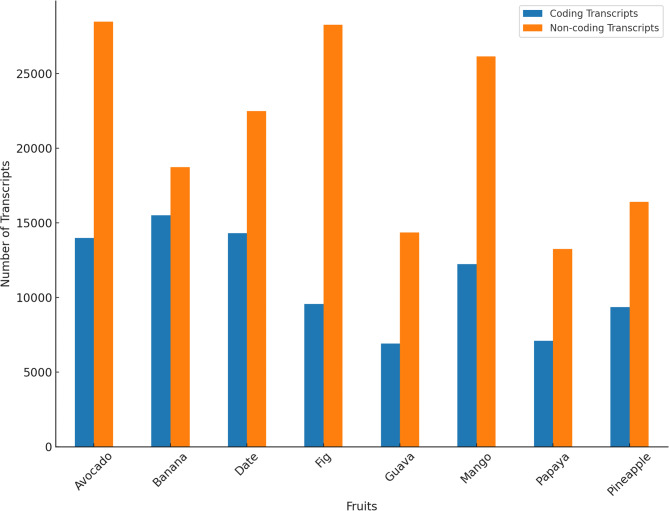
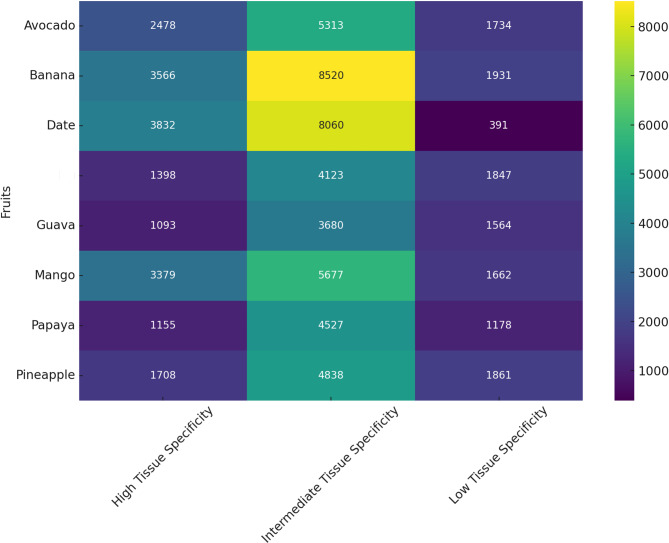
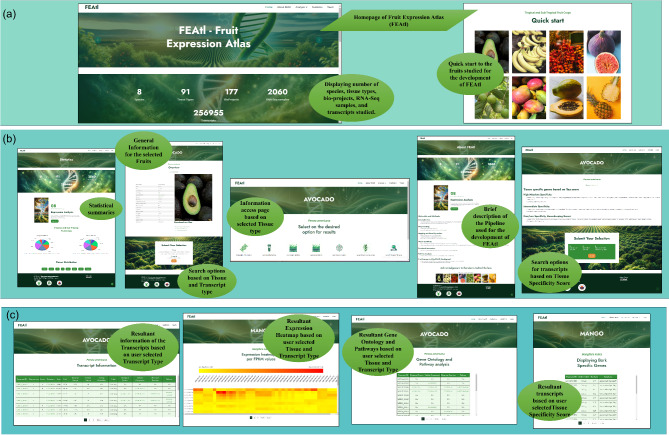
Results: The Fruit Expression Atlas (FEAtl), available at http://backlin.cabgrid.res.in/FEAtl/ , is a first-ever extensive and unified expression atlas for tropical and subtropical fruit crops developed using 3-tier architecture. The expressivity of coding and non-coding genes, encompassing 2,060 RNA-Seq samples across 91 tissue types and 177 BioProjects, it provides a comprehensive view of gene expression patterns for different tissues under various conditions. FEAtl features multiple tabs that cater to different aspects of the dataset, namely, Home, About, Analyze, Statistics, and Team and contains seven central functional modules: Transcript Information,Sample Information, Expression Profiles in FPKM and TPM, Functional Analysis, Genes Based on Tau Score, and Search for Specific Gene. The expression of a transcript of interest can be easily queried by searching by tissue ID and transcript type. Expression data can be displayed as a heat map, along with functional descriptions as well as Gene Ontology and Kyoto Encyclopedia of Genes and Genomes.

Conclusions: This atlas represents a groundbreaking compilation of a wide array of information pertaining to eight distinct fruit crops and serves as a fundamental resource for comparative analysis among different fruit species and is a catalyst for functional genomic studies. Database availability: http://backlin.cabgrid.res.in/FEAtl/ .

Keywords: Expression atlas; Fruit crops; Functional genomics; Gene expression; Genomics; Horticultural challenges; Transcriptomics.


Conflict of interest statement

The authors declare no competing interests.

Figures

Fig. 1
Fig. 1
Global distribution and tissue categorization of RNA-seq data from fruit crop species: This figure presents a global overview of RNA-seq data obtained from public domain repositories, symbolized by distinctive icons representing various species, as annotated on the world map. Data sets are geographically pinpointed to illustrate the worldwide collection effort. Subsequently, the figure details the categorization of this data into broad tissue types for each species, using multi-colored pie charts for a comparative visual of tissue representation. This breakdown provides insight into the relative composition of tissue-specific sequences within each plant species’ RNA-seq data. Data was compiled from repositories including NCBI and EnsemblPlants
Fig. 2
Fig. 2
Pipeline for the construction of the fruit expression atlas: This figure outlines the state-of-the-art methodology employed to construct the Fruit Expression Atlas. The workflow commences with raw reads subjected to a rigorous quality check before trimming and removal of adapters. The processed reads are then aligned to the reference genome, followed by the quantification of gene expression levels, represented by FPKM/TPM metrics. This foundation supports subsequent steps including the calculation of coding potential, abundance count, functional annotation, and tissue specificity scoring. The final stages involve functional and pathway analysis, as well as tissue-specificity scoring, ultimately resulting in the creation of the comprehensive Fruit Expression Atlas
Fig. 3
Fig. 3
Comparative analysis of coding and non-coding transcript abundance in fruit genomes: This bar graph depicts the quantity of coding (blue) and non-coding (orange) transcripts in a range of fruit species. The vertical axis represents the number of transcripts, illustrating the genetic diversity and expression profile within each fruit’s transcriptome. The data highlights the variation in transcript abundance, providing insights into the complexity of gene regulation in species
Fig. 4
Fig. 4
Pan- tissue categories of gene expression in fruit species: Represents a heatmap indicating the number of genes with varying levels of tissue specificity across different fruits, calculated using the tau index. High tissue specificity genes (tau index 0.8–1.0), intermediate specificity genes (tau index 0.2–<0.8), and low specificity genes (tau index 0–<0.2)
Fig. 5
Fig. 5
Tissue specific categories of gene expression in fruit species: Displays bar graphs for each fruit, categorizing genes into high, intermediate, and low tissue-specific expressions within specific tissue types. The color-coding of bars—yellow for highly or absolutely specific genes, light green for intermediate specific genes, and green for non-specific or low-specific genes—enables a clear visual differentiation of expression patterns
Fig. 6
Fig. 6
Screenshots illustrating the interface and capabilities of the fruit expression atlas (FEAtl). (a) Homepage of the FEAtl database, highlighting the number of species, tissue types, bio-projects, and RNA-Seq samples available for query. This section also provides a quick start guide to the fruits studied for the development of FEAtl. (b) Detailed information and search page, showcasing the general information for the selected fruits, search options based on tissue and transcript type, statistical summaries, and tools for expression analysis. It includes access pages for specific tissue types and descriptions of the pipeline used in the development of FEAtl. (c) Resultant page, displaying representative results for gene expression queries focusing on specific tissues and transcripts. Output formats include detailed transcript information, expression heatmaps based on FPKM values, gene ontology, and pathway analysis, as well as tissue specificity scores for selected fruits
Fig. 7
Fig. 7
Comprehensive fruit expression atlas (FEAtl) for tropical and subtropical fruit crops: This figure illustrates the significance and utility of the Fruit Expression Atlas (FEAtl), an extensive and unified platform for analyzing gene expression in key tropical and subtropical fruit crops. The various panels highlight: (1) Why We Need an Expression Atlas? The growing global population emphasizes the need for improved agricultural productivity. (2) Why Only Fruit Crops? - The focus on fruit crops is due to their crucial roles in food security, economic value, sustainable agriculture, and the current lack of a comprehensive expression atlas. (3) Research Design and Analysis - RNA-Seq analysis is performed on a variety of fruit crops to provide detailed gene expression profiles. (4) Results: Fruit Expression Atlas (FEAtl) - Demonstrates the workflow and architecture of FEAtl, showcasing the interaction between the user’s system and the web server to access and analyze extensive gene expression data. (5) Looking Ahead: Breeding Program Enhancements - Future applications of FEAtl aim to enhance breeding programs and improve fruit crop yields through advanced genomic research. FEAtl serves as a vital resource for horticulturists and researchers, enabling a comprehensive understanding of gene expression in fruit crops under various conditions

Similar articles

References

    1. Krishnaswamy K, Gayathri R. Nature’s bountiful gift to humankind: vegetables & fruits & their role in cardiovascular disease & diabetes. Indian J Med Res. 2018;148(5):569–95. - PMC - PubMed
    1. Singh KM, Ahmad N, Pandey VL, Sinha DK. Impact of National Horticulture Mission on Vegetable and Fruit sectors of India. Indian J Econ Dev. 2022;66–75.
    1. Savo V, Kumbaric A, Caneva G. Grapevine (Vitis vinifera L.) Symbolism in the ancient Euro-Mediterranean cultures. Econ Bot. 2016;70(2):190–7.
    1. Alae-Carew C, Bird FA, Choudhury S, Harris F, Aleksandrowicz L, Milner J, et al. Future diets in India: a systematic review of food consumption projection studies. Glob Food Sect. 2019;23:182–90. - PMC - PubMed
    1. Boeing H, Bechthold A, Bub A, Ellinger S, Haller D, Kroke A, et al. Critical review: vegetables and fruit in the prevention of chronic diseases. Eur J Nutr. 2012;51(6):637–63. - PMC - PubMed

LinkOut - more resources