. 2024 Sep 30;20(1):151.
doi: 10.1186/s13007-024-01277-1.

An automated phenotyping method for Chinese Cymbidium seedlings based on 3D point cloud

Affiliations

An automated phenotyping method for Chinese Cymbidium seedlings based on 3D point cloud

Yang Zhou et al. Plant Methods. .

Abstract

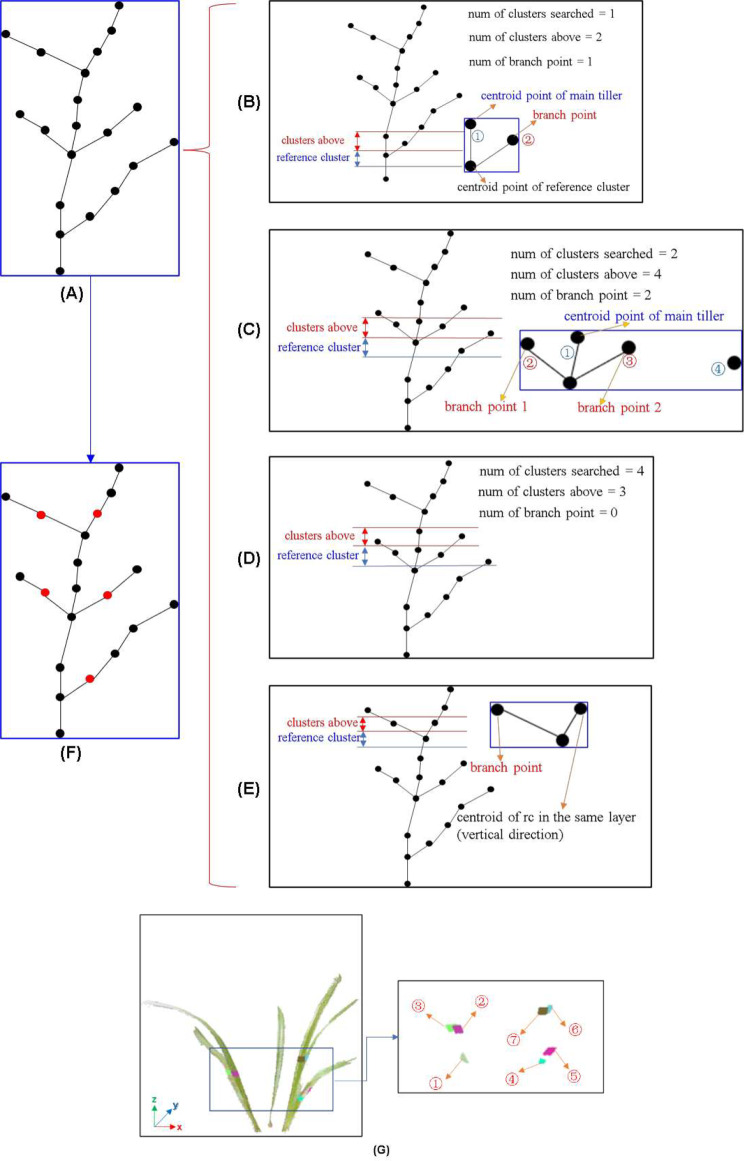
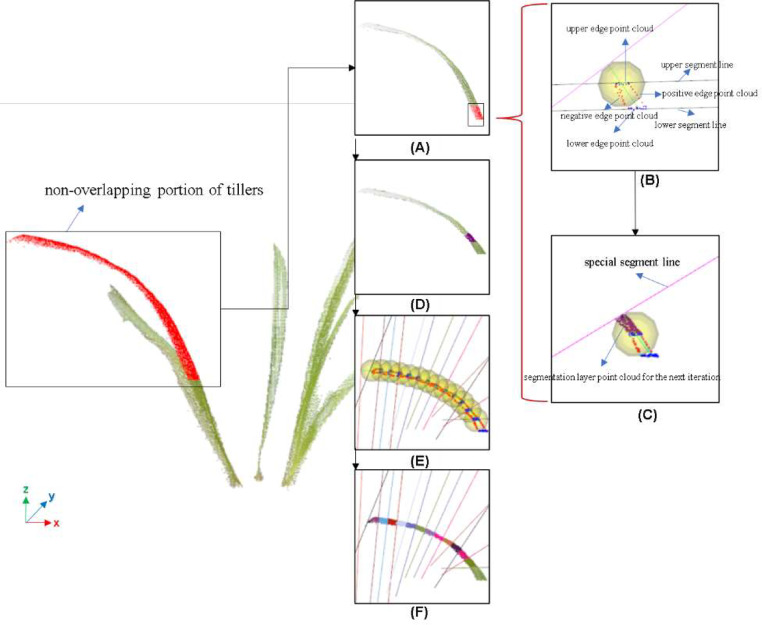
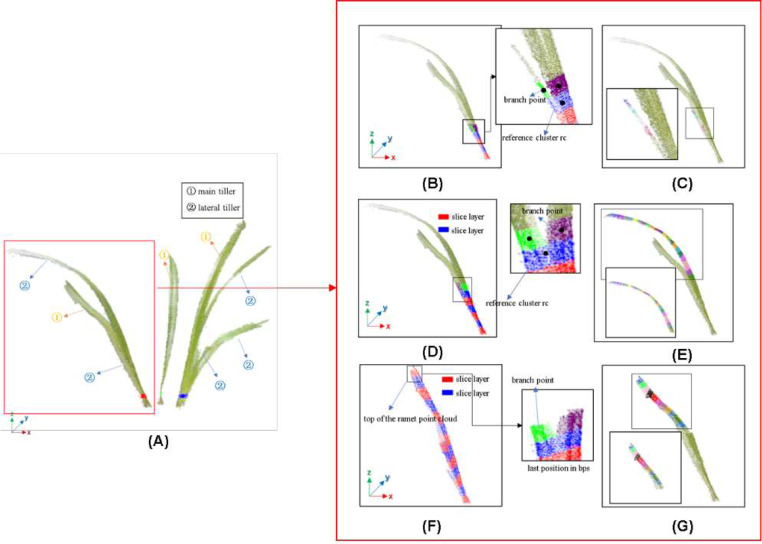
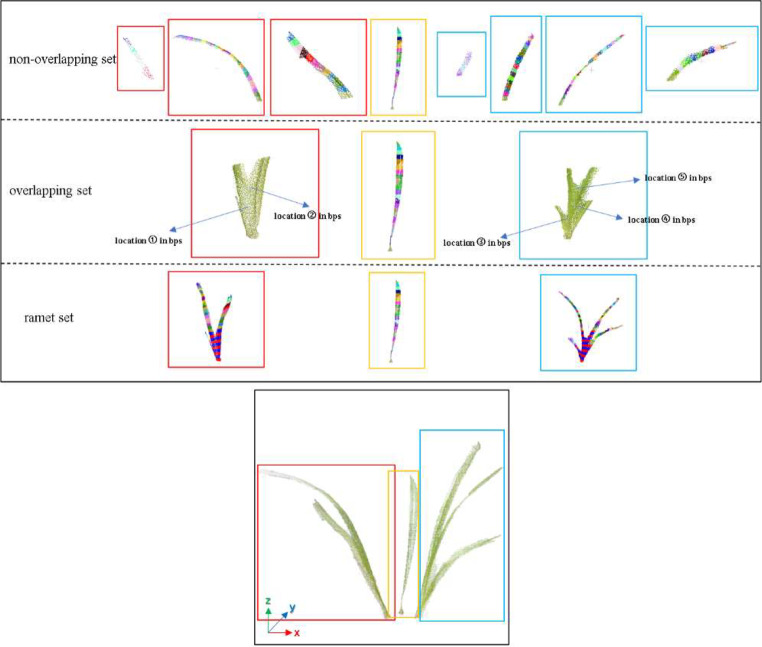
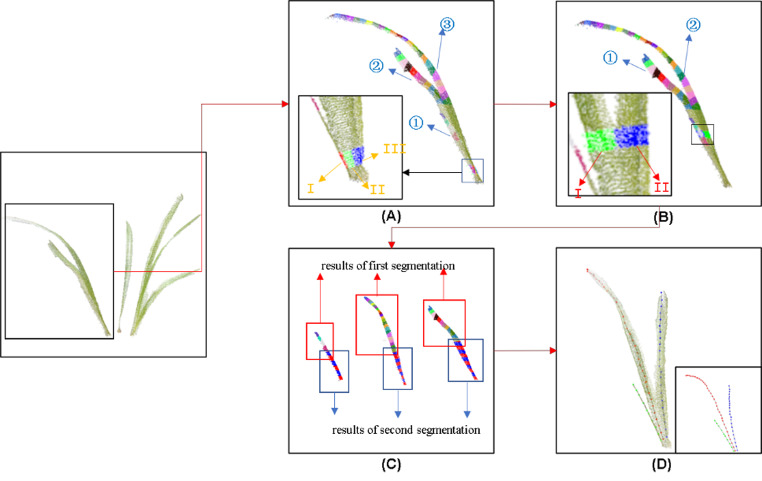
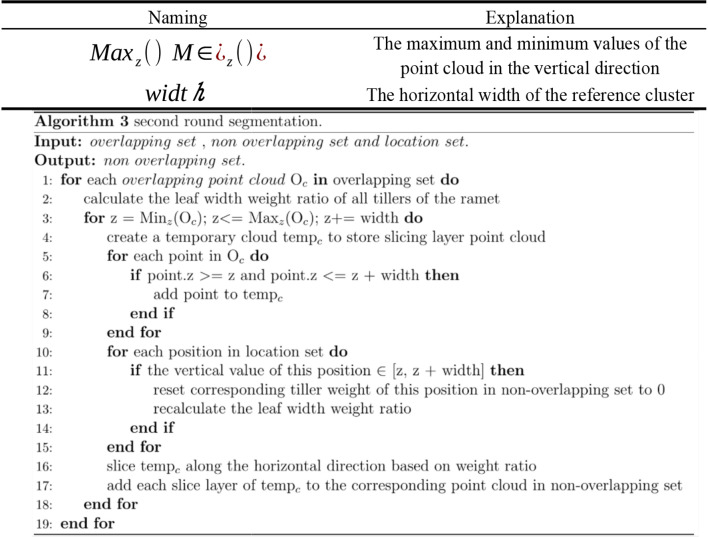
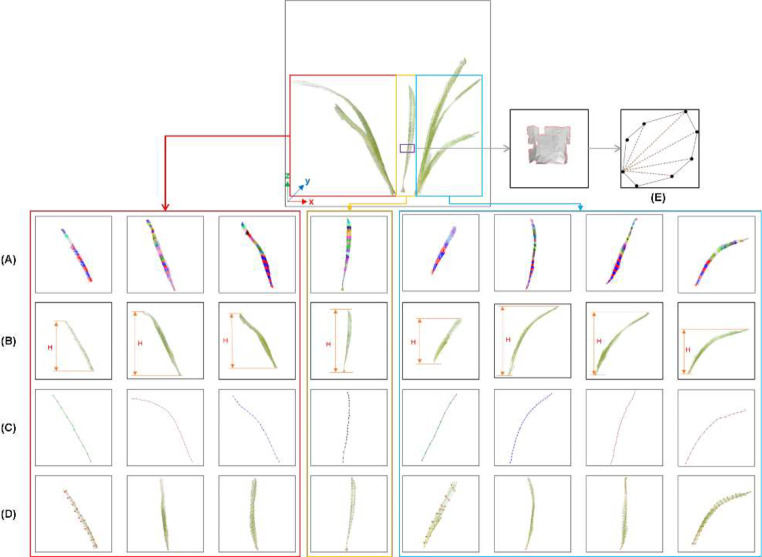
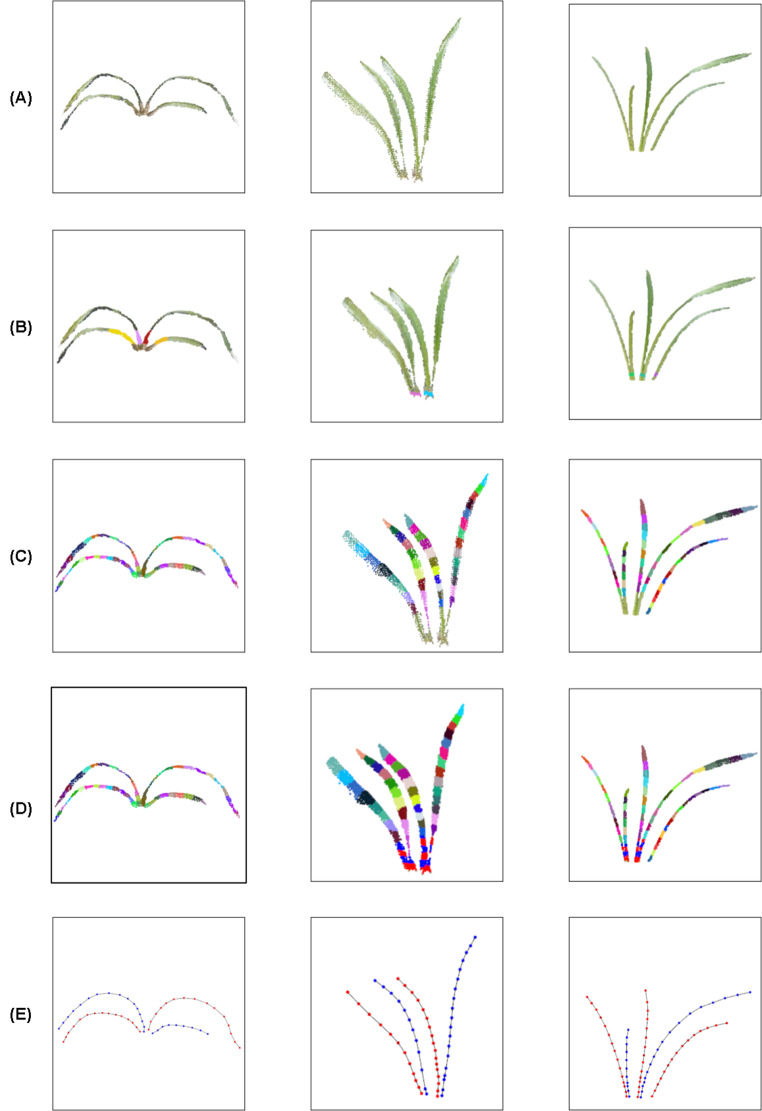
Aiming at the problems of low efficiency and high cost in determining the phenotypic parameters of Cymbidium seedlings by artificial approaches, this study proposed a fully automated measurement scheme for some phenotypic parameters based on point cloud. The key point or difficulty is to design a segmentation method for individual tillers according to the morphology-specific structure. After determining the branch points, two rounds of segmentation schemes were designed. The non-overlapping part of each tiller and the overlapping parts of each ramet are separated in the first round based on the edge point cloud-based segmentation, while in the second round, the overlapping part was sliced along the horizontal direction according to the weight ratio of the tillers above, to obtain the complete point cloud of all tillers. The core superiority of the algorithm is that the segmentation fits the tiller growth direction well, and the extracted skeleton points of tillers are close to the actual growth direction, significantly improving the prediction accuracy of the subsequent phenotypic parameters. Five phenotypic parameters, plant height, leaf number, leaf length, leaf width and leaf area, were automatically calculated. Through experiments, the accuracy of the five parameters reached 98.6%, 100%, 92.2%, 89.1%, and 82.3%, respectively, which reach the needs of various phenotypic applications.

Keywords: 3D point cloud data; Chinese Cymbidium; Phenotyping; Segmentation.


Conflict of interest statement

The authors declare no competing interests.

Figures

Fig. 1
Fig. 1
Point cloud preprocessing. (A) RGB image of Cymbidium. (B) Depth image of Cymbidium. (C) point cloud of Cymbidium. (D) Point cloud after background removed. (E) The soil plane marked in red for removal. (F) The voxels of flying noise marked in red. (G) 0-degree registered point cloud. (H) 180-degree registered point cloud
Fig. 2
Fig. 2
Slicing skeleton method. (A) Distinction between ramets and tillers. Different colors represent different ramets, and the tillers of each ramet are numbered with different numbers. (B) Vertical slicing. Each slice layer is distinguished by red or blue colors. (C) Skeleton connection through using traditional slicing method. In ① and ②, the wrong connection is marked in orange. In ③, the black slice layer is a slice layer along the vertical direction, and the orange slice layer is the actual slice layer. In ④, the red points represent the skeleton point predicted by the slicing skeleton method, and the purple points represent the actual skeleton point
Fig. 3
Fig. 3
Classification of main tiller and lateral tillers of Cymbidium. ① the main tiller, ② the lateral tiller. The initial clustering clusters of the three ramets are marked with red, green and blue colors, respectively
Fig. 4
Fig. 4
Algorithm for branch point determination
Fig. 5
Fig. 5
The above searched clusters. Euclidean cluster on the slice layer point cloud above the reference cluster and five clusters are obtained, the ① and ② are the clusters searched above the reference cluster. ③, ④, and ⑤ are the cluster where other tillers are located
Fig. 6
Fig. 6
Branch point determination. (A) Centroid point connection of ramets. (B) Num of clusters above is greater than the num of cluster searched, one branch point exists. (C) Num of clusters above is greater than the num of cluster searched, two branch point exist. (D) Num of clusters is less than the num of cluster searched, and there is no branch point. (E) Num of clusters above is zero. Return to the position of the last branch point. (F) Branch points of a ramet. The red points represent branch points, and the coordinates of branch points are recorded in the branch position set. (G) The cluster where all the branch points are located. There are seven branch points in the plant
Fig. 7
Fig. 7
Algorithm for first round segmentation
Fig. 8
Fig. 8
non-overlapping part segmentation. (A) The initial cluster was marked in red. (B) The blue point cloud: the upper and lower edges. The red part: the positive and negative edges. The black lines: the upper and lower segment line. The green line: the connecting line. (C) Special segment line is marked in purple. (D) The cluster of the next round to be segmented is marked in purple. (E) Segment lines in each round. (F) Segmentation of non-overlapping part. Each searched cluster is distinguished by different colors
Fig. 9
Fig. 9
First round segmentation. (A) The ramet where the red box is located is the discussed ramet. (B) The cluster marked in blue is the reference cluster rc. The cluster marked in green is the initial cluster of non-overlapping parts to be segmented. (C) The non-overlapping part of the first tiller, each segmented cluster is represented by different colors. (D) The cluster marked in blue is the reference cluster rc. The cluster marked in purple is the initial cluster of non-overlapping parts to be segmented. (E) The non-overlapping part of the second tiller, each segmented cluster is represented by different colors. (F) The top red cluster is the cluster where the highest point in Y-axis of the ramet is located. The cluster marked in green is the initial cluster of non-overlapping parts of the last tiller to be segmented. (G) The non-overlapping part of the last tiller, each segmented cluster is represented by different colors
Fig. 10
Fig. 10
Display of all elements in of non-overlapping set, overlapping set and branch position set. Three colors, including red, orange and blue, were used to represent three ramets respectively. ① to ⑤ represent the five positions of the branch position set respectively
Fig. 11
Fig. 11
Boundary point cloud extraction. (A) Boundary point extraction. The boundary points are marked in red, but these boundary points include inner ring edge points. (B) Triangular mesh of the outer boundary, and the outer boundary points are connected by red lines. (C) An outer boundary point cloud, and the outer boundary points are connected by red lines. (D) Outer edge points
Fig. 12
Fig. 12
Algorithm for second round segmentation
Fig. 13
Fig. 13
Second round segmentation. (A) Slice layers horizontally according to the weight ratio and add them to the corresponding tiller non-overlapping point cloud according to the corresponding sequence number. The red, green and blue clusters correspond to the non-overlapping parts of ①, ② and ③ respectively. (B) One tiller has been segmented, only two tillers are considered. The green and blue clusters correspond to the non-overlapping parts of ① and ② respectively. (C) The complete point cloud of all tillers is combined by the segmented point clouds of the first round of segmentation and the second round of segmentation. The red frame and the blue frame represent the segmentation results of the first round and the second round respectively. (D) The skeleton point connection, with red, blue and green colors represent the skeleton point of each tiller. (E) The skeleton point connection of all tillers of each ramet, and the skeleton point connection of all tillers of each ramet is distinguished by different color block diagrams. (F) The skeleton point connection of the whole plant
Fig. 14
Fig. 14
Morphological trait extraction. (A) Point cloud of each tiller. The red, orange, and blue block diagrams represent all tillers of the first, second, and third ramets, respectively. (B) Height H of each tiller, and the highest H as the estimated value of plant height. (C) The centroid connection of each tiller, and the sum of the distances of all centroid is the estimation value of leaf length. (D) The connections of the centroids on the positive and negative sides of each cluster of tillers. (E) The calculation method of the area of the internal hole or mesh, based on triangle meshes, the areas of all the meshes or holes are calculated
Fig. 15
Fig. 15
Procedure of tiller segmentation. (A) Preprocessed point cloud. (B) The number of ramets (initial cluster) determined. The initial cluster of each ramet was marked with different colors. (C) Results of first round of segmentation. The output is marked with different colors. (D) Results of second round of segmentation. The output is marked with red and blue colors. (E) The skeleton points of different tillers were recorded by red and blue colors
Fig. 16
Fig. 16
Comparison of four phenotypic parameters. In Figure. A, C, E and G, the red dotted line represents the line whose predicted value is equal to the actual value (r = 1), and the black line represents the fitted line. In Figure B, D, F, H, the blue group represents the predicted value, the orange group represents the actual value. Figures I, J, K, and L show the corresponding violin plot between the estimated and actual values
Fig. 17
Fig. 17
Bulb interference. (A) The bulbs of Cymbidium are marked in red. (B) The bulbs were sliced along the vertical direction, and 2D ellipse fitting was performed. From ① to ⑤, the projection of each slice layer is shown. The orange line is the short axis of the fitted ellipse
Fig. 18
Fig. 18
The tiller overlapping error analysis. (A) When the tillers overlap, the rest of the tillers will be mistakenly added to the next round of cluster. The part of the red mark is the wrong segmentation part. (B) Left, right, upper and lower segment lines are distinguished. (C) The actual cluster of current tillers, marked in red. (D) The cluster obtained by our proposed algorithm is marked in yellow

Similar articles

Cited by

References

    1. Zhou Z et al. Orchid conservation in China from 2000 to 2020: Achievements and perspectives. 2021. 43(5): pp. 343–349. - PMC - PubMed
    1. Xiao Q et al. Advanced high-throughput plant phenotyping techniques for genome-wide association studies: A review. 2022. 35: pp. 215–230. - PMC - PubMed
    1. Yasrab R, et al. Predicting plant growth from time-series data using deep learning. Remote Sens. 2021;13:331.
    1. Das Choudhury S, et al. Holistic and component plant phenotyping using temporal image sequence. Plant Methods. 2018;14:1–21. - PMC - PubMed
    1. Green JM, et al. PhenoPhyte: a flexible affordable method to quantify 2D phenotypes from imagery. Plant Methods. 2012;8:1–12. - PMC - PubMed

LinkOut - more resources