. 2024 Sep 30;9(1):256.
doi: 10.1038/s41392-024-01976-0.

Histone deacetylase inhibition enhances extracellular vesicles from muscle to promote osteogenesis via miR-873-3p

Affiliations

Histone deacetylase inhibition enhances extracellular vesicles from muscle to promote osteogenesis via miR-873-3p

Ming Chen et al. Signal Transduct Target Ther. .

Abstract

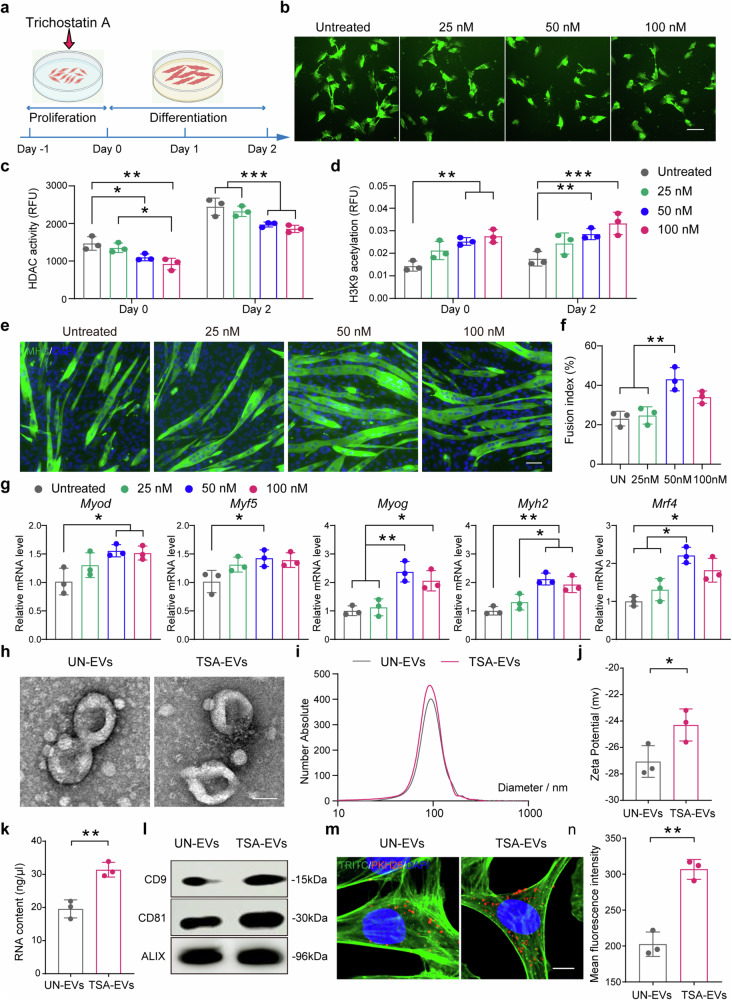
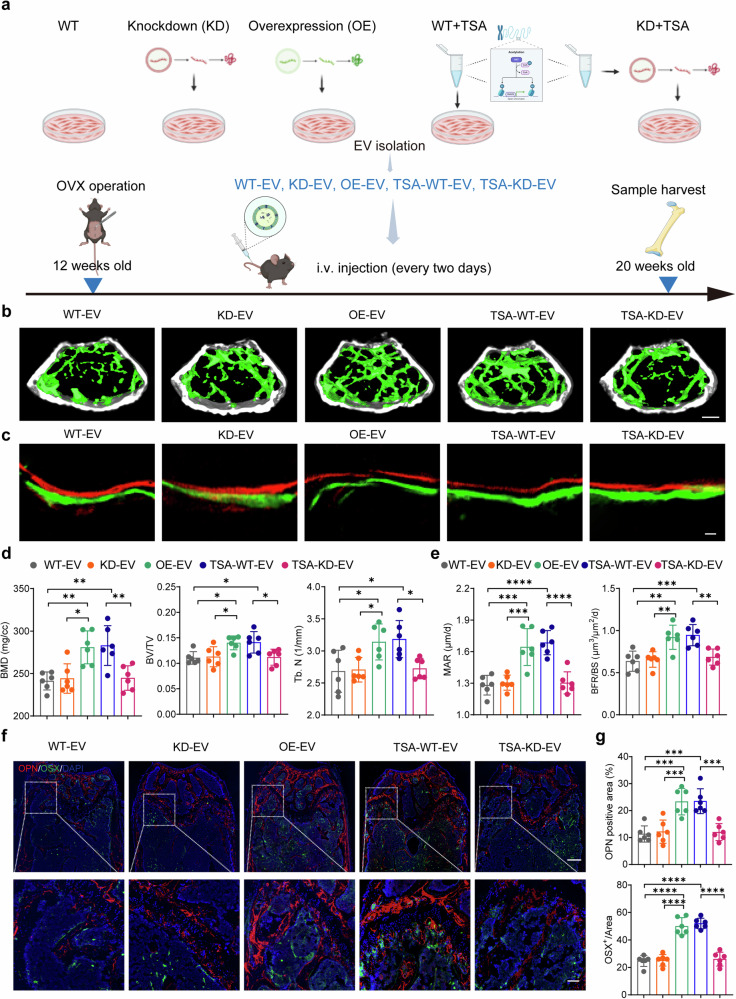
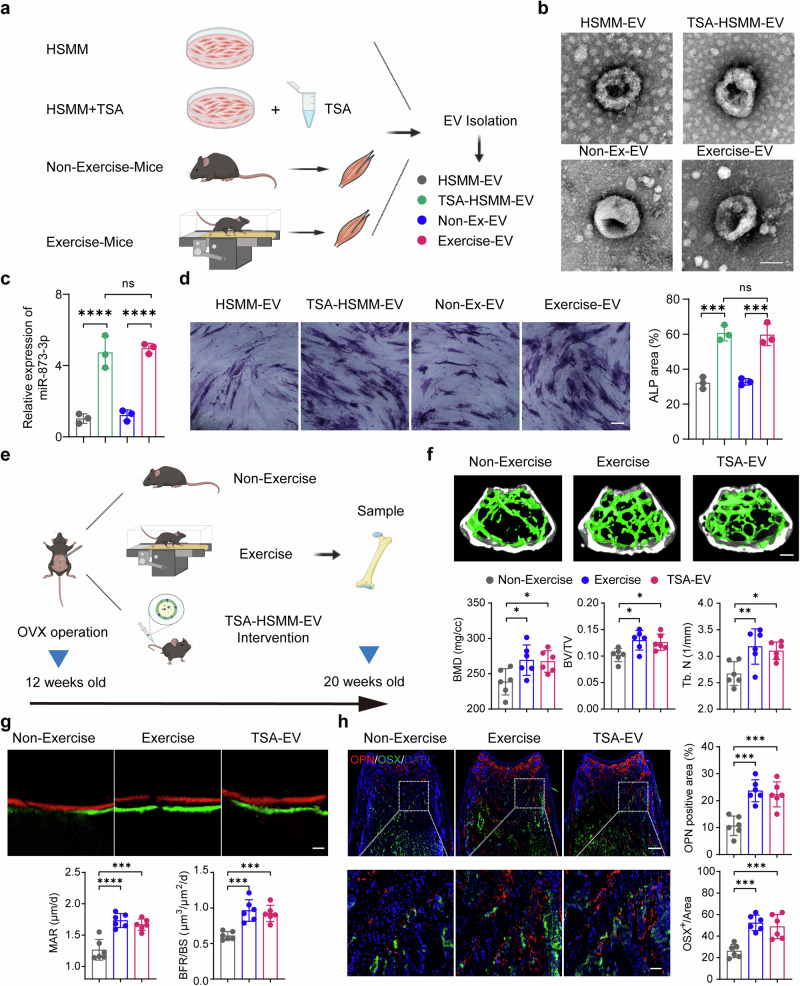
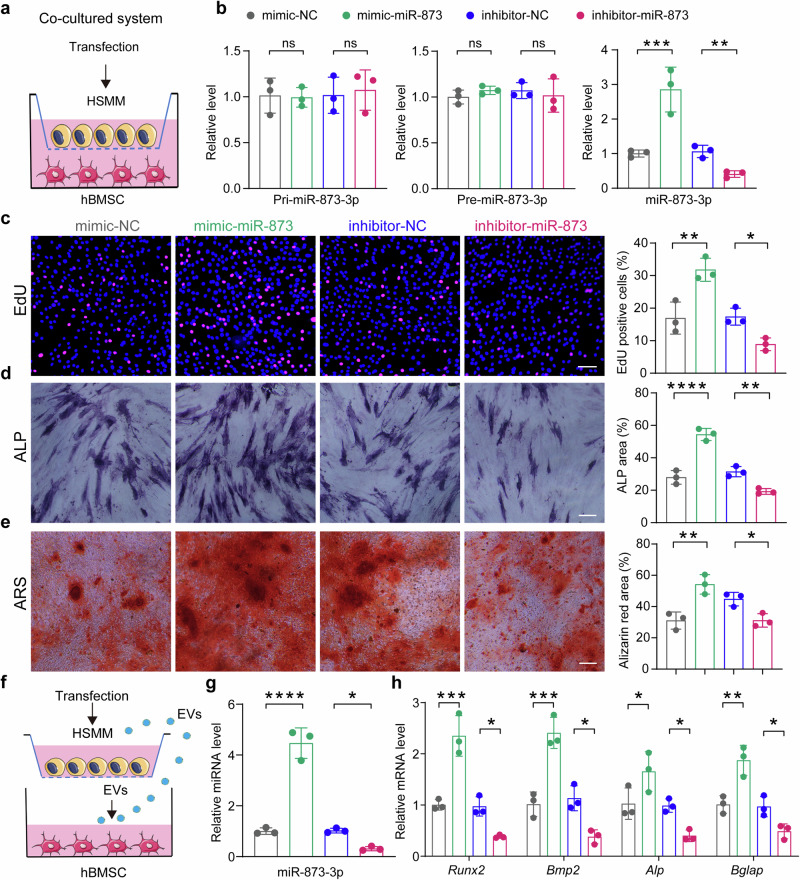
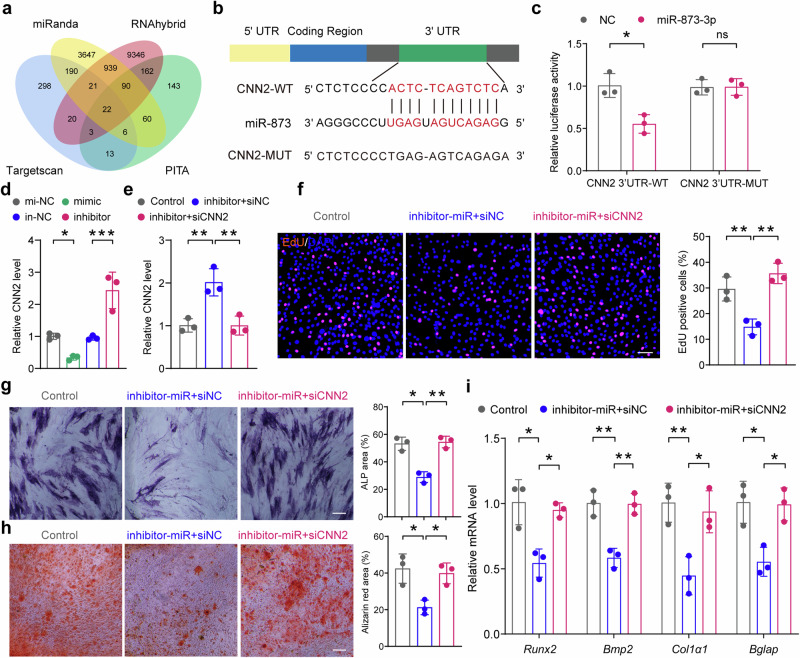
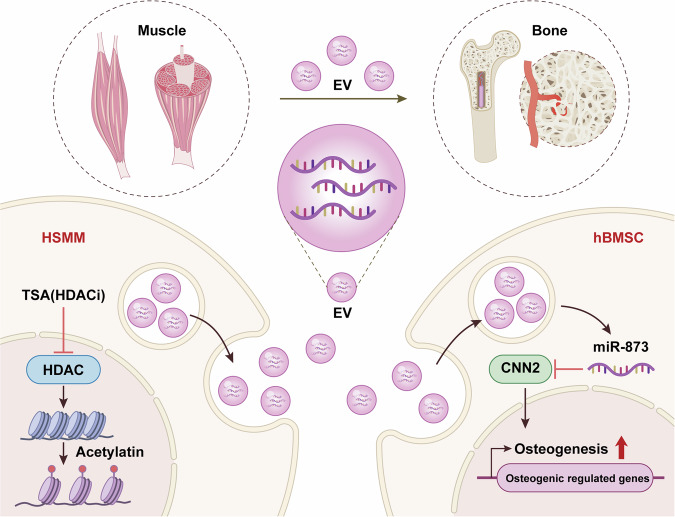
Regular physical activity is widely recognized for reducing the risk of various disorders, with skeletal muscles playing a key role by releasing biomolecules that benefit multiple organs and tissues. However, many individuals, particularly the elderly and those with clinical conditions, are unable to engage in physical exercise, necessitating alternative strategies to stimulate muscle cells to secrete beneficial biomolecules. Histone acetylation and deacetylation significantly influence exercise-induced gene expression, suggesting that targeting histone deacetylases (HDACs) could mimic some exercise responses. In this study, we explored the effects of the HDAC inhibitor Trichostatin A (TSA) on human skeletal muscle myoblasts (HSMMs). Our findings showed that TSA-induced hyperacetylation enhanced myotube fusion and increased the secretion of extracellular vesicles (EVs) enriched with miR-873-3p. These TSA-EVs promoted osteogenic differentiation in human bone marrow mesenchymal stem cells (hBMSCs) by targeting H2 calponin (CNN2). In vivo, systemic administration of TSA-EVs to osteoporosis mice resulted in significant improvements in bone mass. Moreover, TSA-EVs mimicked the osteogenic benefits of exercise-induced EVs, suggesting that HDAC inhibition can replicate exercise-induced bone health benefits. These results demonstrate the potential of TSA-induced muscle-derived EVs as a therapeutic strategy to enhance bone formation and prevent osteoporosis, particularly for individuals unable to exercise. Given the FDA-approved status of various HDAC inhibitors, this approach holds significant promise for rapid clinical translation in osteoporosis treatment.


Conflict of interest statement

The authors declare no competing interests.

Figures

Fig. 1
Fig. 1
The effects of HDAC inhibition on human myoblasts functionality and EV secretion. a Graphical scheme of the experimental workflow. b Cell viability and morphology assessment by live/dead assay. Scale bar: 100 μm (n = 3 per group). c, d HDAC activity (c) and H3K9 histone acetylation (d) in a time-dose-dependent manner (n = 3 per group). e, f Myogenic differentiation of HSMMs measured by immunocytochemistry using an anti-MHC antibody (e) and the corresponding quantitative analysis (f). Scale bar: 50 μm (n = 3 per group). g Myogenic gene expression analysis in differentiating HSMMs using qPCR (n = 3 per group). qPCR results are presented as fold change relative to control. h TEM images of UN-EVs and TSA-EVs. Scale bar:50 nm. i Particle size distribution of isolated EV samples from NTA. j Zeta potential analysis. k EV RNA quantification. l Western blot analysis of EV markers. m, n Representative images (m) and quantifications (n) of the uptake of UN-EVs and TSA-EVs by hBMSCs. Scale bar: 10 μm (n = 3 per group). All data are presented as the mean ± SD. *p < 0.05; **p < 0.01; ***p < 0.001. Statistical significance was determined by one-way ANOVA test (c, d, f, g) and two-tailed Welch’s t test (j, k, n)
Fig. 2
Fig. 2
Trichostatin A (TSA)-EVs prevents ovariectomized (OVX)-induced bone loss. a, b Representative in vivo fluorescence images (a) and the quantification analysis (b) of the posterior limbs in 8-week C57BL/6J mice at the indicated time points after a single tail vein injection of free dye and EVs (n = 3 per group). c Representative fluorescence imaging of different organs in 8-week C57BL/6J mice 24 h after a single tail vein injection of free dye and EVs (n = 3 per group). d Quantification analysis of fluorescence in bone tissues harvested from mice (n = 3 per group). e Scheme showing that female C57BL/6 mice at 12-week-old received ovariectomy and then consecutive intravenous injections every two days with PBS, UN-EVs, and TSA-EVs for a total of 8 weeks. After treatment, mice were sacrificed, and femurs were harvested for further evaluation. f Representative micro-CT images of trabecular bone in the femur in 20-week C57BL/6J mice. Scale bar: 400 μm. g Micro-CT qualifications of BMD, BV/TV, Tb.Th, Tb.N, and Tb.Sp (n = 6 per group). hi Representative images (h) of new bone formation at distal femur metaphysis assessed by bone histomorphometry analysis (i) of the differences in MAR and BFR/BS at distal femur across the three groups (n = 6 per group). Scale bar: 25 μm. j, k Representative images (j) of OSX (green) and OPN (red) immunostainings and quantification (k) of OSX+ and OPN+ area on distal femurs (n = 6 per group). Scale bar: 300 μm and 50 μm, respectively. All data are presented as the mean ± SD. *p < 0.05; **p < 0.01; ***p < 0.001; ****p < 0.0001. Statistical significance was determined by one-way ANOVA test
Fig. 3
Fig. 3
TSA-induced hyperacetylation promotes hBMSC activity and alters the microRNA profile of HSMM-derived EVs. a Cell proliferation of hBMSCs assessed by EdU staining. Scale bar: 100 μm (n = 3 per group). b Representative images of ALP staining of hBMSCs (left) and the corresponding quantitative analysis (right). Scale bar: 150 μm (n = 3 per group). c Representative images of ARS staining of hBMSCs (left) and the corresponding quantitative analysis (right). Scale bar: 150μm (n = 3 per group). d qPCR analysis of osteogenic markers Alp, Bglap, Col1a1, Spp1, and Bmp2 after 14 days of osteogenic induction (n = 3 per group). e Venn diagram comparing microRNAs differentially expressed from TSA-EVs and UN-EVs. f Volcano plot showing the differentially expressed miRNAs from TSA-EVs and UN-EVs. g Hierarchical clustering analysis of microRNAs that were differentially expressed between TSA-EVs and UN-EVs (n = 3 per group). h Differentially expressed miRNAs were subjected to gene ontology (GO) and Kyoto Encyclopedia of Genes and Genomes (KEGG) pathways analysis. i Validation of the top five elevated miRNAs including hsa-miR-589-3p, hsa-miR-873-3p, hsa-miR-6514-5p, hsa-miR-656-5p and hsa-miR-96-5p between TSA-EVs and UN-EVs using qPCR (n = 3 per group). j The relative expression level of miR-873 in myoblasts transfected with miR-873 mimics, miR-873 inhibitor, or their negative control group (n = 3 per group). k The relative expression level of miR-873 in EVs derived from myoblasts transfected with miR-873 mimics, miR-873 inhibitor, or their negative control (n = 3 per group). qPCR results are presented as fold change relative to control. All data are presented as the mean ± SD. *p < 0.05; **p < 0.01; ***p < 0.001; ****p < 0.0001. Statistical significance was determined by one-way ANOVA test
Fig. 4
Fig. 4
TSA-EV-shuttled miR-873-3p from muscle promotes bone regeneration. a The female C57BL/6 mice at 12-week-old received ovariectomy and then consecutive intravenous injections every two days with EVs purified from untreated WT HSMMs (WT-EV), miR-873-3p knockdown HSMMs (KD-EV), miR-873-3p overexpressing HSMMs (OE-EV), TSA-treated WT HSMMs (TSA-WT-EV) and TSA-treated miR-873-3p knockdown HSMMs (TSA-KD-EV) for a total of 8 weeks. After treatment, mice were sacrificed, and femurs were harvested for further evaluation. b Representative micro-CT images of trabecular bone in the femur in 20-week C57BL/6J mice. Scale bar: 400 μm. c Representative images of new bone formation at distal femur metaphysis assessed by bone histomorphometry analysis. Scale bar: 25 μm. d Qualifications of BMD, BV/TV and Tb.N after indicated treatments using the micro-CT images in b (n = 6 per group). e Quantitative analysis of BFR/BS and MAR in (c) (n = 6 per group). f, g Representative images (f) of OSX (green) and OPN (red) immunostainings and quantifications (g) on distal femurs (n = 6 per group). Scale bar: 300 μm and 50 μm, respectively. All data are presented as the mean ± SD. *p < 0.05; **p < 0.01; ***p < 0.001; ****p < 0.0001. Statistical significance was determined by one-way ANOVA test
Fig. 5
Fig. 5
TSA-HSMM-EVs mimic the effects of exercise on bone formation. a Schematic representation of the experimental design. EVs were isolated from HSMMs, TSA-treated HSMMs, non-exercising OVX mice, and exercising OVX mice. EVs from each source were characterized and their effects on osteogenic differentiation and bone formation were evaluated. b Transmission electron microscopy (TEM) images of EVs isolated from HSMMs (HSMM-EV), TSA-treated HSMMs (TSA-HSMM-EV), non-exercising OVX mice (Non-Ex-EV), and exercising OVX mice (Exercise-EV). Scale bar: 50 nm. c Relative expression of miR-873-3p in EVs derived from different sources, as measured by qPCR (n = 3 per group). d ALP staining of hBMSCs treated with EVs from the different sources. Quantification of ALP-positive areas is shown on the right. Scale bar : 150 µm (n = 3 per group). e Schematic of the in vivo experimental setup. OVX mice were subjected to non-exercise, exercise, or TSA-HSMM-EV treatment, and bone samples were harvested at 20 weeks old. f Representative micro-CT images of the distal femur and quantification of BMD, BV/TV, and Tb.N in the three groups. Scale bar: 400 μm. (n = 6 per group). g Bone histomorphometry showing MAR and BFR/BS in the three groups. Scale bar: 25 µm (n = 6 per group). h Immunofluorescence staining for OPN and OSX in the distal femur. Quantification of OPN-positive and OSX-positive areas is shown on the right. Scale bar: 300 μm and 50 μm, respectively. (n = 6 per group). All data are presented as the mean ± SD. *p < 0.05; **p < 0.01; ***p < 0.001; ****p < 0.0001. Statistical significance was determined by one-way ANOVA test
Fig. 6
Fig. 6
Extracellular vesicle transfers HSMM-miR-873-3p to hBMSCs for dictating osteogenesis. a Schematic representation illustrating the design of the co-culture experiments. The hBMSCs were co-cultured with the HSMMs transfected with miR-873 mimics, miR-873 inhibitor, or their negative control group. b The relative expression analysis of pri-miR-873, pre-miR-873, and miR-873 in hBMSCs after co-culture with HSMMs for 24 h using qPCR (n = 3 per group). c Cell proliferation analysis of hBMSCs co-culture with HSMMs transfected with miR-873 mimics, miR-873 inhibitor, or their negative control group. Scale bar: 100μm (n = 3 per group) at 24 h after co-culture. d Representative images of ALP staining of hBMSCs (left) and the corresponding quantitative analysis (right). Scale bar: 150 μm (n = 3 per group). e Representative images of ARS staining of hBMSCs (left) and the corresponding quantitative analysis (right). Scale bar: 150 μm (n = 3 per group). f, g Schematic representation (f) and analysis (g) of miR-873 expression levels in hBMSCs after treated by different transfected HSMMs’ EVs at 50 μg/ml for 24 h (n = 3 per group). h qPCR analysis of osteogenic markers Runx2, Bmp2, Alp and Bglap in hBMSCs after co-culture with HSMMs at 48 h after co-culture (n = 3 per group). qPCR results are presented as fold change relative to control. All data are presented as the mean ± SD. *p < 0.05; **p < 0.01; ***p < 0.001, ****p < 0.0001. Statistical significance was determined by one-way ANOVA test
Fig. 7
Fig. 7
Has-miR-873-3p regulates the process of osteogenesis via targeting CNN2. a Venn diagram showing miR-873 targets identified by four different independent microRNA-target-predicting programs (Targetscan, miRanda, RNAhybrid, and PITA). b The predicted miR-873 targeting sequence in the 3′-UTR of CNN2. c Luciferase reporter assay was performed to confirm that CNN2 is the target gene of miR-873 (n = 3 per group). d The relative expression analysis of CNN2 in hBMSCs after co-culture with HSMMs for 24 h using qPCR (n = 3 per group). e The relative expression of CNN2 in hBMSCs after transfection with miR-873 inhibitor and siCNN2 or siNC by qPCR (n = 3 per group). f Cell proliferation analysis of hBMSCs transfected with miR-873 inhibitor and siCNN2 or siNC by EdU staining. Scale bar: 100 μm (n = 3 per group). g Representative images of ALP staining of hBMSCs (left) and the corresponding quantitative analysis (right). Scale bar: 150 μm (n = 3 per group). h Representative images of ARS staining of hBMSCs (left) and the corresponding quantitative analysis (right). Scale bar: 150 μm (n = 3 per group). i qPCR analysis of osteogenic markers Runx2, Bmp2, Col1a1, and Bglap after 14 days of osteogenic induction (n = 3 per group). qPCR results are presented as fold change relative to control. All data are presented as the mean ± SD. *p < 0.05; **p < 0.01; ***p < 0.001. Statistical significance was determined by one-way ANOVA test
Fig. 8
Fig. 8
Conceptual diagram demonstrating the generation and subsequent transfer of EVs from HDAC-inhibited HSMMs to hBMSCs. This non-exercising dependent transfer from muscle enhances bone regeneration, a process modulated by the interaction between has-miR-873-3p microRNA and H2 Calponin (CNN2). Histone acetylation could mediate HSMMs to produce EVs containing excessive miR-873-3p. These EV-derived miR-873-3p could be directly transferred to hBMSCs, and targetes CNN2. By degrading CNN2 mRNA in hBMSCs, TSA-treated HSMM-EVs promote the process of osteogenesis, and enhance bone mass. The diagram was edited using Adobe Illustrator, Adobe Photoshop, and CINEMA 4D

References

    1. Li, V. L. et al. An exercise-inducible metabolite that suppresses feeding and obesity. Nature606, 785–790 (2022). - PMC - PubMed
    1. Watson, M. C. & Lloyd, J. Physical activity: manifold benefits for health and wellbeing. BMJ376, o815 (2022). - PubMed
    1. Wang, H. et al. Mechanistic advances in osteoporosis and anti-osteoporosis therapies. Medcomm4, e244 (2023). - PMC - PubMed
    1. Vechetti, I. J., Valentino, T., Mobley, C. B. & McCarthy, J. J. The role of extracellular vesicles in skeletal muscle and systematic adaptation to exercise. J. Physiol. -Lond.599, 845–861 (2021). - PMC - PubMed
    1. Chow, L. S. et al. Exerkines in health, resilience and disease. Nat. Rev. Endocrinol.18, 273–289 (2022). - PMC - PubMed

Publication types

MeSH terms

LinkOut - more resources