. 2024 Sep 29;15(1):8435.
doi: 10.1038/s41467-024-52743-2.

Regulation of leptin signaling and diet-induced obesity by SEL1L-HRD1 ER-associated degradation in POMC expressing neurons

Affiliations

Regulation of leptin signaling and diet-induced obesity by SEL1L-HRD1 ER-associated degradation in POMC expressing neurons

Hancheng Mao et al. Nat Commun. .

Abstract

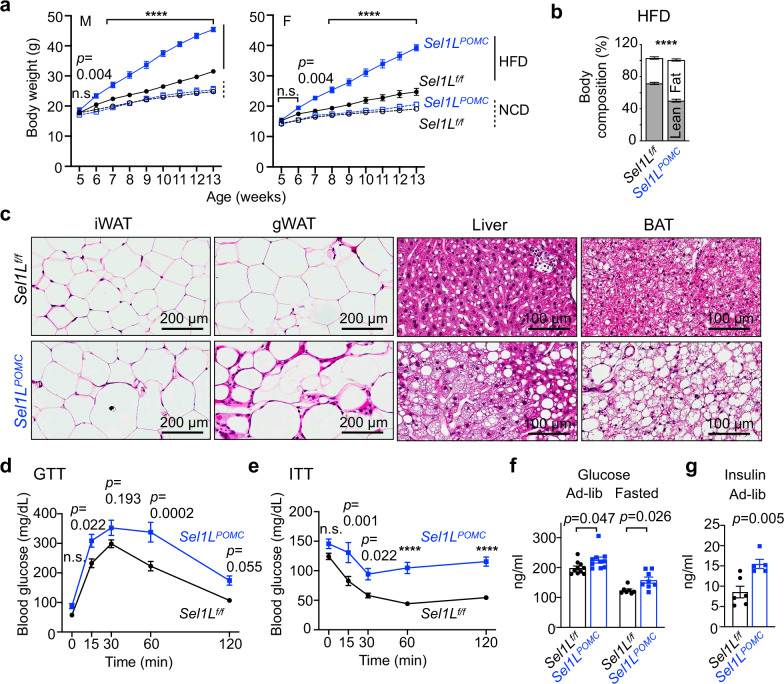
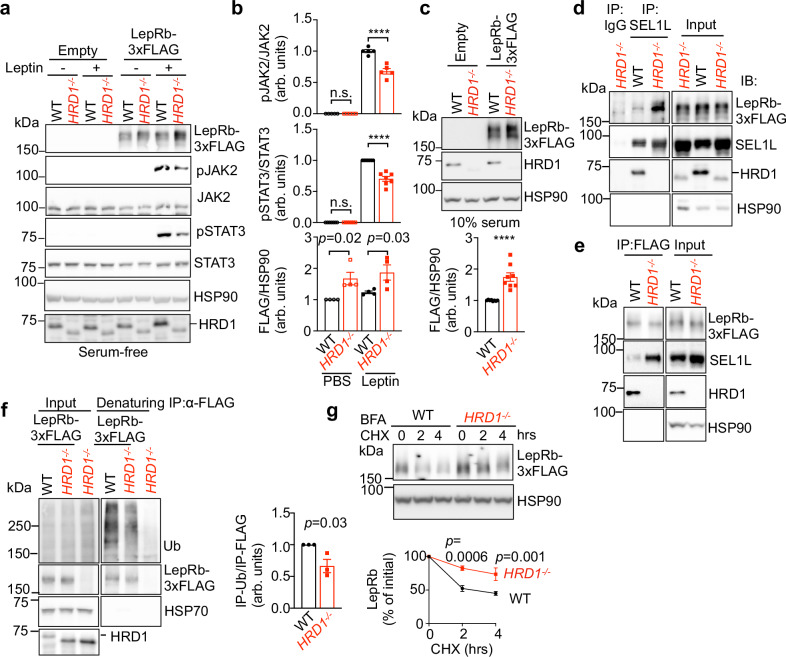
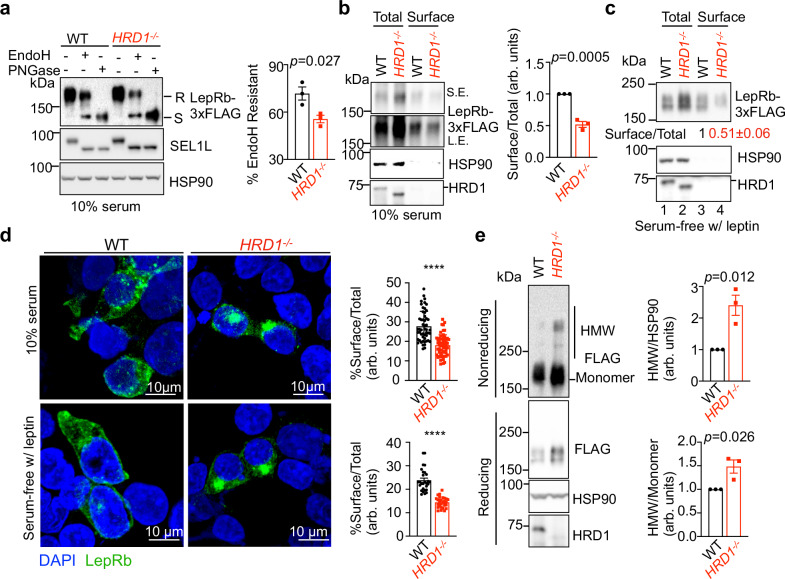
Endoplasmic reticulum (ER) homeostasis in the hypothalamus has been implicated in the pathogenesis of diet-induced obesity (DIO) and type 2 diabetes; however, the underlying molecular mechanism remain vague and debatable. Here we report that SEL1L-HRD1 protein complex of the highly conserved ER-associated protein degradation (ERAD) machinery in POMC-expressing neurons ameliorates diet-induced obesity and its associated complications, partly by regulating the turnover of the long isoform of Leptin receptors (LepRb). Loss of SEL1L in POMC-expressing neurons attenuates leptin signaling and predisposes mice to HFD-associated pathologies including fatty liver, glucose intolerance, insulin and leptin resistance. Mechanistically, nascent LepRb, both wildtype and disease-associated Cys604Ser variant, are misfolding prone and bona fide substrates of SEL1L-HRD1 ERAD. In the absence of SEL1L-HRD1 ERAD, LepRb are largely retained in the ER, in an ER stress-independent manner. This study uncovers an important role of SEL1L-HRD1 ERAD in the pathogenesis of central leptin resistance and leptin signaling.


Conflict of interest statement

The authors declare no competing interests.

Figures

Fig. 1
Fig. 1. Transient upregulation of SEL1L-HRD1 ERAD expression in the hypothalamus in response to high fat diet (HFD) feeding.
a Quantitative PCR (qPCR) analysis of Sel1L and Hrd1 mRNA levels in the ARC of the C57BL/6 J male mice fed on NCD, 1w- and 8w-HFD (n = 4 mice per group). b, c Representative images (b) and quantitation (c) of Western blot of SEL1L and HRD1 proteins in the ARC of the C57BL/6 J male mice fed on NCD, 1w- and 8w-HFD (n = 13 mice per group). dg Representative image and quantitation of IF staining of SEL1L (d, e) and HRD1 (f, g) in the ARC of C57BL/6 J POMC-eGFP transgenic male mice fed on NCD, 1w- and 8w-HFD. Yellow arrows, GFP+ POMC neurons; white arrowheads, non-POMC neurons. e NCD, n = 372, 280 for POMC and non-POMC neurons; 1w-HFD, n = 335, 210 for POMC and non-POMC neurons; 8w-HFD: n = 350, 210 for POMC and non-POMC neurons. g NCD, n = 199, 376 for POMC and non-POMC neurons; 1w-HFD, n = 301, 284 for POMC and non-POMC neurons; 8w-HFD: n = 225, 211 for POMC and non-POMC neurons. NCD for normal chow diet; HFD for high fat diet; ARC, arcuate nucleus. arb. units, arbitrary units. Values, mean ± SEM. n.s., not significant; p values are as indicated unless ****p < 0.0001 by one-way ANOVA followed by Tukey’s multiple comparisons test (a, c, e, g). Source data are provided as a Source Data file.
Fig. 2
Fig. 2. Hypothalamic POMC-specific ERAD deficiency leads to DIO and its pathologies.
a Growth curve of Sel1Lf/f and Sel1LPOMC male (left) and female (right) mice fed NCD or HFD (NCD: n = 24 male and 16 female Sel1Lf/f mice, n = 9 male and 9 female Sel1LPOMC mice; HFD: n = 21 male and 10 female Sel1Lf/f mice, n = 18 male and 9 female Sel1LPOMC mice). b Body composition of Sel1Lf/f and Sel1LPOMC male mice after 8w-HFD (n = 4 Sel1Lf/f and n = 7 Sel1LPOMC). c H&E images of peripheral tissues from male mice fed HFD for 8 weeks (n = 3 mice per group). iWAT inguinal white adipose tissue, gWAT gonadal white adipose tissue, BAT brown adipose tissues. d, e GTT (d) and ITT (e) in 8w-HFD male mice fasted for 16 or 6 hrs prior to glucose (2 g/kg body weight) or insulin (1 unit/kg body weight) injections, respectively (n = 6 mice per group). f Serum glucose levels in 8w-HFD male mice either under ad-lib or 6h-fasting (ad-lib: n = 10 mice per group; fasting: n = 7,8 mice for Sel1Lf/f and Sel1LPOMC). g Ad-lib insulin levels in 8w-HFD male mice (n = 6, 5 mice for Sel1Lf/f and Sel1LPOMC). NCD for normal chow diet; HFD for high fat diet. Values, mean ± SEM. n.s. not significant; p values are as indicated unless ****p < 0.0001 by two-way ANOVA followed by Tukey’s multiple comparisons test (a) or Bonferroni’s multiple comparisons (b, df), or two-tailed Student’s t-test (g). Source data are provided as a Source Data file.
Fig. 3
Fig. 3. Hypothalamic ERAD deficiency triggers hyperphagia and leptin resistance.
a Daily food intake of Sel1Lf/f and Sel1LPOMC male mice at 1w- and 8w-HFD (1w-HFD: n = 11, 9 mice for Sel1Lf/f and Sel1LPOMC; 8w-HFD: n = 9, 11 mice for Sel1Lf/f and Sel1LPOMC). b Growth of male Sel1LPOMC mice under 8-week ad libitum, 8-week pair feeding and 1-week ad libitum on HFD (n = 3 mice, blue dots). Male Sel1Lf/f mice fed ad libitum with the same diets were included as controls (n = 3 mice, black dots). c Growth of Sel1Lf/f male mice ad libitum and Sel1LPOMC male mice either ad libitum or pair-feeding of HFD starting from 5 weeks of age (ad libitum: n = 11, 8 mice for Sel1Lf/f and Sel1LPOMC; pair feeding: n = 3 Sel1LPOMC). d, e, f Diagram of leptin sensitivity test (d). 12-week-old male mice on HFD were injected daily i.p. with vehicle PBS and then PBS or leptin (2 mg/kg body weight) for 3 days. e, f Body weight change (e), average daily food intake (f) following 3 daily vehicle or leptin injections of the male mice (PBS: n = 4 mice per group; leptin: n = 6, 4 mice for Sel1Lf/f and Sel1LPOMC). Body weight change was calculated by end point body weights minus starting point body weights. g Serum leptin levels in male mice fed on NCD, 1w- and 8w-HFD (NCD: n = 13, 11 mice for Sel1Lf/f and Sel1LPOMC; 1w-HFD: n = 7, 8 mice for Sel1Lf/f and Sel1LPOMC; 8w-HFD: n = 5, 8 mice for Sel1Lf/f and Sel1LPOMC). NCD for normal chow diet; HFD for high fat diet. Values, mean ± SEM. n.s. not significant; p values are as indicated unless ****p < 0.0001 by two-way ANOVA followed by Bonferroni’s multiple comparisons test (a, b, e, f) or Tukey’s multiple comparisons test (c, g). Source data are provided as a Source Data file.
Fig. 4
Fig. 4. Hypothalamic SEL1L-HRD1 deficiency leads to DIO via leptin signaling.
a Schematic diagram for the experimental design (left) and pictures of Sel1Lf/f and Sel1LPOMC female parabionts following 8-week HFD (n = 3, 1, 5 pairs in groups I-III). be Body weights (b), body composition (c), serum leptin (d) and insulin (e) levels in female parabionts before and after parabiosis and 8-week HFD (n = 6, 2, 5 mice in groups I–III). NCD for normal chow diet; HFD for high fat diet. Values, mean ± SEM. n.s. not significant; p values are as indicated unless ****p < 0.0001 by two-way ANOVA followed by Bonferroni’s multiple comparisons test (b) or Tukey’s multiple comparisons test (ce). Source data are provided as a Source Data file.
Fig. 5
Fig. 5. Hypothalamic SEL1L-HRD1 ERAD deficiency impairs leptin-pSTAT3 signaling.
ad Representative immunofluorescence (IF) staining of pSTAT3 (red) and eGFP (green) in Sel1Lf/f;Pomc-eGFP and Sel1LPOMC;Pomc-eGFP mice under NCD (a), 1w-HFD (b) and 8w-HFD (c). Mice were fasted overnight followed by i.p. injection with leptin (2 mg/kg body weight), with quantitation of percentage of pSTAT3+ POMC neurons shown in (d). Mice injected with PBS were included as negative controls (Supplemental Fig. 3). Yellow arrows, pSTAT3+ POMC neurons; white arrowheads, pSTAT3- POMC neurons. (NCD: n = 4 mice per genotype; 1w-, 8w-HFD and PBS: n = 3 mice per genotype). e Quantitative PCR (qPCR) analysis of Pomc mRNA levels in ARC of Sel1Lf/f and Sel1LPOMC male mice at 8w-HFD (n = 3 mice per group). f, g Representative Western blot analysis (f) and quantitation (g) of leptin-induced pSTAT3 in ARC of Sel1Lf/f and Sel1LPOMC mice under NCD or 8w-HFD (NCD: n = 2 mice per genotype for PBS, n = 4 mice per genotype for leptin; 8w-HFD: n = 4 mice per group). NCD for normal chow diet; HFD for high fat diet; ARC, arcuate nucleus. arb. units, arbitrary units. Values, mean ± SEM. n.s. not significant; p values are as indicated unless ****p < 0.0001 by two-way ANOVA followed by Bonferroni’s multiple comparisons test (d, e, g). Source data are provided as a Source Data file.
Fig. 6
Fig. 6. POMC-specific ERAD deficiency is associated with low levels of UPR and inflammation.
ac Representative Western blot analysis and quantitation of the PERK pathway (a, n = 6 mice per group), and phostag-gel (P-T) analysis of IRE1α phosphorylation (b, n = 3 mice per group), BiP levels (b, n = 6 mice per group), and reverse transcriptase PCR (RT-PCR) analysis and quantitation of Xbp1 mRNA splicing (c, n = 5, 4 mice for Sel1Lf/f and Sel1LPOMC) in the ARC of Sel1Lf/f and Sel1LPOMC mice on 8w-HFD. Livers from male mice treated with tunicamycin (TM, 1 mg/kg, i.p.) for 24 hrs (Liver_TM), liver lysates treated with Lambda protein phosphatase (Liver_TM w/ λPP), and livers under basal condition (Liver_CON) were included as controls. d Representative Western blot and quantitation showing the lack of effect of ER stress on leptin signaling. WT HEK293T transfected with mLepRb were treated with thapsigargin (Tg) at the indicated concentration for 4 hrs and leptin for 30 min in serum free medium, followed by Western blot and RT-PCR analyses of UPR activation (n = 5, 2, 2 independent cell samples per group for Western blot, P-T gel, and RT-PCR). e Representative confocal images and quantitation of the number of GFP+ POMC neurons in Sel1Lf/f;POMC-eGFP and Sel1LPOMC;POMC-eGFP mice on 8w-HFD (n = 6, 9 mice for Sel1Lf/f;Pomc-eGFP and Sel1LPOMC;Pomc-eGFP). f, g Representative Western blot analysis (f) and quantitation (g) of inflammatory markers in the ARC of Sel1Lf/f and Sel1LPOMC male mice fed on 8w-HFD (n = 3 mice per group). arb. units, arbitrary units. HFD for high fat diet; ARC, arcuate nucleus. arb. units, arbitrary units. Values, mean ± SEM. n.s., not significant; p values are as indicated by two-way ANOVA followed by Tukey’s multiple comparisons test (d) or two-tailed Student’s t-test (ac, e, g). Source data are provided as a Source Data file.
Fig. 7
Fig. 7. SEL1L-HRD1 interacts with and targets LepRb for degradation.
a, b Representative Western blot (a) and quantitation (b) for leptin (100 nM, 30 min)-induced phosphorylation of JAK2-STAT3 in HEK293T transfected with mLepRb-3xFlag in serum-free medium. (n = 5,7,4 independent samples per group for pJAK2, pSTAT3 and mLepRb-3xFLAG). arb. units, arbitrary units. c Representative Western blot and quantitation of mLepRb-3xFLAG protein levels in transfected HEK293T in complete medium (DMEM w/ 10% serum) (n = 8 independent samples per group). arb. units, arbitrary units. d, e Immunoblot analysis following immunoprecipitation (IP) of SEL1L (d) or FLAG (e) from lysates of WT or HRD1-/- HEK293T transfected with mLepRb-3xFlag (n = 2, 3 independent samples for SEL1L-IP and FLAG-IP). f Immunoblot analysis of Ub following denaturing immunoprecipitation (IP) of Flag from lysates of HEK293T transfected with mLepRb-3xFlag (n = 3 independent samples per group). arb. units, arbitrary units. g Protein decay analysis and quantitation (below) of LepRb protein levels in LepRb-3xFlag-expressing HEK293T cells treated with Brefeldin-A and cycloheximide (CHX) for the indicated time periods (n = 4 independent samples per group). Values, mean ± SEM. n.s., not significant; p values are as indicated unless ****p < 0.0001 by two-tailed Student’s t-test (c, f) or two-way ANOVA followed by Bonferroni’s multiple comparisons test (b, g). Source data are provided as a Source Data file.
Fig. 8
Fig. 8. SEL1L-HRD1 ERAD deficiency promotes the ER-retention and aggregation of LepRb.
a Representative Western blot and quantitation (right) of LepRb protein following treatment with EndoH or PNGase in HEK 293T transfected mLepRb-3xFlag (n = 3 independent samples per group). arb. units, arbitrary units. b, c Measurement of surface mLepRb levels in HEK293T transfected with mLepRb-3xFlag in DMEM with 10% serum (b), or serum-free DMEM treated with leptin for 30 min (c) followed by biotinylation for membrane surface proteins followed by immunoprecipitation by streptavidin-beads (b, n = 3 independent samples per group; c, n = 2 independent samples per group). arb. units, arbitrary units. d Representative confocal IF images of mLepRb-3xFlag in transfected HEK293T cells in DMEM with 10% serum or serum-free DMEM treated with 100 nM leptin for 30 min. Quantitation of percent of surface signals over total shown on the right (10% serum: n = 52 WT and 57 HRD1−/− cells; serum-free w/leptin: n = 28 cells per genotype). arb. units, arbitrary units. Split channels are shown in Supplementary Fig. 5. e Western blot analyses and quantitation (right) of mLepRb-3xFlag protein in transfected HEK293T cells on reducing and nonreducing SDS-PAGE (n = 3 independent samples per group). arb. units, arbitrary units. Values, mean ± SEM. n.s., not significant; p values are as indicated unless ****p < 0.0001 by two-tailed Student’s t-test (a, b, d, e). Source data are provided as a Source Data file.
Fig. 9
Fig. 9. The indispensable role of SEL1L-HRD1 ERAD in POMC-expressing neurons.
a In POMC-expressing neurons, SEL1L-HRD1 ERAD constitutively degrades misfolded LepRb, a process to ensure the production of functional LepRb at the cell surface. b The absence of SEL1L-HRD1 ERAD in POMC-expressing neurons causes the accumulation and aggregation of misfolded LepRb, which disrupts the proper folding of nascent LepRb. This impairment in LepRb biogenesis results in severe leptin resistance in mice when on a HFD. Created in BioRender. Mao, H. (2024) BioRender.com/a66y170.

Update of

References

    1. Toda, C., Santoro, A., Kim, J. D. & Diano, S. POMC neurons: from birth to death. Annu. Rev. Physiol.79, 209–236 (2017). - PMC - PubMed
    1. McLean, F. H. et al. A high-fat diet induces rapid changes in the mouse hypothalamic proteome. Nutr. Metab.16, 26 (2019). - PMC - PubMed
    1. Dalvi, P. S. et al. High fat induces acute and chronic inflammation in the hypothalamus: effect of high-fat diet, palmitate and TNF-alpha on appetite-regulating NPY neurons. Int. J. Obes.41, 149–158 (2017). - PubMed
    1. Beutler, L. R. et al. Obesity causes selective and long-lasting desensitization of AgRP neurons to dietary fat. Elife9, e55909 (2020). - PMC - PubMed
    1. Horvath, T. L. et al. Synaptic input organization of the melanocortin system predicts diet-induced hypothalamic reactive gliosis and obesity. Proc. Natl Acad. Sci. USA107, 14875–14880 (2010). - PMC - PubMed

Publication types

MeSH terms