

Glymphatic dysfunction in multiple sclerosis and its association with disease pathology and disability
- PMID: 39344166
- PMCID: PMC11568644
- DOI: 10.1177/13524585241280842
Glymphatic dysfunction in multiple sclerosis and its association with disease pathology and disability
Abstract
Background: The role of the glymphatic system in multiple sclerosis (MS)-related disability remains underexplored. Diffusion-tensor image analysis along the perivascular space (DTI-ALPS) offers a non-invasive method to assess glymphatic function.
Objective: To evaluate glymphatic function in MS patients with lower and higher disability.
Methods: This study included 118 MS patients who underwent structural, diffusion-weighted imaging, and clinical assessment. The participants were divided into lower (MS-L, n = 57) and higher disability (MS-H, n = 61) subgroups. Brain parenchymal fraction (BPF), lesion load (LL), and DTI-ALPS index were measured. Subgroup differences and correlations between DTI-ALPS index and other measures were explored. Logistic regression was performed to evaluate BPF, LL, and DTI-ALPS index in classifying lower and higher disability patients.
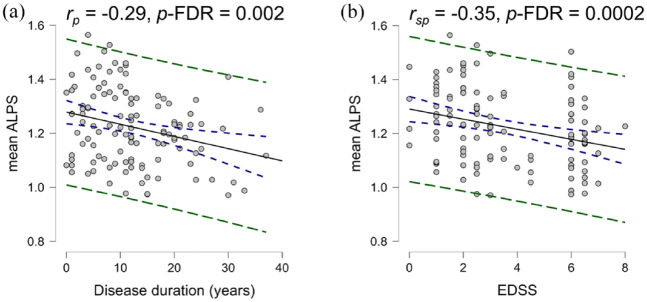
Results: Significant differences in DTI-ALPS index between MS-H and MS-L (d = -0.71, false discovery rate-corrected p-value (p-FDR) = 0.001) were found. The DTI-ALPS index correlated significantly with disease duration (rp = -0.29, p-FDR = 0.002) and EDSS (rsp = -0.35, p-FDR = 0.0002). It also showed significant correlations with BPF and LL. DTI-ALPS index and LL were significant predictors of disability subgroup (DTI-ALPS: odds ratio (OR) = 1.77, p = 0.04, LL: OR = 0.94, p = 0.02).
Conclusion: Our findings highlight DTI-ALPS index as an imaging biomarker in MS, suggesting the involvement of glymphatic impairment in MS pathology, although further research is needed to elucidate its role in contributing to MS-related disability.
Keywords: DTI-ALPS; Multiple sclerosis; disability; glymphatic system; neurodegeneration; neuroinflammation.
Conflict of interest statement
Declaration of Conflicting InterestsThe author(s) declared no potential conflicts of interest with respect to the research, authorship, and/or publication of this article.
Figures


References
-
- Jakimovski D, Bittner S, Zivadinov R, et al. Multiple sclerosis. Lancet 2024; 403: 183–202. - PubMed
-
- Datta G, Colasanti A, Rabiner EA, et al. Neuroinflammation and its relationship to changes in brain volume and white matter lesions in multiple sclerosis. Brain 2017; 140: 2927–2938. - PubMed
-
- Sormani MP, Arnold DL, De Stefano N. Treatment effect on brain atrophy correlates with treatment effect on disability in multiple sclerosis. Ann Neurol 2014; 75: 43–49. - PubMed
-
- Barkhof F, Calabresi PA, Miller DH, et al. Imaging outcomes for neuroprotection and repair in multiple sclerosis trials. Nat Rev Neurol 2009; 5: 256–266. - PubMed
MeSH terms
LinkOut - more resources
Full Text Sources
Medical
