. 2024 Sep;28(18):e70101.
doi: 10.1111/jcmm.70101.

Cross-modal integration of bulk RNA-seq and single-cell RNA sequencing data to reveal T-cell exhaustion in colorectal cancer

Affiliations

Cross-modal integration of bulk RNA-seq and single-cell RNA sequencing data to reveal T-cell exhaustion in colorectal cancer

Mingcong Xu et al. J Cell Mol Med. 2024 Sep.

Abstract

Colorectal cancer (CRC) is a relatively common malignancy clinically and the second leading cause of cancer-related deaths. Recent studies have identified T-cell exhaustion as playing a crucial role in the pathogenesis of CRC. A long-standing challenge in the clinical management of CRC is to understand how T cells function during its progression and metastasis, and whether potential therapeutic targets for CRC treatment can be predicted through T cells. Here, we propose DeepTEX, a multi-omics deep learning approach that integrates cross-model data to investigate the heterogeneity of T-cell exhaustion in CRC. DeepTEX uses a domain adaptation model to align the data distributions from two different modalities and applies a cross-modal knowledge distillation model to predict the heterogeneity of T-cell exhaustion across diverse patients, identifying key functional pathways and genes. DeepTEX offers valuable insights into the application of deep learning in multi-omics, providing crucial data for exploring the stages of T-cell exhaustion associated with CRC and relevant therapeutic targets.

Keywords: T‐cell exhaustion; bulk RNA‐seq; knowledge distillation; scRNA‐seq.


Conflict of interest statement

The authors declare that there are no potential conflicts of interest.

Figures
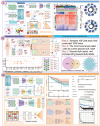
FIGURE 1
FIGURE 1
The complete workflow of DeepTEX.
FIGURE 2
FIGURE 2
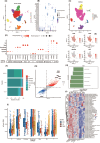
Single‐cell analysis of CRC liver metastases. (A) Classify cells into 11 clusters. (B) The average expression of representative marker genes for the main cell clusters in the integrated human CRC data. (C) Eleven cell clusters are annotated as seven cell types. (D) The expression of marker genes corresponding to each cell type in CRC single‐cell data. (E) CD3E and CD3D exhibit the most significant expression in CRC T cells. (F) The cell proportions of seven cell types in three samples. (G) Significantly downregulated and upregulated genes. (H) GSVA presents five pathways differentiating metastatic and primary sites. (I) The number of T cells is higher in metastatic cancer LM, PBMC than in primary CRC. (J) Pathways with high activity in both metastatic and primary sites.
FIGURE 3
FIGURE 3
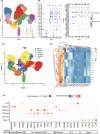
In‐depth analysis of T‐cell exhaustion mechanisms in primary CRC and liver metastases. (A) Cells were classified into 14 clusters. (B, C) The average expression of representative marker genes of major cell clusters associated with T‐cell exhaustion in integrated human CRC data. (D) The top 20 TFs activities in different CRC types. (E) Six functional cell types related to the degree of T‐cell exhaustion.
FIGURE 4
FIGURE 4
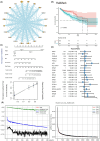
Downstream validation of a deep learning‐based multi‐omics integration model. (A) The protein–protein interaction network. (B) The prognostic significance of Hallmark. (C) The consistency between predicted and observed 3‐year survival rates. (D) Certain genes may be significant risk factors in CRC. (E) Losses of the teacher model and the student model are discussed.
FIGURE 5
FIGURE 5
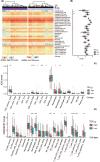
Immune infiltration analysis in CRC. (A, B) T‐cell exhaustion score high and low immune cell infiltration differences. (C) xCell chart shows the proportion of 17 immune cell subgroups in high and low exhaustion score groups. (D) CIBERSORT chart shows the proportion of 21 immune cell subgroups in high and low exhaustion score groups. ****p < 0.0001, ***p < 0.001, **p < 0.01, *p < 0.05.
FIGURE 6
FIGURE 6
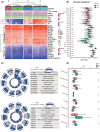
Analysis of T‐cell exhaustion functional mechanisms in CRC. (A) The stages of T‐cell exhaustion and the T‐cell exhaustion scores predicted by the model. (B) Expression of immune checkpoints in relation to high and low T‐cell exhaustion scores. (C) Enrichment results in a circular format, along with the names of functional pathways. (D) T‐cell exhaustion scores of patients correlate with sensitivity to eight types of drugs. ****p < 0.0001, ***p < 0.001, **p < 0.01, *p < 0.05.

References

    1. Siegel RL, Miller KD, Fuchs HE, Jemal A. Cancer statistics, 2022. CA Cancer J Clin. 2022;72:7‐33. - PubMed
    1. Chow A, Perica K, Klebanoff CA, Wolchok JD. Clinical implications of T cell exhaustion for cancer immunotherapy. Nat Rev Clin Oncol. 2022;19:775‐790. - PMC - PubMed
    1. Kang K, Lin X, Chen P, et al. T cell exhaustion in human cancers. Biochim Biophys Acta Rev Cancer. 2024;1879:189162. - PubMed
    1. Zeng Z, Wei F, Ren X. Exhausted T cells and epigenetic status. Cancer Biol Med. 2020;17:923‐936. - PMC - PubMed
    1. Beltra J‐C, Manne S, Abdel‐Hakeem MS, et al. Developmental relationships of four exhausted CD8+ T cell subsets reveals underlying transcriptional and epigenetic landscape control mechanisms. Immunity. 2020;52:825‐841.e8. - PMC - PubMed

MeSH terms

LinkOut - more resources