. 2024 Oct;13(19):e035868.
doi: 10.1161/JAHA.124.035868. Epub 2024 Sep 30.

Carotid Baroreceptor Stimulation Ameliorates Pulmonary Arterial Remodeling in Rats With Hypoxia-Induced Pulmonary Hypertension

Affiliations

Carotid Baroreceptor Stimulation Ameliorates Pulmonary Arterial Remodeling in Rats With Hypoxia-Induced Pulmonary Hypertension

Xuesheng Fang et al. J Am Heart Assoc. 2024 Oct.

Abstract

Background: Sympathetic hyperactivity plays an important role in the initiation and maintenance of pulmonary hypertension. Carotid baroreceptor stimulation (CBS) is an effective autonomic neuromodulation therapy. We aim to investigate the effects of CBS on hypoxia-induced pulmonary hypertension and its underlying mechanisms.

Methods and results: Rats were randomly assigned into 4 groups, including a Control-sham group (n=7), a Control-CBS group (n=7), a Hypoxia-sham group (n=10) and a Hypoxia-CBS group (n=10). Echocardiography, ECG, and hemodynamics examination were performed. Samples of blood, lung tissue, pulmonary arteries, and right ventricle were collected for the further analysis. In the in vivo study, CBS reduced wall thickness and muscularization degree in pulmonary arterioles, thereby improving pulmonary hemodynamics. Right ventricle hypertrophy, fibrosis and dysfunction were all improved. CBS rebalanced autonomic tone and reduced the density of sympathetic nerves around pulmonary artery trunks and bifurcations. RNA-seq analysis identified BDNF and periostin (POSTN) as key genes involved in hypoxia-induced pulmonary hypertension, and CBS downregulated the mRNA expression of BDNF and POSTN in rat pulmonary arteries. In the in vitro study, norepinephrine was found to promote pulmonary artery smooth muscle cell proliferation while upregulating BDNF and POSTN expression. The proliferative effect was alleviated by silence BDNF or POSTN.

Conclusions: Our results showed that CBS could rebalance autonomic tone, inhibit pulmonary arterial remodeling, and improve pulmonary hemodynamics and right ventricle function, thus delaying hypoxia-induced pulmonary hypertension progression. There may be a reciprocal interaction between POSTN and BDNF that is responsible for the underlying mechanism.

Keywords: POSTN; carotid baroreceptor stimulation; hypoxia; pulmonary hypertension; sympathetic tone.


Figures
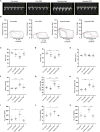
Figure 1
Figure 1. Effects of CBS on pulmonary hemodynamics and RV function in HPH rats.
A, Representative echocardiography images across the pulmonary outflow tract. B, Representative pressure–volume loops. C, PAT, the time of peak flow acceleration across the pulmonary valve, decreased with the increase of PAP. n=7–10. D, PAT/ET, the ratio of pulmonary acceleration time to total pulmonary ejection time reversed with changes in PAP. n=7–10. E, TAPSE as assessed by echocardiography. n=7–10. F through H, mPAP, RVSP, and PVR as assessed by right heart catheterization showed that chronic hypoxia increased mPAP, RVSP, and PVR, which were reversed by CBS treatment in HPH rats. n=7–10. I, E es represented RV contractility. n=4–5. J, E ed represented RV diastolic stiffness. n=4–5. K, E a represented RV afterload. n=4–5. Values were mean±SEM. *P<0.05, **P<0.01, ***P<0.001. CBS indicates carotid baroreceptor stimulation; Con, Control; E a, arterial elastance; E ed, diastolic elastance; E es, end‐systolic elastance; ET, total pulmonary ejection time; HPH, hypoxia‐induced pulmonary hypertension; mPAP, mean pulmonary artery pressure; PAT, pulmonary acceleration time; PVR, pulmonary vascular resistance; RV, right ventricle; RVSP, right ventricular systolic pressure; and TAPSE, tricuspid annular plane systolic excursion.
Figure 2
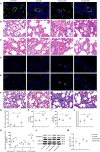
Figure 2. Effects of CBS on pulmonary arterial remodeling in HPH rats.
A, Representative photomicrographs of coimmunofluorescence staining of Ki67 (pink) with vWF(red) and α‐SMA (green) in lung paraffin sections. Scale bar=20 μm. n=5. B and C, Representative photomicrographs of pulmonary arterioles with H&E staining and (H and I) quantitative analysis of WT% (B and H, vessel diameter 20–100 μm; C and I, vessel diameter 100–200 μm). scale bar=20 μm. n=5. D and E, Immunofluorescence staining for vWF (red), a‐SMA (green), and nuclei (DAPI, blue) of lung paraffin sections. Scale bar=20 μm. n=5. F, Representative photomicrographs of lung tissue with Masson staining and (J) the result of quantitative analysis of CVF. G, Bar graph showed the number of Ki67 positive smooth muscle cells as a percentage of total number of smooth muscle cells in PA wall respectively. n=5. K, The muscularization of pulmonary arterioles characterized by nonmuscular, partially muscular, and fully muscular (vessel diameter 20–50 μm). n=5. L and M, Representative immunoblot bands and the protein expression levels of P‐ERK1/2, ERK1/2 in rat PA tissue. n=4. Values were mean±SEM. *P<0.05, **P<0.01, ***P<0.001. a‐SMA indicates alpha‐smooth muscle actin; CBS, carotid baroreceptor stimulation; Con, Control; CVF, collagen volume fraction; DAPI, 4′,6‐diamidino‐2‐phenylindole; ERK1/2, extracellular signal‐regulated kinase 1/2; GAPDH, glyceraldehyde‐3‐phosphate dehydrogenase; H&E, hematoxylin and eosin; HPH, hypoxia‐induced pulmonary hypertension; PA, pulmonary artery; P‐ERK1/2, phosphor‐extracellular signal‐regulated kinase 1/2; vWF, von Willebrand factor; and WT%, percentage of wall thickness.
Figure 3
Figure 3. Effects of CBS on RV remodeling in HPH rats.
A and B, Representative photomicrographs of RV with H&E staining (A) and Masson staining (B). Scale bar=20 μm. n=5. C, Bar graph showed the size of RV cardiomyocyte CSA. n=5. D, Weight ratio of RV to LV+S. n=5. E, Weight ratio of RV to BW. n=5. F, RVWT assessed by echocardiographic measurements. n=7–10. G, real‐time quantitative polymerase chain reaction analysis showed the relative mRNA expression level of ANP in RV. n=3. H, The result of quantitative analysis of CVF in RV. n=5. I and J, Representative immunoblot bands and the protein expression level of MMP2 and MMP9. n=3. Values were mean±SEM. *P<0.05, **P<0.01, ***P<0.001. ANP indicates atrial natriuretic peptide; CBS, carotid baroreceptor stimulation; Con, Control; CSA, cross‐sectional area; CVF, collagen volume fraction; GAPDH, glyceraldehyde‐3‐phosphate dehydrogenase; H&E, hematoxylin and eosin; HPH, hypoxia‐induced pulmonary hypertension; MMP2, matrix metallopeptidase 2; MMP9, matrix metallopeptidase 9; RV, right ventricle; RV/BW, weight ratio of RV to body weight; RV/LV+S, weight ratio of RV to left ventricle plus septum; and RVWT, RV wall thickness.
Figure 4
Figure 4. Effects of CBS on power spectral analysis of HRV and sympathetic tone around PA in HPH rats.
A, Representative immunohistochemical staining photomicrographs for TH in PA sections. Black arrow indicated the TH‐positive nerve bundle. The bottom row image was an enlarged version of the black dotted box in the top row image. top row images: scale bar=100 μm, bottom row images: scale bar=20 μm. n=5. B, The quantitative result of TH‐positive area around PA trunks and bifurcations showed CBS significantly reduced TH‐positive nerve bundle area. n=5. C through E, Short‐term power spectral analysis of HRV showed CBS significantly reduced the increase in LF (C) and LF/HF ratio (E) and suppressed the decrease in HF (D) in HPH rats. n=5–6. Values were mean±SEM. *P<0.05, **P<0.01, ***P<0.001. CBS indicates carotid baroreceptor stimulation; Con, Control; HF, high frequency power; HPH, hypoxia‐induced pulmonary hypertension; HRV, heart rate viability; LF, low frequency power; LF/HF, the ratio of low frequency power to high frequency power; PA, pulmonary artery; and TH, tyrosine hydroxylase.
Figure 5
Figure 5. Expression and functional enrichment of DEGs in rats.
A, Venn map showed DEGs among Con‐sham, Hypoxia‐sham and Hypoxia‐CBS group. B, CBS made a change in DEGs altered by hypoxia, which was shown in GO enrichment analysis. C, PPI network showed that the top hub genes of DEGs. D, Heat map showed the 21 hypoxia‐upregulated genes reversed by CBS treatment. E and F, The relative mRNA expression levels of POSTN (E) and BDNF (F) Con‐sham, n=3; Con‐CBS, n=3; Hypoxia‐sham, n=4; Hypoxia‐CBS, n=4 (normalized to GAPDH mRNA). Values were mean±SEM. *P<0.05, **P<0.01, ***P<0.001. BDNF indicates brain‐derived neurotrophic factor; BP, biological process; CBS, carotid baroreceptor stimulation; CC, cellular component; Con, Control; DEGs, differentially expressed genes; GAPDH, glyceraldehyde‐3‐phosphate dehydrogenase; GO, Gene Ontology; MF, molecular function; POSTN, periostin; and PPI, protein–protein interaction network.
Figure 6
Figure 6. Effects of norepinephrine on PASMC proliferation and HPH‐associated proteins expression via ERK1/2 pathway.
A, Immunofluorescence staining with α‐SMA for PASMC identification, scale bar=50 μm. B, PASMCs were treated with different concentrations of norepinephrine (0.01, 0.1, 1 μmol/L) for 48 hours. n=6. C and D, Different concentrations of Pra (0.1, 1, 10 μmol/L) or U0126 (40, 80, 160 μmol/L) inhibited norepinephrine‐induced cell viability. n=6. E and F, CCK8 and cell count assay were used to evaluate cell proliferation under different conditions. E, N=6; F, N=3. G through K, Representative immunoblot bands and the protein expression levels of p‐ERK1/2/ERK1/2 ratio (H), PCNA (I), POSTN (J), BMPR2 (K) in primary cultured PASMCs. n=3. L through N, Representative immunoblot bands (G) and the protein expression levels of BDNF, P‐TrkB, and TrkB under normoxic (M) or hypoxic conditions (N). Values were mean±SEM. *P<0.05, **P<0.01, ***P<0.001. α‐SMA indicates a‐smooth muscle actin; BDNF, brain‐derived neurotrophic factor; BMPR2, bone morphogenetic protein receptor, type II; CCK8, cell counting kit‐8; DAPI, 4′,6‐diamidino‐2‐phenylindole; ERK1/2, extracellular signal regulated kinase 1/2; HPH, hypoxia‐induced pulmonary hypertension; NE, norepinephrine; PA, pulmonary artery; PASMCs, pulmonary artery smooth muscle cells; PCNA, proliferating cell nuclear antigen; P‐ERK1/2, phosphorylated‐extracellular signal regulated kinase 1/2; POSTN, periostin; Pra, prazosin; P‐TrkB, phosphorylated‐tyrosine kinase receptor B; and TrkB, tyrosine kinase receptor B.
Figure 7
Figure 7. Effects of POSTN and BDNF/TrkB signaling on the proliferation of PASMC.
A, After the cells were transfected with Ad‐shPOSTN or Ad‐shNC for 96 hours, POSTN protein expression level was detected using Western blot to verify the silence efficiency. n=3. B and C, CCK8 and cell count assay were used to evaluate cell proliferation. B, n=6; C, n=3. D through F, Representative immunoblot bands (D) and the protein expression levels of PCNA (E) and BMPR2 (F). n=3. G, Representative immunoblot bands of BDNF, P‐TrkB, and TrkB in PASMCs. H and I, Bar graph showed the protein expression levels of BDNF, P‐TrkB, and TrkB under normoxic (H) or hypoxic (I) conditions. n=3. J through L, Representative immunoblot bands of BDNF, POSTN, and bar diagram showed the result of quantitative analysis after cell transfection with siBDNF or siNC under normoxic or hypoxic conditions. n=3. M and N, Effect of BDNF on POSTN expression as showed by western blot. O and P, CCK8 and cell count assay were performed to measure cell proliferation after stimulated by BDNF at 24 hours and 48 hours. n=3. Values were mean±SEM. *P<0.05, **P<0.01, ***P<0.001. Ad‐shNC indicates adenovirus mediated negative control; Ad‐shPOSTN, adenovirus mediated POSTN silencing; BDNF, brain‐derived neurotrophic factor; BMPR2, bone morphogenetic protein receptor, type II; CCK8, cell counting kit‐8; NE, norepinephrine; PASMCs, pulmonary artery smooth muscle cells; PCNA, proliferating cell nuclear antigen; POSTN, periostin; P‐TrkB, phosphorylated‐tyrosine kinase receptor B; and TrkB, tyrosine kinase receptor B.

Similar articles

Cited by

References

    1. Simonneau G, Montani D, Celermajer DS, Denton CP, Gatzoulis MA, Krowka M, Williams PG, Souza R. Haemodynamic definitions and updated clinical classification of pulmonary hypertension. Eur Respir J. 2019;53:1801913. doi: 10.1183/13993003.01913-2018 - DOI - PMC - PubMed
    1. Thompson AAR, Lawrie A. Targeting vascular remodeling to treat pulmonary arterial hypertension. Trends Mol Med. 2017;23:31–45. doi: 10.1016/j.molmed.2016.11.005 - DOI - PubMed
    1. Thenappan T, Ormiston ML, Ryan JJ, Archer SL. Pulmonary arterial hypertension: pathogenesis and clinical management. BMJ (Clinical Research Ed). 2018;360:j5492. doi: 10.1136/bmj.j5492 - DOI - PMC - PubMed
    1. Zelt JGE, Sugarman J, Weatherald J, Partridge ACR, Liang JC, Swiston J, Brunner N, Chandy G, Stewart DJ, Contreras‐Dominguez V, et al. Mortality trends in pulmonary arterial hypertension in Canada: a temporal analysis of survival per ESC/ERS guideline era. Eur Respir J. 2022;59:2101552. doi: 10.1183/13993003.01552-2021 - DOI - PMC - PubMed
    1. Vaillancourt M, Chia P, Sarji S, Nguyen J, Hoftman N, Ruffenach G, Eghbali M, Mahajan A, Umar S. Autonomic nervous system involvement in pulmonary arterial hypertension. Respir Res. 2017;18:201. doi: 10.1186/s12931-017-0679-6 - DOI - PMC - PubMed

MeSH terms

Substances

LinkOut - more resources