. 2025 Jan;73(1):38-56.
doi: 10.1002/glia.24614. Epub 2024 Sep 30.

Developmental maturation and regional heterogeneity but no sexual dimorphism of the murine CNS myelin proteome

Affiliations

Developmental maturation and regional heterogeneity but no sexual dimorphism of the murine CNS myelin proteome

Sophie B Siems et al. Glia. 2025 Jan.

Abstract

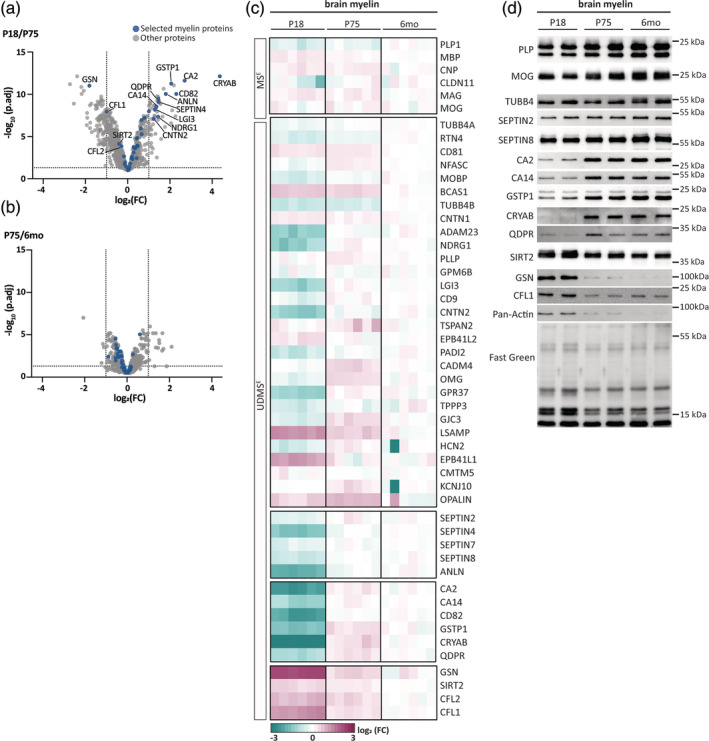
The molecules that constitute myelin are critical for the integrity of axon/myelin-units and thus speed and precision of impulse propagation. In the CNS, the protein composition of oligodendrocyte-derived myelin has evolutionarily diverged and differs from that in the PNS. Here, we hypothesized that the CNS myelin proteome also displays variations within the same species. We thus used quantitative mass spectrometry to compare myelin purified from mouse brains at three developmental timepoints, from brains of male and female mice, and from four CNS regions. We find that most structural myelin proteins are of approximately similar abundance across all tested conditions. However, the abundance of multiple other proteins differs markedly over time, implying that the myelin proteome matures between P18 and P75 and then remains relatively constant until at least 6 months of age. Myelin maturation involves a decrease of cytoskeleton-associated proteins involved in sheath growth and wrapping, along with an increase of all subunits of the septin filament that stabilizes mature myelin, and of multiple other proteins which potentially exert protective functions. Among the latter, quinoid dihydropteridine reductase (QDPR) emerges as a highly specific marker for mature oligodendrocytes and myelin. Conversely, female and male mice display essentially similar myelin proteomes. Across the four CNS regions analyzed, we note that spinal cord myelin exhibits a comparatively high abundance of HCN2-channels, required for particularly long sheaths. These findings show that CNS myelination involves developmental maturation of myelin protein composition, and regional differences, but absence of evidence for sexual dimorphism.

Keywords: axon/glia‐interaction; myelin maturation; oligodendrocyte; quantitative proteomics; white matter.


Conflict of interest statement

The authors declare no competing interests.

Figures

FIGURE 1
FIGURE 1
Proteome analysis to address myelin heterogeneity in mice. (a–c) Schematic of the workflow. Myelin was biochemically purified from the brains of male mice at three ages (P18, P75, 6 months) (a), brains of female and male mice at P75 (b), or four CNS regions of male mice at P75 (cortex, corpus callosum [cc], optic nerve [opt. nerve], and spinal cord [spi. cord]) (c). The protein composition of the myelin fractions was analyzed by quantitative mass spectrometry with n = 3 biological replicates per condition each, and two technical replicates at the tryptic digest level for the maturation‐ (a) and sex‐dependent sample sets (b), or four technical replicates at both the digestion and injection level for the CNS regions sample set (c). For SDS‐PAGE‐separation of myelin fractions and silver staining of proteins see Supplemental Figure S1; for entire datasets see Supplemental Tables [Link], [Link]. (d–f) Principal Component Analysis (PCA) of the UDMSE proteome datasets of CNS myelin purified from the brains of male mice at P18, P75, and 6 months (d), the brains of male and female mice at P75 (e), and four CNS regions of male mice at P75 (f). Note that the PCA of the myelin proteome of both the three ages, and the four CNS regions, but not of the two sexes, shows evident clustering into distinct groups. (g–i) Clustered heatmaps showing Pearson's correlation coefficients for protein abundance, comparing the UDMSE proteome datasets of CNS myelin purified from the brains of male mice at P18, P75, and 6 months (g), the brains of male and female mice at P75 (h), and four CNS regions of male mice at P75 (i). Note that myelin at P18 clusters away from myelin at P75 and 6 months (g), and that the CNS regions display evident clustering (i). Conversely, the proteomes of male and female myelin do not show evident clustering (h).
FIGURE 2
FIGURE 2
Changes of the CNS myelin proteome during postnatal brain maturation. (a, b) Volcano plots comparing the UDMSE proteome datasets of myelin purified from the brains of mice at P18 and P75 (a), and at P75 and 6 months (b). Protein abundance is plotted as log2‐transformed fold‐change (FC) on the x‐axis against the −log10‐transformed adjusted p‐value (p.adj) on the y‐axis. Stippled lines respectively indicate a minimal log2FC of |1.0| (factor >2.0 on normal scale) and a minimal −log10‐transformed p.adj‐value of 1.301 (p.adj <.05 on normal scale) as significance threshold. n = 3 biological replicates were analyzed per group with two technical replicates each. Datapoints highlighted in blue represent known myelin proteins; gray datapoints represent other proteins mass spectrometrically quantified in myelin. Note that the myelin proteome changes considerably between P18 and P75 but remains comparatively similar between P75 and 6 months. For entire dataset see Supplemental Table S1. (c) Heatmap displaying selected known myelin proteins with higher (magenta) or lower (green) abundance in myelin purified from the brains of mice at P18, P75, and 6 months compared to the averaged abundance in myelin at 6 months of age. Heatmap shows three biological replicates per condition with two technical replicates each. Note that myelin maturation coincides with an increase in the abundance of all subunits of the myelin septin filament (SEPTIN2, SEPTIN4, SEPTIN7, SEPTIN8, and ANLN) and multiple proteins (CA2, CA14, CD82, GSTP1, CRYAB, and QDPR) with potentially protective functions, as well as decreased abundance of multiple proteins associated with actin or microtubules (GSN, SIRT2, CFL1, and CFL2). (d) Immunoblot analysis of selected myelin proteins confirms mass spectrometrically quantified abundance changes during myelin maturation. Blot shows n = 2 mice per age. Fast green protein staining as loading control.
FIGURE 3
FIGURE 3
Validation of QDPR as a marker for oligodendrocytes and myelin. (a) Abundance of mRNA encoding quinoid dihydropteridine reductase (Qdpr) in cells immunopanned from mouse cortex according to a previously published cell‐type specific RNA‐Seq dataset (Zhang et al., 2014). Note that Qdpr mRNA is enriched in myelinating oligodendrocytes (MOL) compared to neurons (N), astrocytes (AS), microglia (MG), endothelial cells (EC), oligodendrocyte precursor cells (OPC), and newly formed oligodendrocytes (NFO). For comparison, mRNA abundance of the oligodendrocyte markers Carbonic anhydrase 2 (Car2/CA2) and Brain‐enriched myelin‐associated protein (Bcas1/BCAS1) was plotted. Mean ± SEM; n = 2; stippled line indicates 40 FPKM (fragments per kilobase of transcript per million mapped reads). (b) Violin plot of Qdpr mRNA abundance in MOL of humans and mice according to previously integrated scRNA‐seq data (Gargareta et al., 2022). Each datapoint represents one MOL. Note that Qdpr mRNA is expressed in both mouse and human MOL. (c) Immunohistochemical analysis of coronal brain sections of C57Bl/6N mice at P75 immunolabeled for QDPR (green) and the oligodendrocyte marker CA2 (magenta). Arrowheads point at double‐immunopositive cell bodies in the corpus callosum. Image representative of n = 3 mice. Scale bar 20 μm. (d) Immunohistochemical analysis of coronal brain sections of C57Bl/6N mice at P17 immunolabeled for QDPR (green) and the oligodendrocyte marker BCAS1 (magenta). Arrowheads point at double‐immunopositive cell bodies in the cortex. Image representative of n = 4 mice. Scale bar 20 μm. (e) Quantitative assessment of QDPR+/CA2+ double‐immunopositive cells, QDPR+/CA2 single‐immunopositive cells, and QDPR/CA2+ single‐immunopositive cells on micrographs as in (c). Mean ± SD. Datapoints represent n = 3 individual mice. Note that most QDPR+ cells are also immunopositive for CA2. (f) Quantitative assessment of QDPR+/BCAS1+ double‐immunopositive cells, QDPR+/BCAS1 single‐immunopositive cells, and QDPR/BCAS1+ single‐immunopositive cells on micrographs as in (d). Mean ± SD. Datapoints represent n = 3 individual mice. Note that most QDPR+ cells are also immunopositive for BCAS1. (g) Immunoblot analysis of brain lysate and myelin purified from the brains of C57Bl/6N mice at P75. Note that myelin markers (MBP, CNP) are enriched in purified myelin while markers of other cellular sources including oligodendrocyte cell bodies (OLIG2) are reduced. The moderate enrichment of QDPR with myelin purification is thus consistent with localization in both oligodendrocyte cell bodies and myelin. Blot shows n = 3 mice per fraction. (h) Immunohistochemical analysis of longitudinal spinal cord sections of C57Bl/6N mice at age 6 months immunolabeled for QDPR (green) and the myelin marker MOG (magenta). Arrowheads point at double‐immunopositive myelin sheaths. Image representative of n = 4 mice. Scale bar 5 μm. (i) Immunodetection of QDPR visualized with 10 nm gold particles (white arrowheads) pointing at gold particles that appear as black puncta on cryo‐sectioned optic nerves of C57Bl/6N mice at age 8 months. Image representative of n = 3 mice. Note that QDPR labeling in axon/myelin‐units was mostly confined to the adaxonal myelin compartment. Scale bar 100 nm.
FIGURE 4
FIGURE 4
The CNS myelin proteome of male and female mice is essentially similar. (a) Volcano plot comparing the UDMSE proteome datasets of myelin purified from the brains of male and female C57Bl/6N mice at P75. Protein abundance is plotted as log2‐transformed fold‐change (FC) on the x‐axis against the −log10‐transformed adjusted p‐value (p.adj) on the y‐axis. Stippled lines respectively indicate a minimal log2FC of |1.0| (factor >2.0 on normal scale) and a minimal −log10‐transformed p.adj‐value of 1.301 (p.adj <.05 on normal scale) as significance threshold. Datapoints highlighted in blue represent known myelin proteins; gray datapoints represent other proteins mass spectrometrically quantified in myelin. n = 3 biological replicates were analyzed per group with two technical replicates each. Note that male and female mice display essentially similar CNS myelin proteomes. For entire dataset see Supplemental Table S2. (b) Heatmap displaying selected known myelin proteins with higher (magenta) or lower (green) abundance in myelin purified from the brains of female or male mice compared to the averaged abundance in myelin of male mice. Note that the relative abundance of known myelin proteins is essentially similar. Columns represent n = 3 biological replicates per group with two technical replicates each. (c) Immunoblot analysis of selected myelin proteins confirms the proteome analysis results. Fast green protein staining as loading control. Blot shows n = 3 mice per group.
FIGURE 5
FIGURE 5
Comparing the proteome of myelin purified from different CNS regions. (a, b) Heatmap displaying selected myelin proteins (a) as well as mitochondrial and synaptic proteins (b) with higher (magenta) or lower (green) abundance or not detected (black) in myelin‐enriched fractions purified from cortex, optic nerve, spinal cord or corpus callosum (cc) dissected from C57Bl/6N mice at P75 compared to the averaged abundance in corpus callosum myelin. Columns represent three biological replicates per group with four technical replicates each. For each biological replicate, the respective CNS regions dissected from three mice were pooled before myelin purification. Note that proteins associated with mitochondria and synapses are strongly enriched in myelin purified from the gray matter (cortex) or a mixed CNS region (spinal cord) compared to the white matter (optic nerve, corpus callosum), indicating that mitochondrial and synaptic membranes partially co‐purify with the myelin fraction. For entire dataset see Supplemental Table S3. (c, d) Immunoblot analysis of selected myelin proteins (c) as well as mitochondrial (MTCO1, VDAC) and synaptic proteins (SV2A, PSD95) (d) confirms the higher abundance of synaptic and mitochondrial proteins that co‐purify with cortical myelin. Fast Green protein staining as loading control. Blot shows n = 2 mice per region. (e) Quantification in parts per million (PPM) of known myelin proteins (magenta), mitochondrial proteins (dark turquoise), synaptic proteins (light turquoise), and other proteins (gray) mass spectrometrically quantified by UDMSE in myelin purified from the different CNS regions. Note that mitochondrial and synaptic proteins constitute 4.2% of the total protein in myelin purified from cortex compared with 0.8%–1.7% of the total protein in myelin purified from optic nerve, spinal cord or corpus callosum.

Similar articles

Cited by

References

    1. Alvarez‐Sanchez, N. , & Dunn, S. E. (2023). Immune cell contributors to the female sex bias in multiple sclerosis and experimental autoimmune encephalomyelitis. Current Topics in Behavioral Neurosciences, 62, 333–373. - PubMed
    1. Autilio, L. A. , Norton, W. T. , & Terry, R. D. (1964). The preparation and some properties of purified myelin from the central nervous system. Journal of Neurochemistry, 11, 17–27. - PubMed
    1. Benjamini, Y. , & Hochberg, Y. (1995). Controlling the false discovery rate: A practical and powerful approach to multiple testing. Journal of the Royal Statistical Society Series B: Statistical Methodology, 57, 289–300.
    1. Buscham, T. J. , Eichel‐Vogel, M. A. , Steyer, A. M. , Jahn, O. , Strenzke, N. , Dardawal, R. , Memhave, T. R. , Siems, S. B. , Müller, C. , Meschkat, M. , Sun, T. , Ruhwedel, T. , Möbius, W. , Krämer‐Albers, E.‐M. , Boretius, S. , Nave, K.‐A. , & Werner, H. B. (2022). Progressive axonopathy when oligodendrocytes lack the myelin protein CMTM5. eLife, 11, e75523. - PMC - PubMed
    1. Cammer, W. , Bieler, L. , Fredman, T. , & Norton, W. T. (1977). Quantitation of myelin carbonic anhydrase‐development and subfractionation of rat brain myelin and comparison with myelin from other species. Brain Research, 138, 17–28. - PubMed