. 2024 Oct;23(5):e70004.
doi: 10.1111/gbb.70004.

Mical1 deletion in tyrosinase expressing cells affects mouse running gaits

Affiliations

Mical1 deletion in tyrosinase expressing cells affects mouse running gaits

Katarina Micovic et al. Genes Brain Behav. 2024 Oct.

Abstract

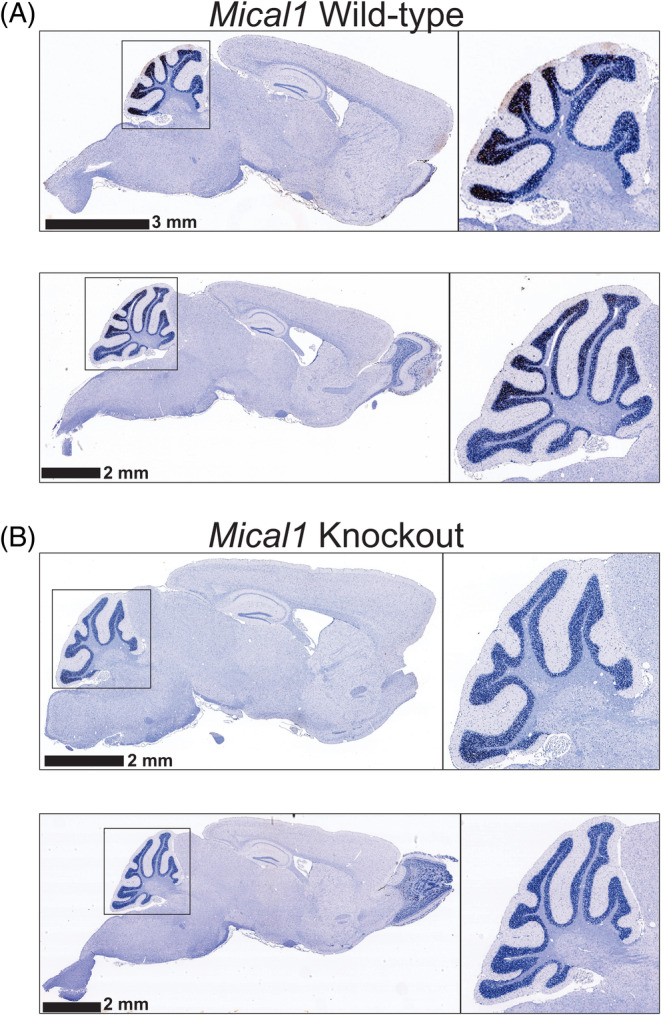
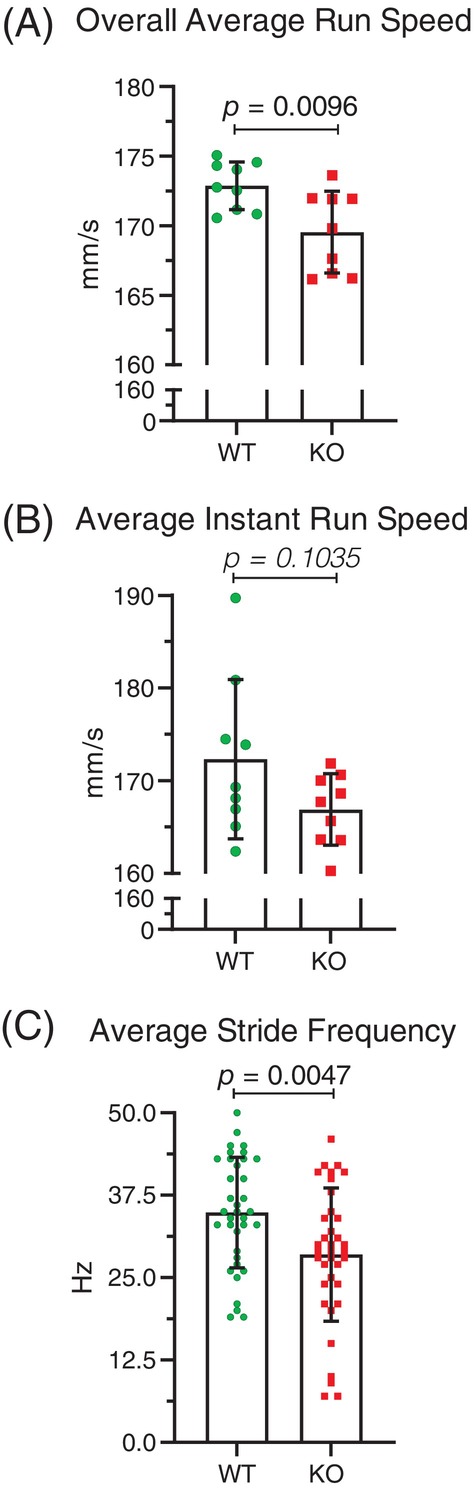
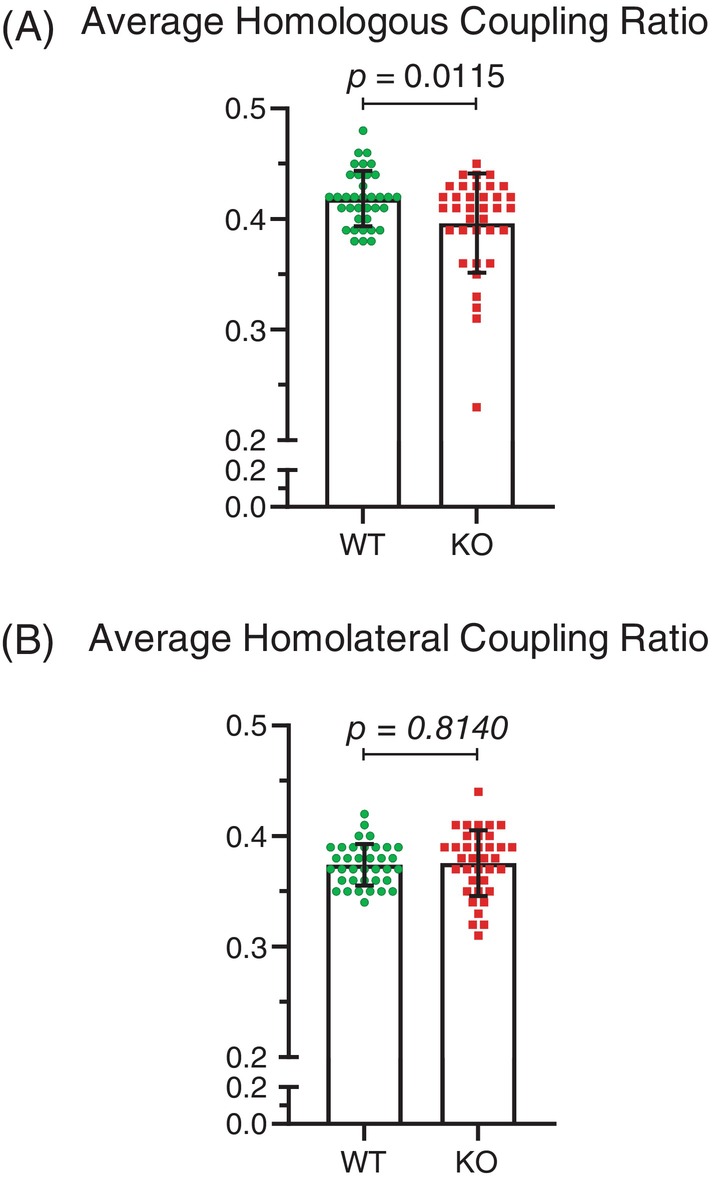
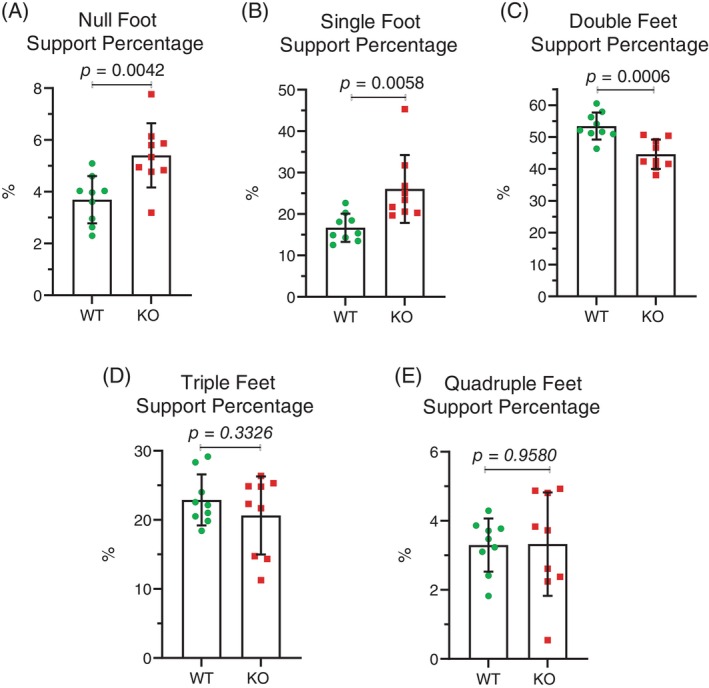
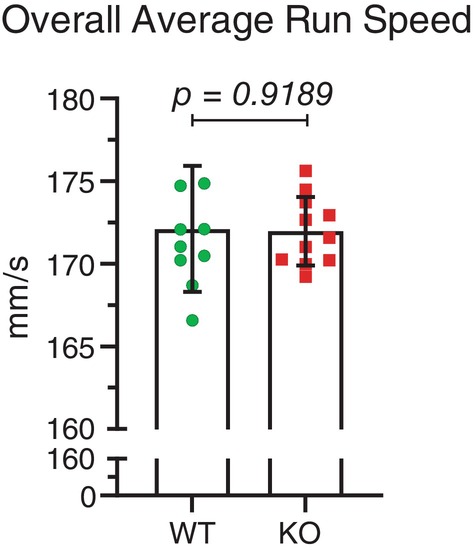
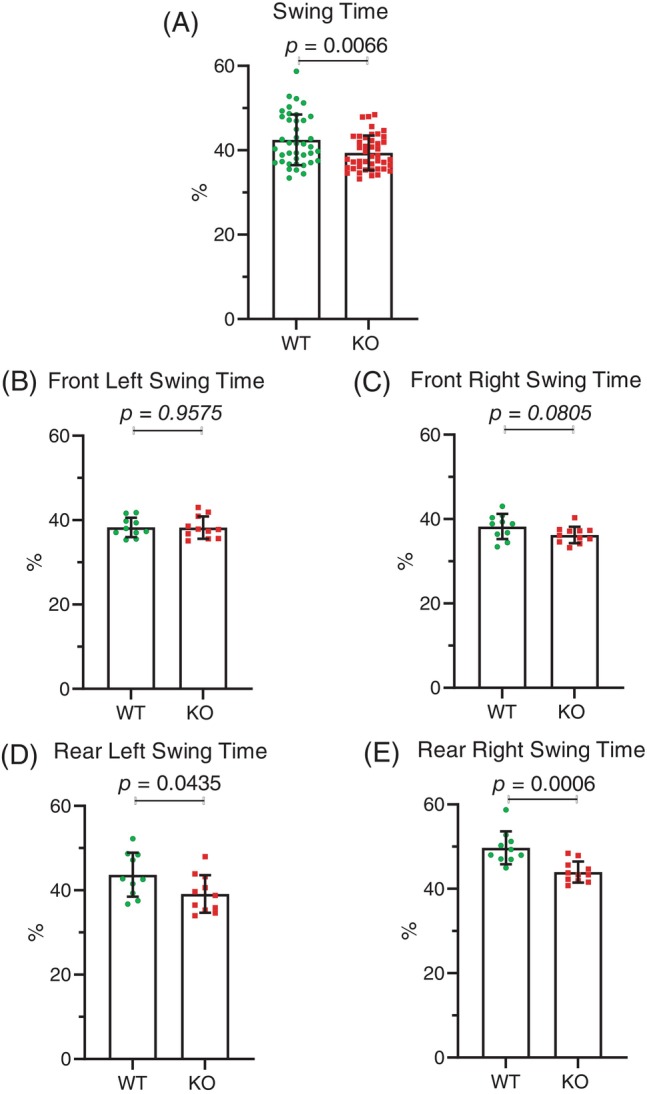
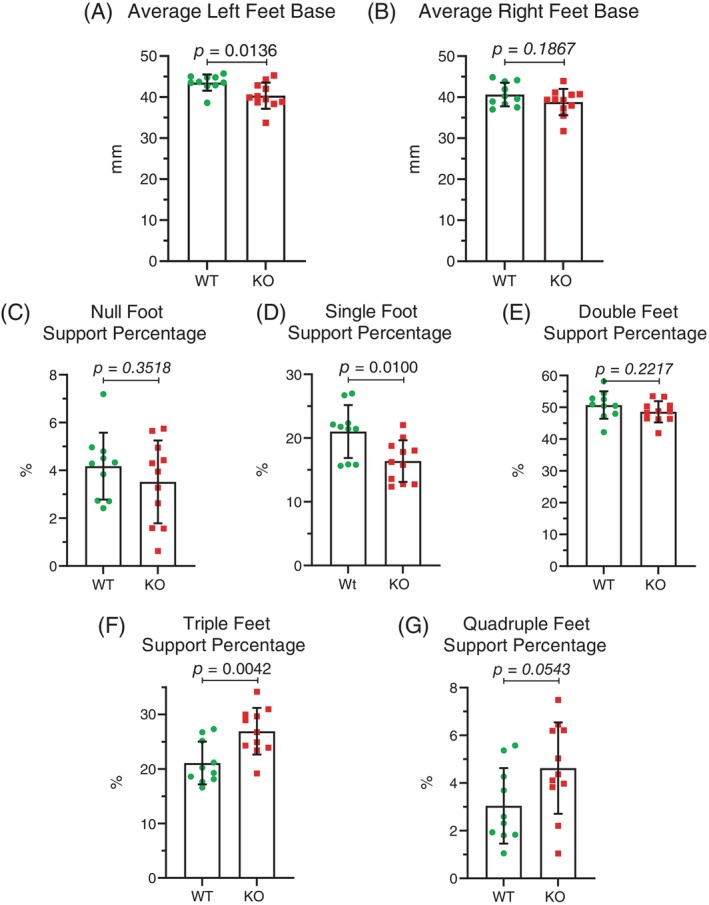
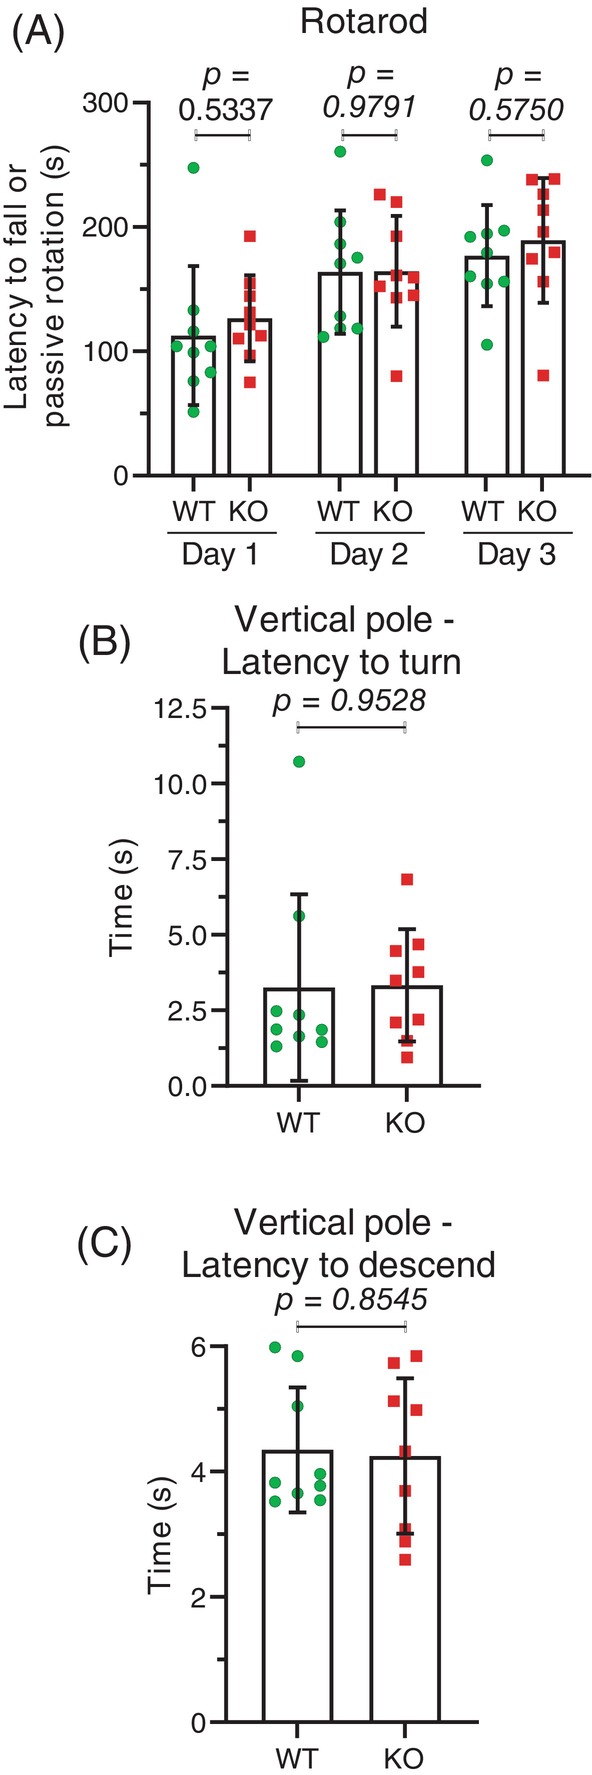
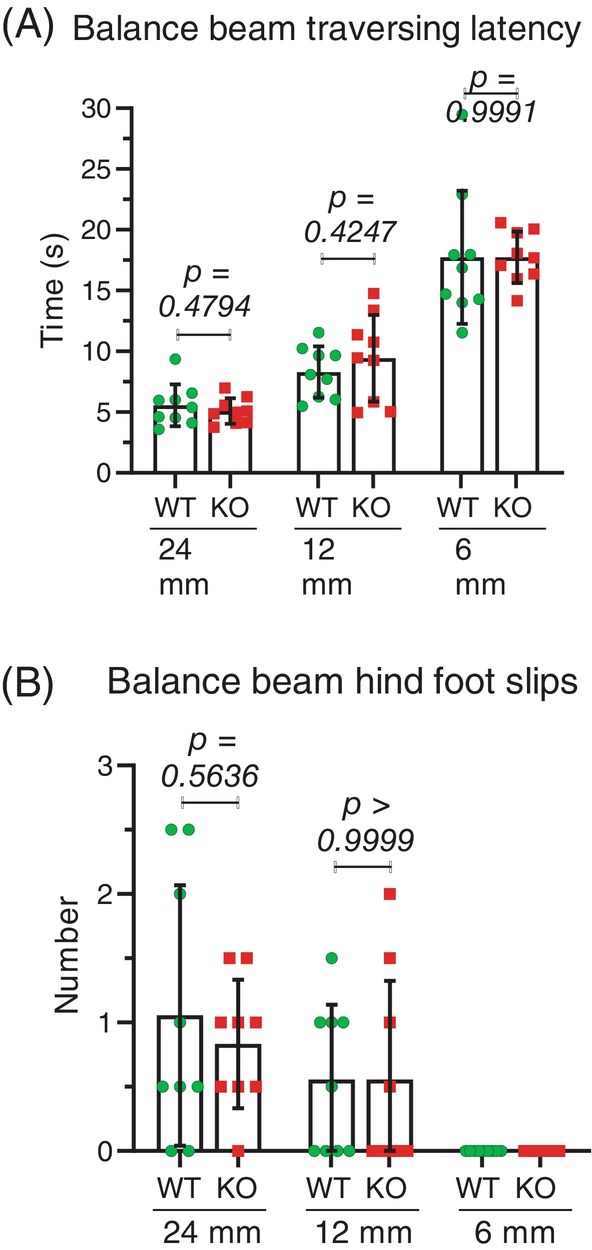
Neuronal development is a highly regulated process that is dependent on the correct coordination of cellular responses to extracellular cues. In response to semaphorin axon guidance proteins, the MICAL1 protein is stimulated to produce reactive oxygen species that oxidize actin on specific methionine residues, leading to filamentous actin depolymerization and consequent changes in neuronal growth cone dynamics. Crossing genetically modified mice homozygous for floxed Mical1 (Mical1fl/fl) alleles with transgenic mice expressing Cre recombinase under the control of a tyrosinase gene enhancer/promoter (Tyr::Cre) enabled conditional Mical1 deletion. Immunohistochemical analysis showed Mical1 expression in the cerebellum, which plays a prominent role in the coordination of motor movements, with reduced Mical1 expression in Mical1fl/fl mice co-expressing Tyr::Cre. Analysis of the gaits of mice running on a treadmill showed that both male and female Mical1fl/fl, Tyr::Cre mutant mice had significant alterations to their striding patterns relative to wild-type mice, although the specific aspects of their altered gaits differed between the sexes. Additional motor tests that involved movement on a rotating rod, descending a vertical pole, or crossing a balance beam did not show significant differences between the genotypes, suggesting that the effect of the Mical1fl/fl, Tyr::Cre genetic modifications was only manifested during specific highly coordinated movements that contribute to running. These findings indicate that there is a behavioral consequence in Mical1fl/fl, Tyr::Cre mutant mice that affects motor control as manifested by alterations in their gait.

Keywords: Mical1; actin; cytoskeleton; gait; genetic modification; reactive oxygen species; running; stride; tyrosinase.


Conflict of interest statement

The authors declare no conflict of interest.

Figures

FIGURE 1
FIGURE 1
Immunohistochemistry of Mical1 expression in wild‐type and knockout mice. Sagittal sections of mouse brains from two each of (A) Wild‐type or (B) Mical1 knockout mice were analyzed by immunohistochemistry for Mical1 expression. The size of the scale bars is indicated in each image. Regions of whole brains used for the higher magnificent insets are indicated in the black squares.
FIGURE 2
FIGURE 2
Mical1 fl/fl , Tyr::Cre mutant mice had reduced run speed and stride frequency in male mice. (A) Overall average run speeds were determined by analyzing high‐speed videos of male mice running on a treadmill for 20 s. Overall running speed (mm/s) was obtained by dividing the total distance traveled by the center of the animal by the time it took to travel that distance. Results presented are for each mouse. (B) Instantaneous running speed (mm/s) of a stride is the ratio of the stride length to the stride time. Results presented are for each mouse. (C) Stride frequency is the ratio of the number of strides to the sum of the stride times of these strides, which yields the number of strides per second (Hz) for a given foot. Results presented are for all 4 ft. Graphs indicate means ± standard deviation. Statistical tests with Student's t‐test. p values <0.05 indicated in bold typeface, p values ≥0.05 indicated in italic typeface. N = 9 mice per genotype. KO, knockout; WT, wild‐type.
FIGURE 3
FIGURE 3
Mical1 fl/fl , Tyr::Cre mutant mice showed alterations in the coordination of left and right foot movements in front or right halves of male mice. (A) The homologous coupling ratio parameter is the fraction of the stride of a reference foot when the opposite foot on the same half (front half or rear half) starts its stride, revealing the coordination between left and right feet on the same half. (B) The homolateral coupling parameter is the fraction of the stride of a reference foot when the other foot on the same side (left or right side) starts its stride, indicating the coordination between front and rear feet on the same side. Results presented are for all 4 ft. Graphs indicate means ± standard deviation. Statistical tests with Student's t‐test. p values <0.05 indicated in bold typeface, p values ≥0.05 indicated in italic typeface. N = 9 mice per genotype. KO, knockout; WT, wild‐type.
FIGURE 4
FIGURE 4
Mical1 fl/fl , Tyr::Cre mutant male mice had altered stride patterns during running. The percentage of the analysis time during which the number of feet touching the treadmill surface during running were: (A) none; (B) one; (C) two; (D) three; (E) four. Results presented are for each mouse. Graphs indicate means ± standard deviation. Statistical tests with Student's t‐test. p values <0.05 indicated in bold typeface, p values ≥0.05 indicated in italic typeface. N = 9 mice per genotype. KO, knockout; WT, wild‐type.
FIGURE 5
FIGURE 5
Mical1 fl/fl , Tyr::Cre mutant female mice did not have changes in overall running speed. Overall average runs speeds were determined by analyzing high‐speed videos of female mice running on a treadmill for 20 s. Overall running speed (mm/s) was obtained by dividing the total distance traveled by the center of the animal by the time it took to travel that distance. Results presented are for each mouse. Graphs indicate means ± standard deviation. Statistical tests with Student's t‐test. p value ≥0.05 indicated in italic typeface. N = 10 wild‐type mice, N = 11 Mical1 knockout (KO) mice. WT, wild‐type.
FIGURE 6
FIGURE 6
Mical1 fl/fl , Tyr::Cre mutant female mice had increased stance times. (A) The percentage of time spent during a single stride in which feet were in contact with the treadmill surface (stance position) for all four legs for all mice (N = 40 wild‐type mice, N = 44 Mical1 knockout [KO] mice). For each foot, results are presented for the (B) front left, (C) front right, (D) rear left, (E) rear right stance positions. Graphs indicate means ± standard deviation. Statistical tests with Student's t‐test. p values <0.05 indicated in bold typeface, p values ≥0.05 indicated in italic typeface. N = 10 wild‐type mice, N = 11 Mical1 KO mice. WT, wild‐type.
FIGURE 7
FIGURE 7
Mical1 fl/fl , Tyr::Cre mutant female mice had increased swing times. (A) The percentage of time spent during a single stride in which feet were not in contact with the treadmill surface (swing position) for all four legs for all mice (N = 40 wild‐type (WT) mice, N = 44 Mical1 knockout [KO] mice). For each foot, results are presented for the (B) front left, (C) front right, (D) rear left, (E) rear right swing positions. Graphs indicate means ± standard deviation. Statistical tests with Student's t‐test. p values <0.05 indicated in bold typeface, p values ≥0.05 indicated in italic typeface. N = 10 WT mice, N = 11 Mical1 KO mice.
FIGURE 8
FIGURE 8
Mical1 fl/fl , Tyr::Cre mutant female mice had altered foot positioning during running. The distance between the midpoint of the trajectory of the front foot stance and the midpoint of the trajectory of the rear foot stance for the (A) Left or (B) Right foot pairs. The percentage of the analysis time during which the number of feet touching the treadmill surface during running were: (C) none; (D) one; (E) two; (F) three; (G) four. Results presented are for each mouse. Graphs indicate means ± standard deviation. Statistical tests with Student's t‐test. p values <0.05 indicated in bold typeface, p values ≥0.05 indicated in italic typeface. N = 10 wild‐type (WT) mice, N = 11 Mical1 knockout (KO) mice.
FIGURE 9
FIGURE 9
Mical1 fl/fl , Tyr::Cre mutant mice had no differences in rotarod or vertical pole tests. (A) Mice were on a rod rotating at 40 rpm and the time for them to fall off or to allow themselves to passively rotate was recorded. Averages of three independent trials performed each day are reported for each mouse. Graphs indicate means ± standard deviation. Statistical test with one‐way ANOVA and post‐hoc Tukey's multiple comparisons test. p values <0.05 indicated in bold typeface, p values ≥0.05 indicated in italic typeface. N = 9 mice per genotype. (B) The time taken for mice to turn downwards after having been placed in the centre of a 60 cm pole that was tilted 90°. (C) The time taken for mice to descend from the centre of a 60 cm pole that was tilted 90°. Results presented are the averages from three independent trials for each mouse. Graphs indicate means ± standard deviation. Statistical tests with Student's t‐test. p values ≥0.05 indicated in italic typeface. N = 9 mice per genotype. KO, knockout; WT, wild‐type.
FIGURE 10
FIGURE 10
No effect in Mical1 fl/fl , Tyr::Cre mutant mice on their movement across balance beams. (A) Time taken for mice to cross 90 cm round beams of varying widths (24, 12 and 6 mm). (B) The number of hind foot slips during the crossing of the balance beams. Results presented are the averages from two independent trials for each mouse. Graphs indicate means ± standard deviation. Statistical test with one‐way ANOVA and post‐hoc Tukey's multiple comparisons test. p values ≥0.05 indicated in italic typeface. N = 9 mice per genotype. KO, knockout; WT, wild‐type.

Similar articles

References

    1. Cheever TR, Ervasti JM. Actin isoforms in neuronal development and function. Int Rev Cell Mol Biol. 2013;301:157‐213. - PubMed
    1. Nelson JC, Stavoe AKH, Colón‐Ramos DA. The actin cytoskeleton in presynaptic assembly. Cell Adh Migr. 2013;7(4):379‐387. - PMC - PubMed
    1. Compagnucci C, Piemonte F, Sferra A, Piermarini E, Bertini E. The cytoskeletal arrangements necessary to neurogenesis. Oncotarget. 2016;7(15):19414‐19429. - PMC - PubMed
    1. Goellner B, Aberle H. The synaptic cytoskeleton in development and disease. Dev Neurobiol. 2012;72(1):111‐125. - PubMed
    1. Schneider F, Metz I, Rust MB. Regulation of actin filament assembly and disassembly in growth cone motility and axon guidance. Brain Res Bull. 2023;192:21‐35. - PubMed

Substances

LinkOut - more resources