Deletion of miR-33, a regulator of the ABCA1-APOE pathway, ameliorates neuropathological phenotypes in APP/PS1 mice
- PMID: 39345217
- PMCID: PMC11567857
- DOI: 10.1002/alz.14243
Deletion of miR-33, a regulator of the ABCA1-APOE pathway, ameliorates neuropathological phenotypes in APP/PS1 mice
Abstract
Introduction: Rare variants in ABCA1 increase the risk of developing Alzheimer's disease (AD). ABCA1 facilitates the lipidation of apolipoprotein E (apoE). This study investigated whether microRNA-33 (miR-33)-mediated regulation of this ABCA1-APOE pathway affects phenotypes of an amyloid mouse model.
Methods: We generated mir-33+/+;APP/PS1 and mir-33-/-;APP/PS1 mice to determine changes in amyloid pathology using biochemical and histological analyses. We used RNA sequencing and mass spectrometry to identify the transcriptomic and proteomic changes between our genotypes. We also performed mechanistic experiments by determining the role of miR-33 in microglial migration and amyloid beta (Aβ) phagocytosis.
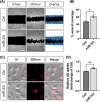
Results: Mir-33 deletion increases ABCA1 levels and reduces Aβ accumulation and glial activation. Multi-omics studies suggested miR-33 regulates the activation and migration of microglia. We confirm that the inhibition of miR-33 significantly increases microglial migration and Aβ phagocytosis.
Discussion: These results suggest that miR-33 might be a potential drug target by modulating ABCA1 level, apoE lipidation, Aβ level, and microglial function.
Highlights: Loss of microRNA-33 (miR-33) increased ABCA1 protein levels and the lipidation of apolipoprotein E. Loss of miR-33 reduced amyloid beta (Aβ) levels, plaque deposition, and gliosis. mRNAs and proteins dysregulated by miR-33 loss relate to microglia and Alzheimer's disease. Inhibition of miR-33 increased microglial migration and Aβ phagocytosis in vitro.
Keywords: ABCA1; Alzheimer's disease; amyloid; apolipoprotein E; lipid metabolism; microRNA‐33.
© 2024 The Author(s). Alzheimer's & Dementia published by Wiley Periodicals LLC on behalf of Alzheimer's Association.
Conflict of interest statement
The authors declare no conflicts of interest. Author disclosures are available in the supporting information.
Figures


Similar articles
-
Delphinidin attenuates cognitive deficits and pathology of Alzheimer's disease by preventing microglial senescence via AMPK/SIRT1 pathway.Alzheimers Res Ther. 2025 Jun 20;17(1):138. doi: 10.1186/s13195-025-01783-x. Alzheimers Res Ther. 2025. PMID: 40542425 Free PMC article.
-
Selective reduction of astrocyte apoE3 and apoE4 strongly reduces Aβ accumulation and plaque-related pathology in a mouse model of amyloidosis.Mol Neurodegener. 2022 Feb 2;17(1):13. doi: 10.1186/s13024-022-00516-0. Mol Neurodegener. 2022. PMID: 35109920 Free PMC article.
-
Amyloid precursor protein and presenilin-1 knock-in immunodeficient mice exhibit intraneuronal Aβ pathology, microgliosis, and extensive neuronal loss.Alzheimers Dement. 2025 Apr;21(4):e70084. doi: 10.1002/alz.70084. Alzheimers Dement. 2025. PMID: 40195277 Free PMC article.
-
Systematic review of the relationship between amyloid-β levels and measures of transgenic mouse cognitive deficit in Alzheimer's disease.J Alzheimers Dis. 2015;44(3):787-95. doi: 10.3233/JAD-142208. J Alzheimers Dis. 2015. PMID: 25362040 Free PMC article.
-
Genetics and Epigenetics of Alzheimer's Disease: Understanding Pathogenesis and Exploring Therapeutic Potential.J Mol Neurosci. 2025 May 30;75(2):72. doi: 10.1007/s12031-025-02363-2. J Mol Neurosci. 2025. PMID: 40447964 Review.
Cited by
-
Polyphenols and miRNA interplay: a novel approach to combat apoptosis and inflammation in Alzheimer's disease.Front Aging Neurosci. 2025 May 7;17:1571563. doi: 10.3389/fnagi.2025.1571563. eCollection 2025. Front Aging Neurosci. 2025. PMID: 40400913 Free PMC article. Review.
-
The Bromodomain and Extraterminal Protein Inhibitor Apabetalone Ameliorates Kidney Injury in Diabetes by Regulating Cholesterol Accumulation and Modulating the Gut Microbiota.Kidney Int Rep. 2024 Nov 22;10(2):522-534. doi: 10.1016/j.ekir.2024.11.022. eCollection 2025 Feb. Kidney Int Rep. 2024. PMID: 39990894 Free PMC article.
References
-
- Corder EH, Saunders AM, Strittmatter WJ, et al. Gene dose of apolipoprotein E type 4 allele and the risk of Alzheimer's disease in late onset families. Science. 1993;261(5123):921‐923. - PubMed
MeSH terms
Substances
Grants and funding
- R01 AG053500/AG/NIA NIH HHS/United States
- F31 AG074673/AG/NIA NIH HHS/United States
- R01 AG074543/AG/NIA NIH HHS/United States
- RF1AG074543/AG/NIA NIH HHS/United States
- R01AG053500/AG/NIA NIH HHS/United States
- R01 AG071281/AG/NIA NIH HHS/United States
- R01 AG077829/AG/NIA NIH HHS/United States
- F300AG079580/AG/NIA NIH HHS/United States
- R01AG054102/AG/NIA NIH HHS/United States
- R01AG077829/AG/NIA NIH HHS/United States
- RF1 AG074543/AG/NIA NIH HHS/United States
- F31AG074673/AG/NIA NIH HHS/United States
- F30 AG079580/AG/NIA NIH HHS/United States
- R01 AG054102/AG/NIA NIH HHS/United States
- 11-23-PDF-09/American Diabetes Association
- R01AG071281/AG/NIA NIH HHS/United States
LinkOut - more resources
Full Text Sources
Medical
Molecular Biology Databases
Miscellaneous

