. 2024 Jul 11;11(9):nwae231.
doi: 10.1093/nsr/nwae231. eCollection 2024 Sep.

Pan-cancer integrative analyses dissect the remodeling of endothelial cells in human cancers

Affiliations

Pan-cancer integrative analyses dissect the remodeling of endothelial cells in human cancers

Jinhu Li et al. Natl Sci Rev. .

Abstract

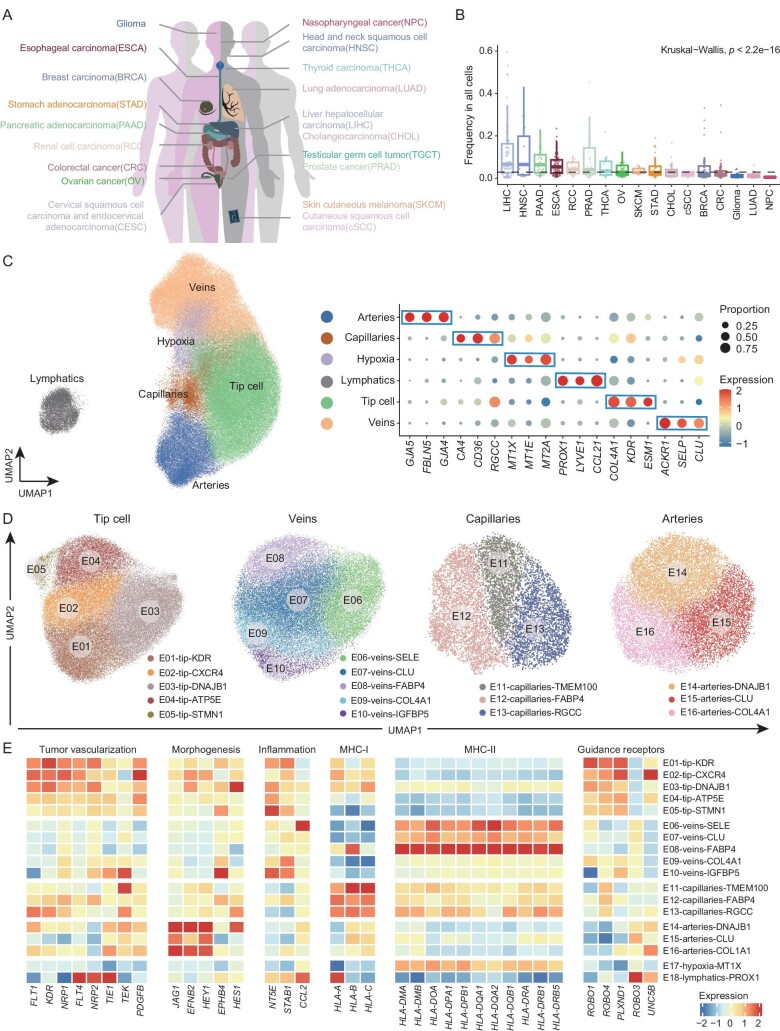
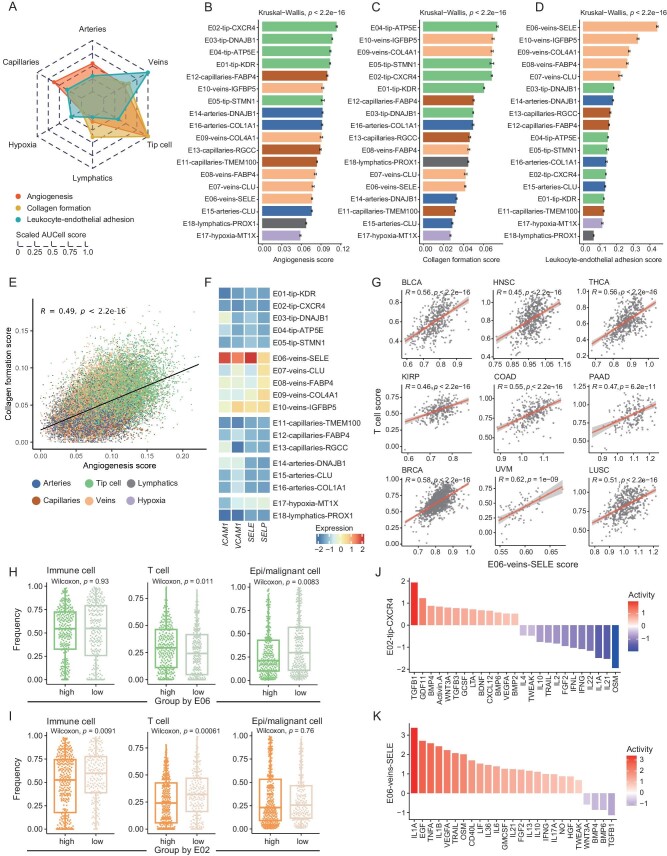
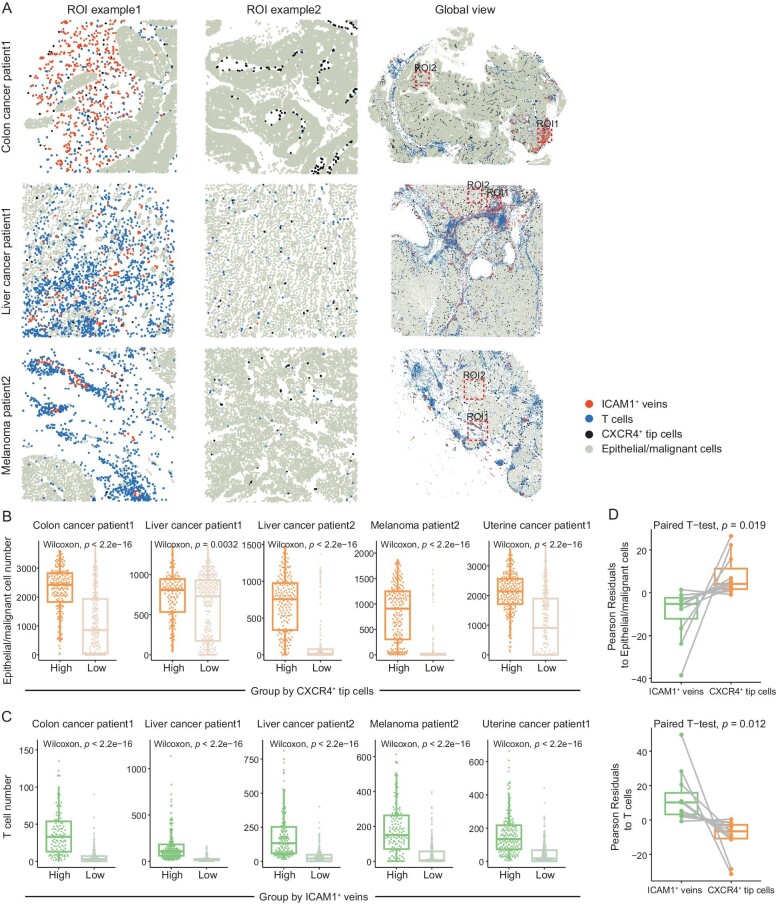
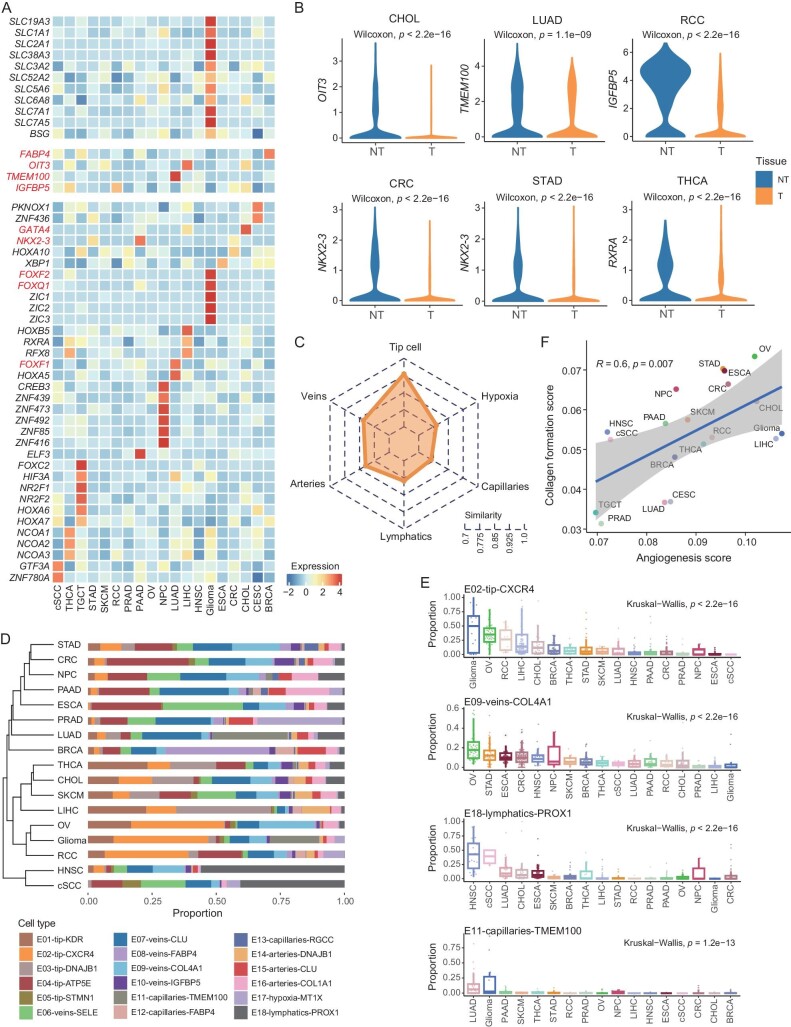
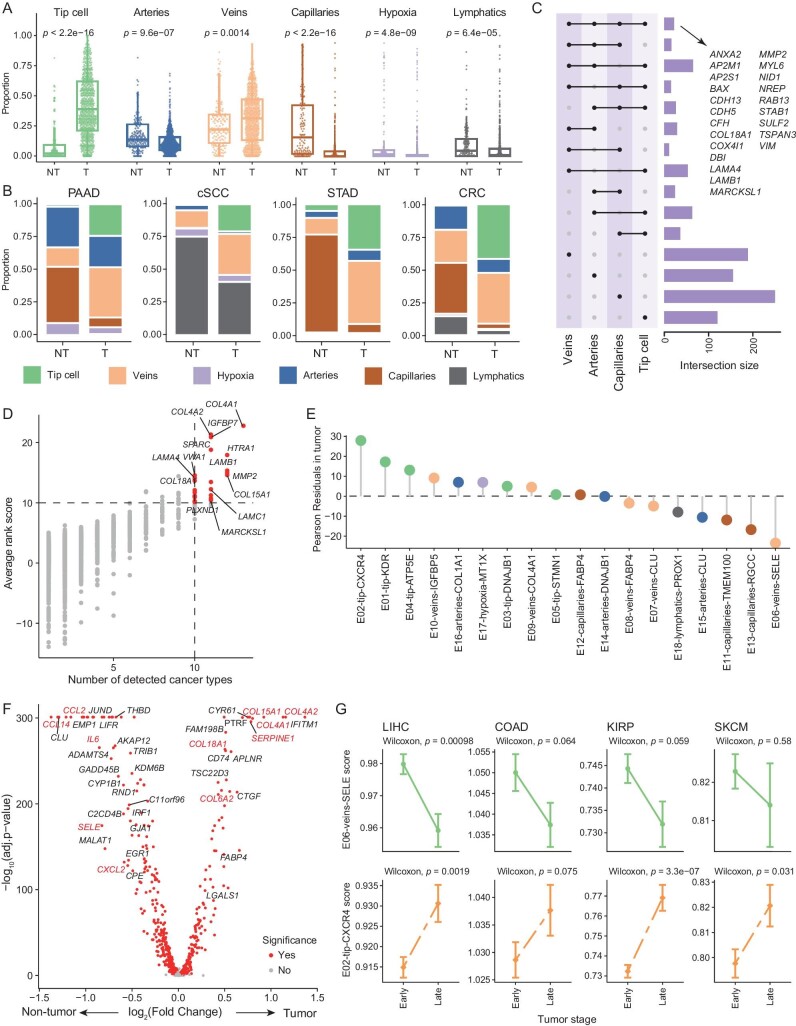
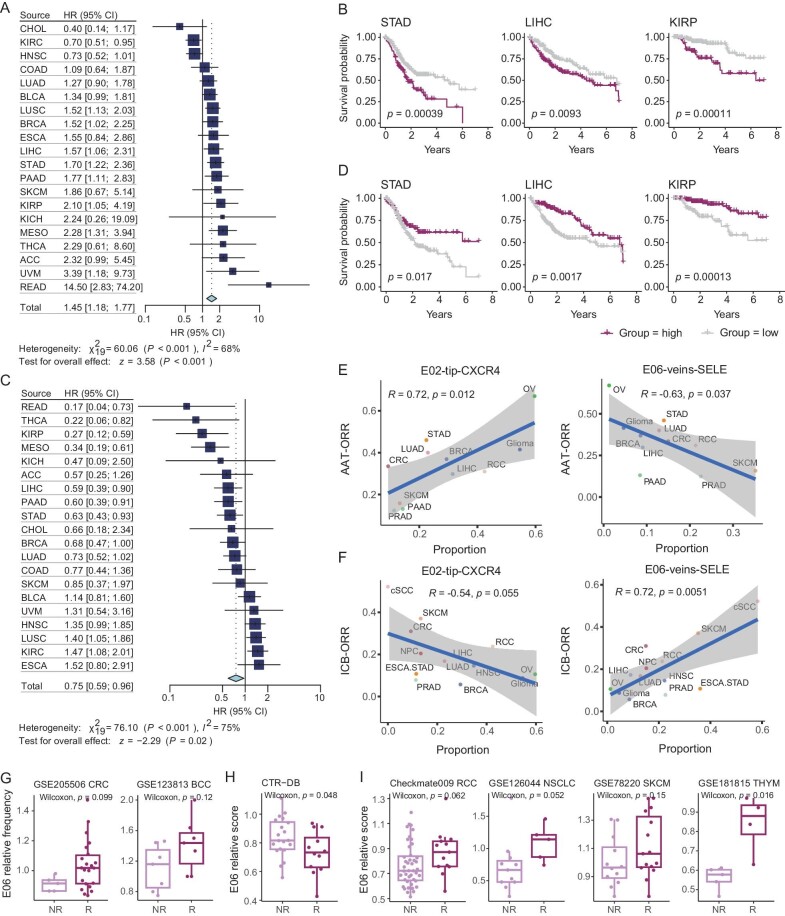
Therapeutics targeting tumor endothelial cells (TECs) have been explored for decades, with only suboptimal efficacy achieved, partly due to an insufficient understanding of the TEC heterogeneity across cancer patients. We integrated single-cell RNA-seq data of 575 cancer patients from 19 solid tumor types, comprehensively charting the TEC phenotypic diversities. Our analyses uncovered underappreciated compositional and functional heterogeneity in TECs from a pan-cancer perspective. Two subsets, CXCR4 + tip cells and SELE + veins, represented the prominent angiogenic and proinflammatory phenotypes of TECs, respectively. They exhibited distinct spatial organization patterns, and compared to adjacent non-tumor tissues, tumor tissue showed an increased prevalence of CXCR4 + tip cells, yet with SELE + veins depleted. Such functional and spatial characteristics underlie their differential associations with the response of anti-angiogenic therapies and immunotherapies. Our integrative resources and findings open new avenues to understand and clinically intervene in the tumor vasculature.

Keywords: immunotherapy; pan-cancer; single-cell RNA-seq; tumor endothelial cell.


Figures

Figure 1.
Figure 1.
Construction of a pan-cancer single-cell atlas of endothelial cells. (A) The 19 cancer types involved in the integrative pan-cancer analysis. (B) The frequency of ECs within all cells for tumor samples across various cancer types. Dashed line indicates the median value. Kruskal–Wallis test. (C) Uniform Manifold Approximation and Projection (UMAP) visualization of the major compartments of ECs (left), and bubble heatmap showing the expression patterns of corresponding signature genes of each major compartment (right). Dot size represents the proportion of expressing cells. Color indicates the Z score scaled gene expression levels. (D) UMAP visualizations of all EC subsets within their corresponding major compartments. (E) Heatmap showing the expression patterns of functional genes in EC subsets. Color indicates the Z score scaled gene expression levels.
Figure 2.
Figure 2.
Phenotypical heterogeneity of endothelial cell subsets. (A) Radar chart comparing the functional scores of all major compartments of ECs. (B–D) Bar plots comparing the AUCell scores of angiogenesis (B), collagen formation (C) and leukocyte-endothelial adhesion (D), among all EC subsets. Kruskal–Wallis test. Data presented as mean ± s.e.m. (E) Scatterplot showing the correlation of angiogenesis score with collagen formation score in all ECs. Each dot represents a single cell. Pearson correlation test. (F) Heatmap showing the expression patterns of ICAM1, VCAM1, SELE and SELP, among all EC subsets. Color indicates the Z score scaled gene expression levels. (G) Scatterplot showing the correlations of E06-veins-SELE score with T cell score in each cancer type of TCGA dataset. Each dot represents a tumor sample. Pearson correlation test. (H and I) Boxplots illustrate the relationship between the frequencies of E06-veins-SELE (H) and E02-tip-CXCR4 (I) and those of other cell types in the TME. Two-sided unpaired Wilcoxon test. (J and K) The predicted cytokine activities, calculated by Cytosig, in E02-tip-CXCR4 cells (J) and E06-veins-SELE cells (K).
Figure 3.
Figure 3.
Spatial distribution of ICAM1+ veins and CXCR4+ tip cells. (A) Scatter spatial plots showing the distribution patterns of ICAM1+ veins and CXCR4+ tip cells in both local and global views in patient samples from colon cancer, liver cancer and melanoma (Supplementary Methods). All local regions covered 1000 formula image 1000 unit area. (B and C) Boxplots comparing the numbers of epithelial/malignant cells (B) and T cells (C) between different region groups. Two-sided unpaired Wilcoxon test. (D) Boxplots comparing the Pearson residuals of ICAM1+ veins and CXCR4+ tip cells to epithelial/malignant cells (left) and T cells (right) (Supplementary Methods). Paired t-test.
Figure 4.
Figure 4.
Heterogeneity of TECs across cancer types. (A) Heatmap showing the cancer-type specific gene expression patterns in all analyzed cancer types. Color indicates the Z score scaled gene expression levels. (B) Boxplots comparing the expression of cancer-type specific genes in tumor and adjacent non-tumor tissues. Two-sided unpaired Wilcoxon test. (C) Radar chart showing the transcriptome similarity of each major compartment of ECs among all analyzed cancer types (Supplementary Methods). (D) Unsupervised hierarchical clustering of cancer types based on the cellular composition of all EC subsets in each cancer type. The average proportion of each EC subset is shown. (E) Boxplots showing the varied proportion of EC subsets among cancer types. Kruskal–Wallis test. (F) The positive correlation between angiogenesis score and collagen formation score in each cancer type. Pearson correlation test.
Figure 5.
Figure 5.
The characteristics and alterations of TECs. (A) Boxplots comparing the proportion of each major compartment of ECs between tumor and adjacent non-tumor tissues. Two-sided unpaired Wilcoxon test. (B) Paired bar plots showing the composition of major compartments in tumor and adjacent non-tumor tissues of representative cancer types. (C) Upset plot displays the intersection size of upregulated genes for four major compartments of blood vascular ECs within tumors. Mode of ‘distinct’ was used. (D) Assessment and selection of the co-upregulated genes in TECs across different cancer types. The x-axis shows the number of cancer types in which the gene was detected as upregulated, and the y-axis shows the average rank score for a gene in all analyzed cancer types. (E) Lollipop plot showing the Pearson Residuals in tumor tissue for all EC subsets (Supplementary Methods). (F) Volcano plot showing differentially expressed genes for venous ECs from the tumor and adjacent non-tumor tissues. Red dots denote genes with adjusted P-value < 0.05, two-sided unpaired Wilcoxon test. (G) The variation trends of the E02-tip-CXCR4 and E06-veins-SELE scores between different stages of various cancer types in the TCGA dataset. Data presented as mean ± s.e.m. Two-sided unpaired Wilcoxon test.
Figure 6.
Figure 6.
The relationship between the population structure of TEC and clinical outcomes. (A and C) Forest plots showing the effects of E02-tip-CXCR4 cells (A) and the relative enrichment of E06-veins-SELE cells (C) on overall patient survival of each cancer type and pan-cancer level. The hazard ratios are calculated using Cox regression models with the age, gender, and stage corrected. P values are adjusted by Benjamini–Hochberg. (B and D) Kaplan–Meier plots showing the association of the signature score of E02-tip-CXCR4 cells (B) and the relative enrichment of E06-veins-SELE cells (D) in tumors with prognosis. +, censored observations; log-rank test. (E) Scatterplot showing the correlation of the proportion of E02-tip-CXCR4 cells (left) or E06-veins-SELE cells (right) with the ORR of the anti-angiogenic therapy (AAT) in various cancer types. Pearson correlation test. (F) Scatterplot showing the correlation of the proportion of E02-tip-CXCR4 cells (left) or E06-veins-SELE cells (right) with the ORR of the immune checkpoint blockade (ICB) in various cancer types. Pearson correlation test. (G) Boxplots comparing the E06-veins-SELE relative frequencies between NRs and Rs in ICB-related scRNA-seq datasets. Two-sided unpaired Wilcoxon test. (H and I) Boxplots comparing the E06-veins-SELE relative scores between non-responders (NRs) and responders (Rs) in AAT (H) and ICB (I) related datasets. Two-sided unpaired Wilcoxon test.

Similar articles

Cited by

References

    1. Binnewies M, Roberts EW, Kersten K et al. Understanding the tumor immune microenvironment (TIME) for effective therapy. Nat Med 2018; 24: 541–50. 10.1038/s41591-018-0014-x - DOI - PMC - PubMed
    1. Mellman I, Chen DS, Powles T et al. The cancer-immunity cycle: indication, genotype, and immunotype. Immunity 2023; 56: 2188–205. 10.1016/j.immuni.2023.09.011 - DOI - PubMed
    1. Wang D, Liu B, Zhang Z. Accelerating the understanding of cancer biology through the lens of genomics. Cell 2023; 186: 1755–71. 10.1016/j.cell.2023.02.015 - DOI - PubMed
    1. Cleveland AH, Fan Y. Reprogramming endothelial cells to empower cancer immunotherapy. Trends Mol Med 2024; 30: 126–35. 10.1016/j.molmed.2023.11.002 - DOI - PMC - PubMed
    1. Lugano R, Ramachandran M, Dimberg A. Tumor angiogenesis: causes, consequences, challenges and opportunities. Cell Mol Life Sci 2020; 77: 1745–70. 10.1007/s00018-019-03351-7 - DOI - PMC - PubMed

LinkOut - more resources