[Preprint]. 2024 Sep 27:2024.09.20.614050.
doi: 10.1101/2024.09.20.614050.

Spinal neuron diversity scales exponentially with swim-to-limb transformation during frog metamorphosis

Affiliations

Spinal neuron diversity scales exponentially with swim-to-limb transformation during frog metamorphosis

David Vijatovic et al. bioRxiv. .

Abstract

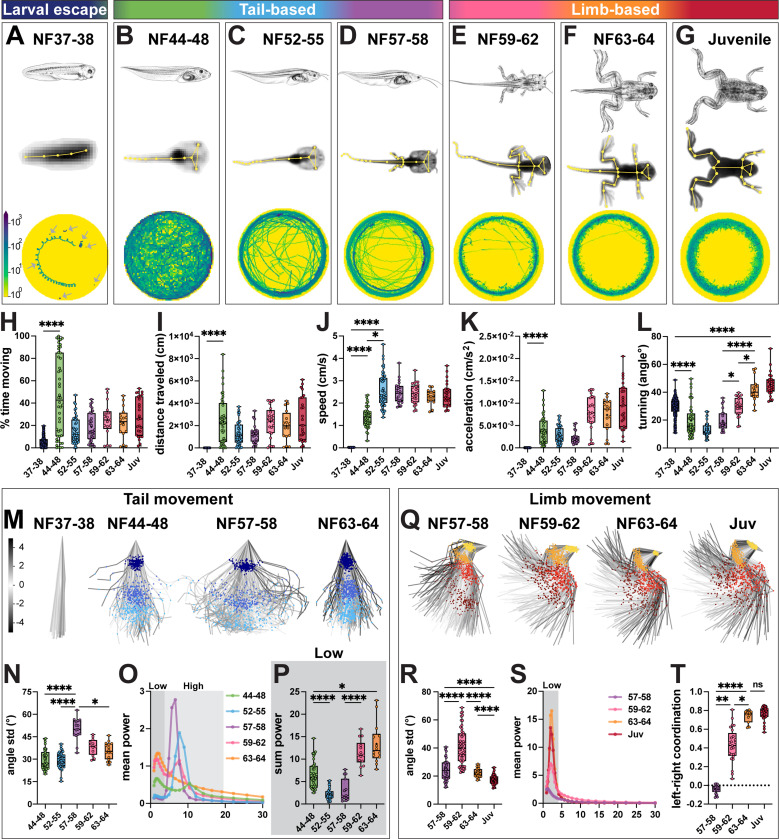
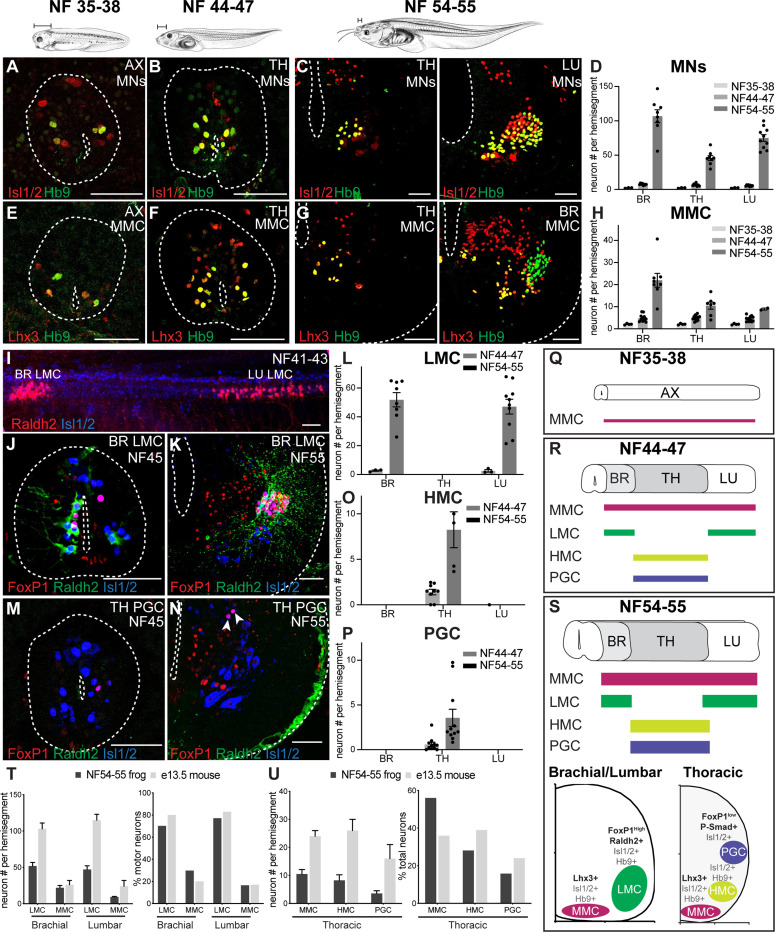
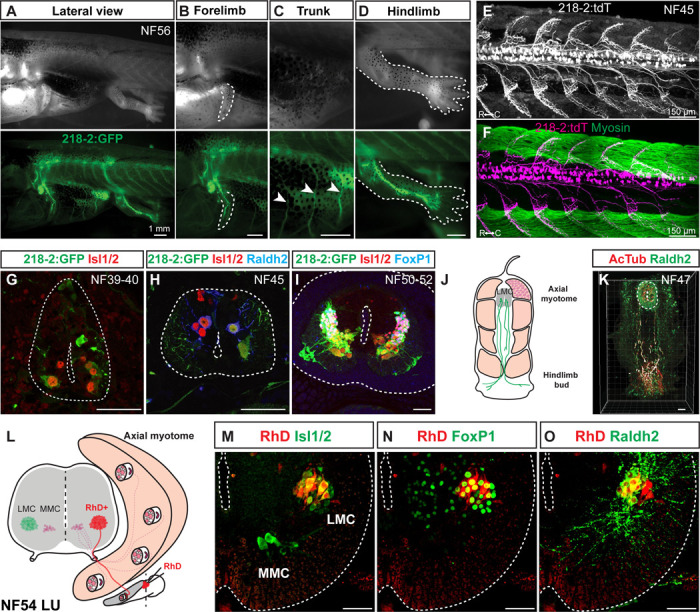
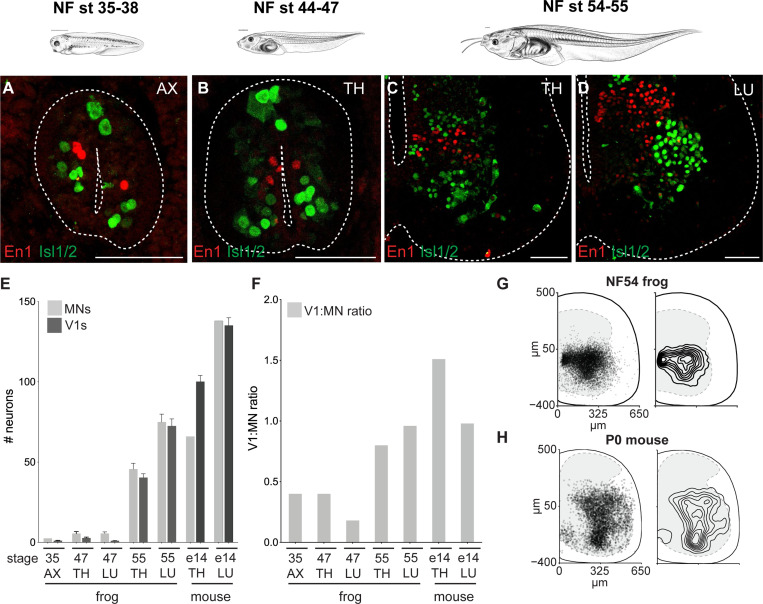
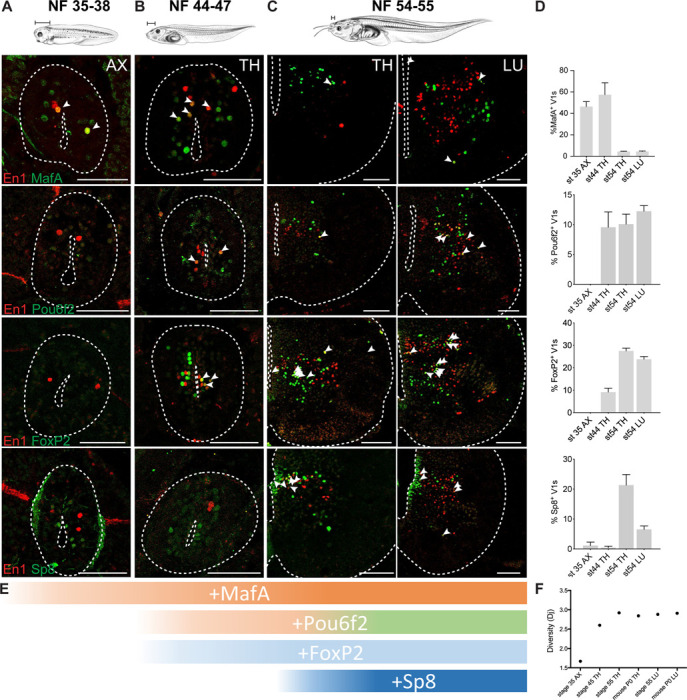
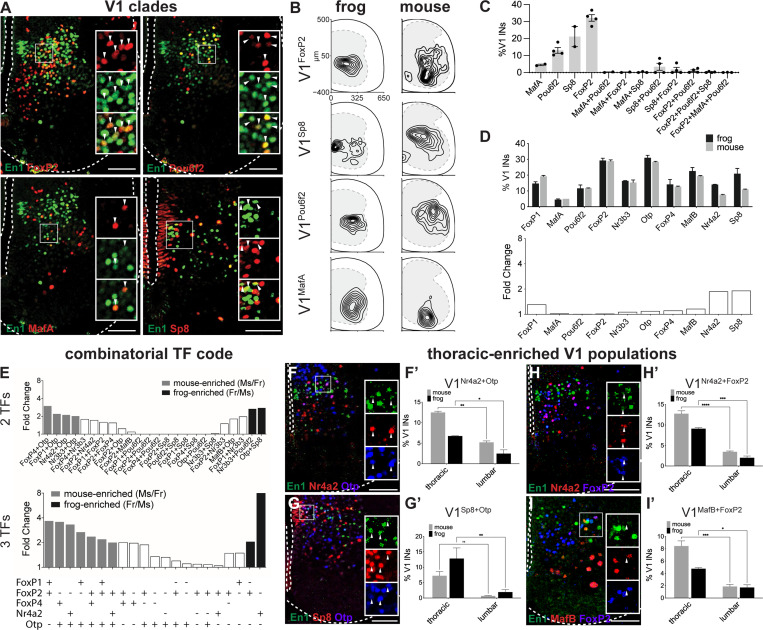
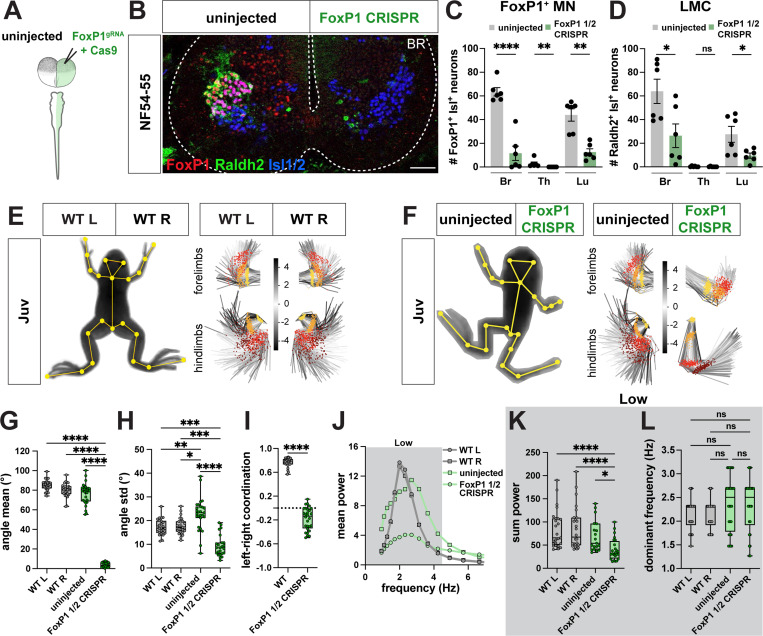
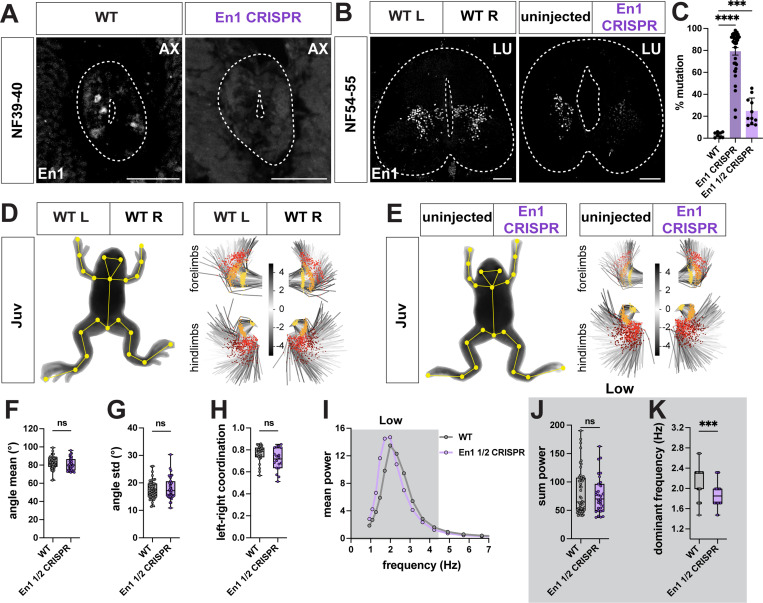
Vertebrates exhibit a wide range of motor behaviors, ranging from swimming to complex limb-based movements. Here we take advantage of frog metamorphosis, which captures a swim-to-limb-based movement transformation during the development of a single organism, to explore changes in the underlying spinal circuits. We find that the tadpole spinal cord contains small and largely homogeneous populations of motor neurons (MNs) and V1 interneurons (V1s) at early escape swimming stages. These neuronal populations only modestly increase in number and subtype heterogeneity with the emergence of free swimming. In contrast, during frog metamorphosis and the emergence of limb movement, there is a dramatic expansion of MN and V1 interneuron number and transcriptional heterogeneity, culminating in cohorts of neurons that exhibit striking molecular similarity to mammalian motor circuits. CRISPR/Cas9-mediated gene disruption of the limb MN and V1 determinants FoxP1 and Engrailed-1, respectively, results in severe but selective deficits in tail and limb function. Our work thus demonstrates that neural diversity scales exponentially with increasing behavioral complexity and illustrates striking evolutionary conservation in the molecular organization and function of motor circuits across species.

Keywords: conservation; diversity; interneuron; locomotion; motor neurons.


Conflict of interest statement

DECLARATION OF INTERESTS We declare no competing interests.

Figures

Figure 1.
Figure 1.. Loss of tail and emergence of limb movement during frog metamorphosis.
A-G. Larval escape, tail-based and limb-based locomotion during Xenopus laevis metamorphosis. Stages across frog metamorphosis are divided into seven bins according to their anatomical features (Nieuwkopp and Faber; NF): NF37–38 (A; dark blue), NF44–48 (B; green), NF52–55 (C; blue), NF57–58 (D; purple), NF59–62 (E; pink) NF63–64 (F; orange) and juvenile (G; red). We further grouped stages in larval escape (A), tail-based (B-D) and limb-based (E-G). For each stage, a schematic of tadpole anatomy (top row, adapted from Xenopus illustrations © Natalya Zahn, 2022); a SLEAP skeleton (yellow) superimposed onto an image of a recorded animal with all tracked points indicated (A-G, middle row); and an example of the distance traveled by 7 animals for NF37–38 (A, bottom row, arrows) or by a single animal from NF44–48 to juvenile stage (B-G, bottom row) are shown. Trajectories of the distance traveled show distinct patterns at each stage: coiling escape swimming (A; animals are mostly stationary), free-feeding exploration of the whole dish (B) with a transition to edge tracking from NF44–48 (B) to juvenile (G) stage. H-L. Quantification of tadpole and frog movement. The percentage of time spent moving (H) and the length of the distance traveled (I) per one-hour imaging session, increase from NF37–38 to NF44–48 and then stay constant for successive stages (H-I; NF37–38 versus NF44–48, p = <0.0001). Mean speed increases stepwise from NF37–38 to NF52–55, and then remains constant (J; for NF37–38 versus NF44–48 and NF37–38 versus NF52–55, p = <0.0001; NF44–48 versus NF52–55, p = 0.019). Acceleration increases from NF37–38 to NF44–48 and then remains constant (K, NF37–38 versus NF44–48, p = <0.0001). Turning, calculated as the mean directional change of the body-part trajectory every 8th frame, decreases from NF37–38 to NF44–48, then increases from NF57–58 to juvenile stage (L; 0 degree angle is parallel indicating no turning; for NF37–38 versus NF44–48, NF37–38 versus juvenile and NF57–58 versus NF63–64, p = <0.0001; for NF57–58 versus NF59–62 and NF59–62 versus NF63–64, p = 0.02). M-P. Range and frequency of tail movement change across tadpole metamorphosis. PCA plots represent the position of the tail and its range of movement during 256 random frames (M; tail top, dark blue; tail mid, blue; tail tip, light blue). The first visible increase in tail movement is from NF37–38 to NF44–48 and the second from NF44–48 to NF57–58, then the range decreases from NF57–58 to NF63–64 (M). Quantification of the range of movement at the tail tip shows a peak at NF57–58 and a decrease from NF59–64 as the tail recedes (N; for NF44–48 versus NF57–58 and NF52–55 versus NF57–58, p = <0.0001; NF57–58 versus NF63–64, p = 0.048). Mean power spectrum of frequency of tail tip oscillations for each stage of metamorphosis, with low (0.9–4.5 Hz, dark gray) and high (4.5–20 Hz, light gray) frequency bins highlighted (O). From NF44–48 to NF59–62, the frequency spectrum is bimodal with a peak in the low and high frequency bins; at NF63–64, it is unimodal with only one low frequency peak (O). The amount of tail tip movement in the low frequency bin, represented by the sum power, decreases from NF44–48 to NF52–55, and then increases until NF63–64 (P; for NF44–48 versus NF52–55 and NF57–58 versus NF59–62, p = <0.0001; NF44–48 versus NF63–64, p = 0.02). Q-T. Gain of hindlimb movement during frog metamorphosis. PCA plots represent the position of the hindlimb and its range of movement during 256 random frames showing an increase in range from NF57–58 to NF59–62 (Q; hip, yellow; knee, orange; ankle, red; foot, brown). Quantification of the range of knee movement shows an initial increase from NF57–58 to NF59–62 and then a decrease until juvenile stage (R; for NF57–58 versus NF59–62, NF57–58 versus juvenile, NF59–62 versus NF63–64, and NF63–64 versus juvenile, p = <0.0001). Mean power spectrum of the knee oscillations for each stage of metamorphosis shows a single peak in the low frequency range (S; 0.9–4.5 Hz, dark gray). Coordination of the left and right knees changes from random at NF57–58 to bilaterally synchronous at NF63–64 (T; +1 = synchronous, 0 = random, −1 = alternating; NF57–58 versus NF59–62, p = 0.003; NF57–58 versus NF63–64, p = <0.0001; NF59–62 versus NF63–64, p = 0.02). n = 172 animals for NF37–38; n = 47 animals for NF44–48; n = 24 animals for NF52–55, n = 11 animals for NF57–58, n = 13 animals for NF59–62, n = 8 animals for NF63–64, n = 13 animals for juvenile stage. Scale bar in A indicates the number of times the animal was present in a specific area of the dish from no time (100 frames, yellow) to many times (103 frames, blue). Scale bar in M indicates the color-code of the first principal component of variation of the aligned tail and limb positions in M and Q.
Figure 2.
Figure 2.. Spinal motor neurons expand and diversify during Xenopus frog metamorphosis.
A-D. Motor neuron number increases during metamorphosis. Motor neurons in the axial (AX), thoracic (TH), and lumbar (LU) spinal cord express the pan-motor neuron markers Hb9 (green) and Isl1/2 (red) and increase in number between NF35–38 (A), NF44–47 (B) and NF54–55 (C). Bar graph (D) shows the total number of Hb9+ Isl1/2+ (NF37–38 and NF44–47) or ventral Isl1/2+ (NF54–55) motor neurons per 15 μm ventral horn (mean ± SEM for n = 3–10 animals) of brachial, thoracic, and lumbar spinal cord. E-H. Medial motor column (MMC) emerges in larval Xenopus and expands during metamorphosis. The antibody against the Lhx3 transcriptional determinant of MMC identity (red) labels a subset of Hb9+ motor neurons (green) in the spinal cord of NF35–38 (E), NF44–47 (F), and NF54–55 (G) tadpoles. Shown are axial (AX; NF35–38), thoracic (TH; NF44–47 and NF54–55) and brachial (BR; NF54–55) sections (see Figure S3 for the images of additional immuno-labeled TH, BR and LU sections). The graph (H) shows the number of Lhx3+ Hb9+ MMC motor neurons per 15 μm ventral horn (mean ± SEM for n = 4–14 animals) at brachial, thoracic and lumbar levels at NF35–38, NF44–47, NF54–55. I-P. Lateral (LMC), preganglionic (PGC) and hypaxial (HMC) motor columns emerge in free-swimming tadpoles and expand during metamorphosis. Side view of an NF41–43 spinal cord (I) stained for the LMC determinant, Raldh2 (red), and Isl1/2 (blue) reveals the nascent brachial and lumbar populations of limb-innervating motor neurons. The LMC determinants, FoxP1 (red) and Raldh2 (green), jointly label a motor neuron subset (Isl1/2, blue) at brachial and lumbar levels at NF44–47 (J) and NF54–55 (K). The number of LMC motor neurons (L) per 15 μm ventral horn (mean ± SEM for n = 3–10 animals) of brachial, thoracic, and lumbar segments at NF44–47 and NF54–55. Frog PGC motor neurons labeled by the PGC transcriptional determinants, FoxP1 (red) and Isl1/2 (blue), at thoracic levels at NF44–47 (M) and 54–55 (N). Neither LMC nor PGC is present at NF35–38 (see Figure S3G-J). The number of HMC (O) and PGC (P) motor neurons per 15 μm ventral horn (mean ± SEM for n = 5–11 animals) of brachial, thoracic, and lumbar levels at NF44–47 and NF54–55. HMC motor neuron number at the thoracic level was calculated by subtracting the number of MMC and PGC motor neurons from the total number of motor neurons. T-U. Conservation of MN proportions in developing limb circuits of frogs and mice. Number of LMC and MMC motor neurons (left) and their percentage (right) in the total motor neuron population at brachial and lumbar levels (T) at frog NF54–55 and E13.5 mouse. Number of HMC, PGC, and MMC motor neurons (left) and their percentage (right) in the total motor neuron population at the thoracic level (U) at frog stage NF54–55 and E13.5 mouse. Shown is the mean ± SEM for n = 5–11 animals. The embryonic mouse counts were extracted from Agalliu et al, 2009 with the SEM estimated from the provided plots. Q-S. Summary of motor neuron development in tadpoles. Schematics showing the rostrocaudal distribution of MMC (Lhx3+, Isl1/2+ and Hb9+), HMC (Isl1/2+ and Hb9+) and PGC (FoxP1low, Raldh2+, Lhx3+, Isl1/2+ and Hb9+) subsets in NF35–38 (Q), 44–47 (R), and 54–55 (S, top) spinal cords. Schematized spinal cord hemi-section of a limb and thoracic segment depicting the relative position and molecular markers of each motor column along the dorsoventral, mediolateral axis (S, bottom). Shown is either a spinal cord cross section (NF35–38/44–47) or hemi-section (NF54–55) with the central canal and outer edge indicated (dotted line). Scale bar, 50 μm (except in I, 100μm). Tadpole drawings adapted from Xenopus illustrations © Natalya Zahn (2022).
Figure 3.
Figure 3.. Linking motor neuron molecular profiles to anatomical projection pattern during frog metamorphosis.
A-D. GFP-labeled motor neurons in a limbed NF56 218–2:GFP tadpole (A) innervate the forelimb (B), trunk (C), or hindlimb (D), in line with the expected innervation patterns of the molecular populations detected at this stage. Scale bar, 1 mm. E-F. Motor neurons in free-swimming NF45 218–2:GFP:tdT tadpoles are distributed throughout the spinal cord and extend axonal arbors into the myotomal cleft, as shown by myosin heavy chain immunohistochemistry (green; F). Scale bar, 150 μm. G-I. GFP-labeled motor neurons at the limb levels in 218–2:GFP tadpoles at NF39–40 (G), NF45 (H) and NF50–54 (I) express the pan-motor neuron marker Isl1/2 (red). At NF45 and at NF5052, a Raldh2/FoxP1-positive population (blue) of motor neurons, consistent with their LMC identity, also expresses GFP. Scale bar, 50 μm. J-K. A pioneering population of LMC motor neurons at free-swimming stage NF47 expresses the LMC marker Raldh2 (green) and their axons, marked with the acetylated-α-Tubulin antibody (red), extend to the developing limb area prior to limb bud emergence. Scale bar, 50 μm. L. Schematic of medial and lateral motor column innervation patterns and the location of the rhodamine dextran application. Scale bar, 50 μm. M-O. Retrograde labeling with rhodamine dextran (RhD, red) marks a population of laterally positioned motor neurons that co-express MN (Isl1/2, green; M) and LMC (FoxP1/Raldh2, red; N/O) markers. Scale bar, 50 μm.
Figure 4.
Figure 4.. V1 inhibitory interneurons increase in number with metamorphic expansion of motor neurons.
A-D. Immunoreactivity against the Engrailed1 (red), a V1 inhibitory interneuron (V1) marker, and Isl1/2 (green), a motor neuron (MN) marker, labels ~1 V1 and ~2.5 MNs at NF35–38 (A), ~2 V1s and ~5.5 MNs at the thoracic levels at NF44–47 (B), and around ~40 and ~45 V1s and MNs at the thoracic levels (C)and ~72 and ~75 V1 and MNs at the lumbar levels at NF54–55 (D), respectively. Tadpole drawings adapted from Xenopus illustrations © Natalya Zahn (2022). E-F. Number (E) and the ratio (F) of V1s and MNs at axial (NF35), thoracic and lumbar (NF47 and 55 tadpole and E14 mouse) levels. At NF35 and NF47, the V1:MN ratio is under 0.5, and then approaches 1 at NF54–55 for both thoracic and lumbar segments in metamorphosing frogs, similar to in the embryonic mouse. Shown in E is the mean ± SEM for n = 4–17 animals per 15 μm ventral horn. G-H. Position of V1 interneurons at lumbar levels of NF54 frog (G) and P0 mouse (H). Plotted on the left are individual cells with 50% transparent black to highlight overlap.
Figure 5.
Figure 5.. Temporal pattern of V1 clades emergence during the Xenopus swim-to-walk transition.
A. At escape swimming stages, NF35–38, V1s show little diversity. The Pou6f2, FoxP2, and Sp8 clades are absent, and around 50–60% of V1s are marked by MafA and MafB. B. At free-swimming stages, NF44–47, V1s start to diversify. The Pou6f2 and FoxP2 clades emerge. C. During metamorphosis, with limb emergence, the Sp8 clade emerges and V1s acquire the four clade organization observed in the mouse. D. Percentage of V1 interneurons expressing a single clade marker (FoxP2, Pou6f2, Sp8, MafA) in axial (NF35–38), thoracic (NF44–47 and NF54–55) or lumbar spinal cord (NF54) (mean ± SEM, n = 4–10 animals). E. The sequence of V1 clade emergence. MafA present in escape swimming. MafA, Pou6f2, FoxP2 present in free-swimming. All four clades present at limb-circuit stages. F. Entropy analysis of “diversity” index based on transcription factor expression shows a significant increase in overall transcriptional diversity between NF35 and NF45, and a peak of diversity reached at NF54–55. The diversity at the peak matches that of the neonate mouse. Tadpole drawings adapted from Xenopus illustrations © Natalya Zahn (2022).
Figure 6.
Figure 6.. Conservation of V1 clade organization and transcriptional diversity between frog and mouse.
A. Mouse V1 clades are conserved in the frog. Antibodies against FoxP2, Pou6f2, MafA, and Sp8 transcription factors (green) label subsets of En1+ V1 interneurons (red) in lumbar spinal cord of NF54–55 tadpoles. Shown is a ventral hemi-section of spinal cord with the central canal and outer edge indicated (dotted line). B. Spatial distribution plots of V1FoxP2, V1Sp8, V1Pou6f2, and V1MafA at the lumbar level in NF54–55 tadpole (left) and P0 mouse (right). Frog and mouse V1 clades have similar settling positions. Frog spinal cords were resized to mouse-like proportions (see STAR Methods). Plotted are interneurons from at least 20 lumbar spinal cord hemi-sections from at least 2 animals. C. Frog V1 clades are mutually exclusive in their expression. The bar plot shows the percentage of V1s expressing a singular or combination of clade markers, FoxP2, Sp8, Pou6f2 and MafA. Shown is mean ± SEM, n = 2–4 animals D. V1 molecular subsets are present in similar proportions in the frog and mouse. Upper bar plot shows the percentages of V1s expressing a given transcription factor in lumbar NF54–55 tadpole (black) and P0 mouse (gray) spinal cords determined by IHC. Lower bar plot shows the fold change in percentage of V1 subsets between the frog and mouse; no change larger than 2-fold observed. Shown is mean ± SEM (2TF: n = 2–6 animals; 3TF: n = 2 animals). E. V1 interneurons marked by two and three transcription factors reveal species-enriched subsets. Shown is fold enrichment of V12TF and V13TF interneurons with > 2-fold enrichment in NF54–55 frog (black) or P0 mouse (gray) spinal cord. F-I. Mouse thoracic-enriched populations of V1 are present and enriched at the thoracic levels in frog. V1Nr4a2+Otp, V1Sp8+Otp, V1Nr4a2+FoxP2, V1MafB+FoxP2 populations are present in the frog (gray) thoracic spinal cord (left) and significantly enriched compared to the lumbar level (right). The same rosto-caudal enrichment was reported in the mouse (black). Shown is mean ± SEM for n = 2–6 animals with significant differences (p < 0.05) plotted.
Figure 7.
Figure 7.. FoxP1 CRISPR loss-of-function causes loss of range and coordination of limb movement in Xenopus frogs.
A-B. Generation of unilateral FoxP1 CRISPR mutant frogs by injection of FoxP1 sgRNA and Cas9 protein in a single cell at two-cell stage (A) results in NF54–55 tadpoles in which FoxP1 (red) and Raldh2 (green) immunoreactivity is selectively absent from the mutant side of the spinal cord (B). Isl1/2-positive (blue, marker for motor neurons in ventral spinal cord) neurons are present on both wildtype and mutant side of spinal cord (B). Scale bar, 50 μm. C-D. Cell-type characterization in unilateral FoxP1 CRISPR mutant animals. Quantification of spinal cord cell numbers at brachial (Br), thoracic (Th) and lumbar (Lu) reveals loss of FoxP1+ Isl1+ neurons at all levels (C; uninjected vs. FoxP1 ½: Br, p = <0.0001; for Th and Lu, p = 0.002) and loss of Raldh2+ Isl1+ neurons at brachial and lumbar levels (D; uninjected vs. FoxP1 ½: Br, p = 0.025; Lu, p = 0.029). n = 6 for WT, n = 6 unilateral FoxP1 CRISPR. E-I. Loss of range and coordination of movement of the FoxP1 mutant hindlimb. WT (E) and unilateral FoxP1 CRISPR (F) juvenile frogs with SLEAP skeleton (left, yellow) superimposed on animal image. PCA plots represent the position of the fore and hind limb and their range of movement during 256 random frames and show a different position and range of the FoxP1 CRISPR limbs compared to WT or the uninjected side (E-F, right; hip and shoulder, yellow; knee and elbow, orange; ankle and wrist, red; foot, brown). Scale bar in E and F indicates the color-code of the first principal component of variation of the aligned fore and hind limb positions. The FoxP1 CRISPR mutant knee also differs in its mean angle (G; for WT L versus FoxP1 ½, WT R versus FoxP1 ½ and uninjected versus FoxP1 ½, p = <0.0001), and its movement range is reduced (I; WT L versus FoxP1 ½, p = 0.0006; WT R versus FoxP1 half, p = 0.0002; uninjected versus FoxP1 1/2, p = <0.0001). In contrast, the uninjected side displays a higher range of movement (H; WT L versus uninjected, p = 0.009; WT R versus uninjected, p = 0.025). Left-right coordination between knee joints is lost in FoxP1 CRISPR animals (I; +1 = bilateral synchronous, 0 = random, −1 = alternate synchronous; WT versus FoxP1 ½ CRISPR, p = <0.0001). n = 13 for WT, n = 14 for unilateral FoxP1 CRISPR. J-L. FoxP1 CRISPR mutant hindlimbs maintain dominant frequency but lose power. Mean power spectrum of knee oscillations shows only one peak in the low frequency range for WT, uninjected and FoxP1 CRISPR hindlimbs (J; 0.9–4.5 Hz, dark gray). At the knee joint, the amount of movement in the low frequency bin (0.9–4.5 Hz), represented by the sum power, is lower on the mutant side compared to both the uninjected side and WT (K; for WT L versus FoxP1 ½ CRISPR and WT R versus FoxP1 ½ CRISPR, p = <0.0001; uninjected versus FoxP1 ½ CRISPR, p = 0.021). Dominant frequency is unaffected on both uninjected and FoxP1 CRISPR sides (L). n = 13 for WT, n = 14 for unilateral FoxP1 CRISPR.
Figure 8.
Figure 8.. En1 CRISPR loss-of-function causes a loss of limb frequency in juvenile Xenopus laevis.
A-C. Characterization of En1 CRISPR mutant animals. En1 sgRNA and Cas9 protein were injected at one cell stage to generate bilateral mutant animals, resulting in loss of En1 immunoreactivity from both sides of the spinal cord at NF39–40 (A right, white), or in one cell at two-cell stage to generate unilateral mutant animals with loss of En1 immunoreactivity only from the En1 CRISPR side of the spinal cord at NF54–55 (B right, white). TIDE analysis reveals high efficiency of En1 sgRNA in generating NF44–48 bilateral, and ~25% mutation rate for juvenile unilateral CRISPR animals (C; n = 8 for WT, n = 36 for En1 bilateral mutants, n = 8 for En1 unilateral mutants). Scale bar, 50 μm. D-H. Range and coordination of movement are unaffected in juvenile unilateral En1 CRISPR mutant animals. WT (D) and unilateral En1 CRISPR (E) juvenile frogs with SLEAP skeleton (yellow) superimposed on animal image. PCA plots represent the position of the fore and hind limb and their range of movement during 256 random frames and show no visible difference in range between WT, uninjected and En1 CRISPR sides (D-E, right; hip and shoulder, yellow; knee and elbow, orange; ankle and wrist, red; foot, brown). Scale bar in D and E indicates the color-code of the first principal component of variation of the aligned fore and hind limb positions. Unilateral En1 CRISPR mutant knees show similar mean angle (F) and angle range (G) as WT. Left-right coordination between knee joints is also unaffected in unilateral En1 CRISPR animals, as their pattern of movement resembles the bilateral synchronicity of WT (H; +1 = bilateral synchronous, 0 = random, −1 = alternate synchronous). n = 13 for WT, n = 8 for unilateral En1 CRISPR. I-K. Lower dominant frequency in juvenile En1 CRISPR mutant hindlimbs. Mean power spectrum of the knee oscillation shows only one peak in the low frequency bin (0.9–4.5 Hz, dark gray) for WT and unilateral En1 CRISPR animals (I). At the knee joints, the amount of movement, represented by the sum of the power, is similar between WT and unilateral En1 CRISPR animals (J). However, the dominant frequency of the knees is lower in unilateral En1 CRISPR animals compared to WT (K; WT vs En1 ½ CRISPR, p = 0.0002). n = 13 for WT, n = 8 for unilateral En1 CRISPR.

Similar articles

References

    1. Grillner S., and El Manira A. (2020). Current Principles of Motor Control, with Special Reference to Vertebrate Locomotion. Physiol. Rev. 100, 271–320. 10.1152/physrev.00015.2019. - DOI - PubMed
    1. Biewener A., and Patek S. (2018). Animal Locomotion (Oxford University Press; ).
    1. Gosgnach S., Bikoff J.B., Dougherty K.J., El Manira A., Lanuza G.M., and Zhang Y. (2017). Delineating the Diversity of Spinal Interneurons in Locomotor Circuits. J. Neurosci. Off. J. Soc. Neurosci. 37, 10835–10841. - PMC - PubMed
    1. Dasen J.S. (2022). Establishing the Molecular and Functional Diversity of Spinal Motoneurons. In Vertebrate Motoneurons M. J. O’Donovan and Falgairolle M., eds. (Springer International Publishing; ), pp. 3–44. 10.1007/978-3-031-07167-6_1. - DOI - PubMed
    1. Wilson A.C., and Sweeney L.B. (2023). Spinal cords: Symphonies of interneurons across species. Front. Neural Circuits 17, 1146449. 10.3389/fncir.2023.1146449. - DOI - PMC - PubMed

Publication types

LinkOut - more resources